Because people are freaking out in some parts of the country about a supposed case resurgence, Dave Dixon thought it might be useful to look at updated regional case charts. Really not much happening. Some of the epidemic nuts just can’t let go and almost don’t want it to end. Dave’s notes:
- US case and data by state is taken from a CDC data base: https://data.cdc.gov/Case-Surveillance/United-States-COVID-19-Cases-and-Deaths-by-State-o/9mfq-cb36 , This data base appears to be corrupted, especially for California, in early 2021. Therefore, all data for all states prior to 8/1/2021 is the version published by the CDC on 10/24/2021. All data starting 8/1/2021 is the most current available data, published by the CDC on 4/11/2022, plotted to 4/09/2022.
- State population estimates used to calculate rates per 100k are taken from the CDC data file nst-est2019-01.xlsx, available here: https://www.census.gov/newsroom/press-kits/2019/national-state-estimates.html
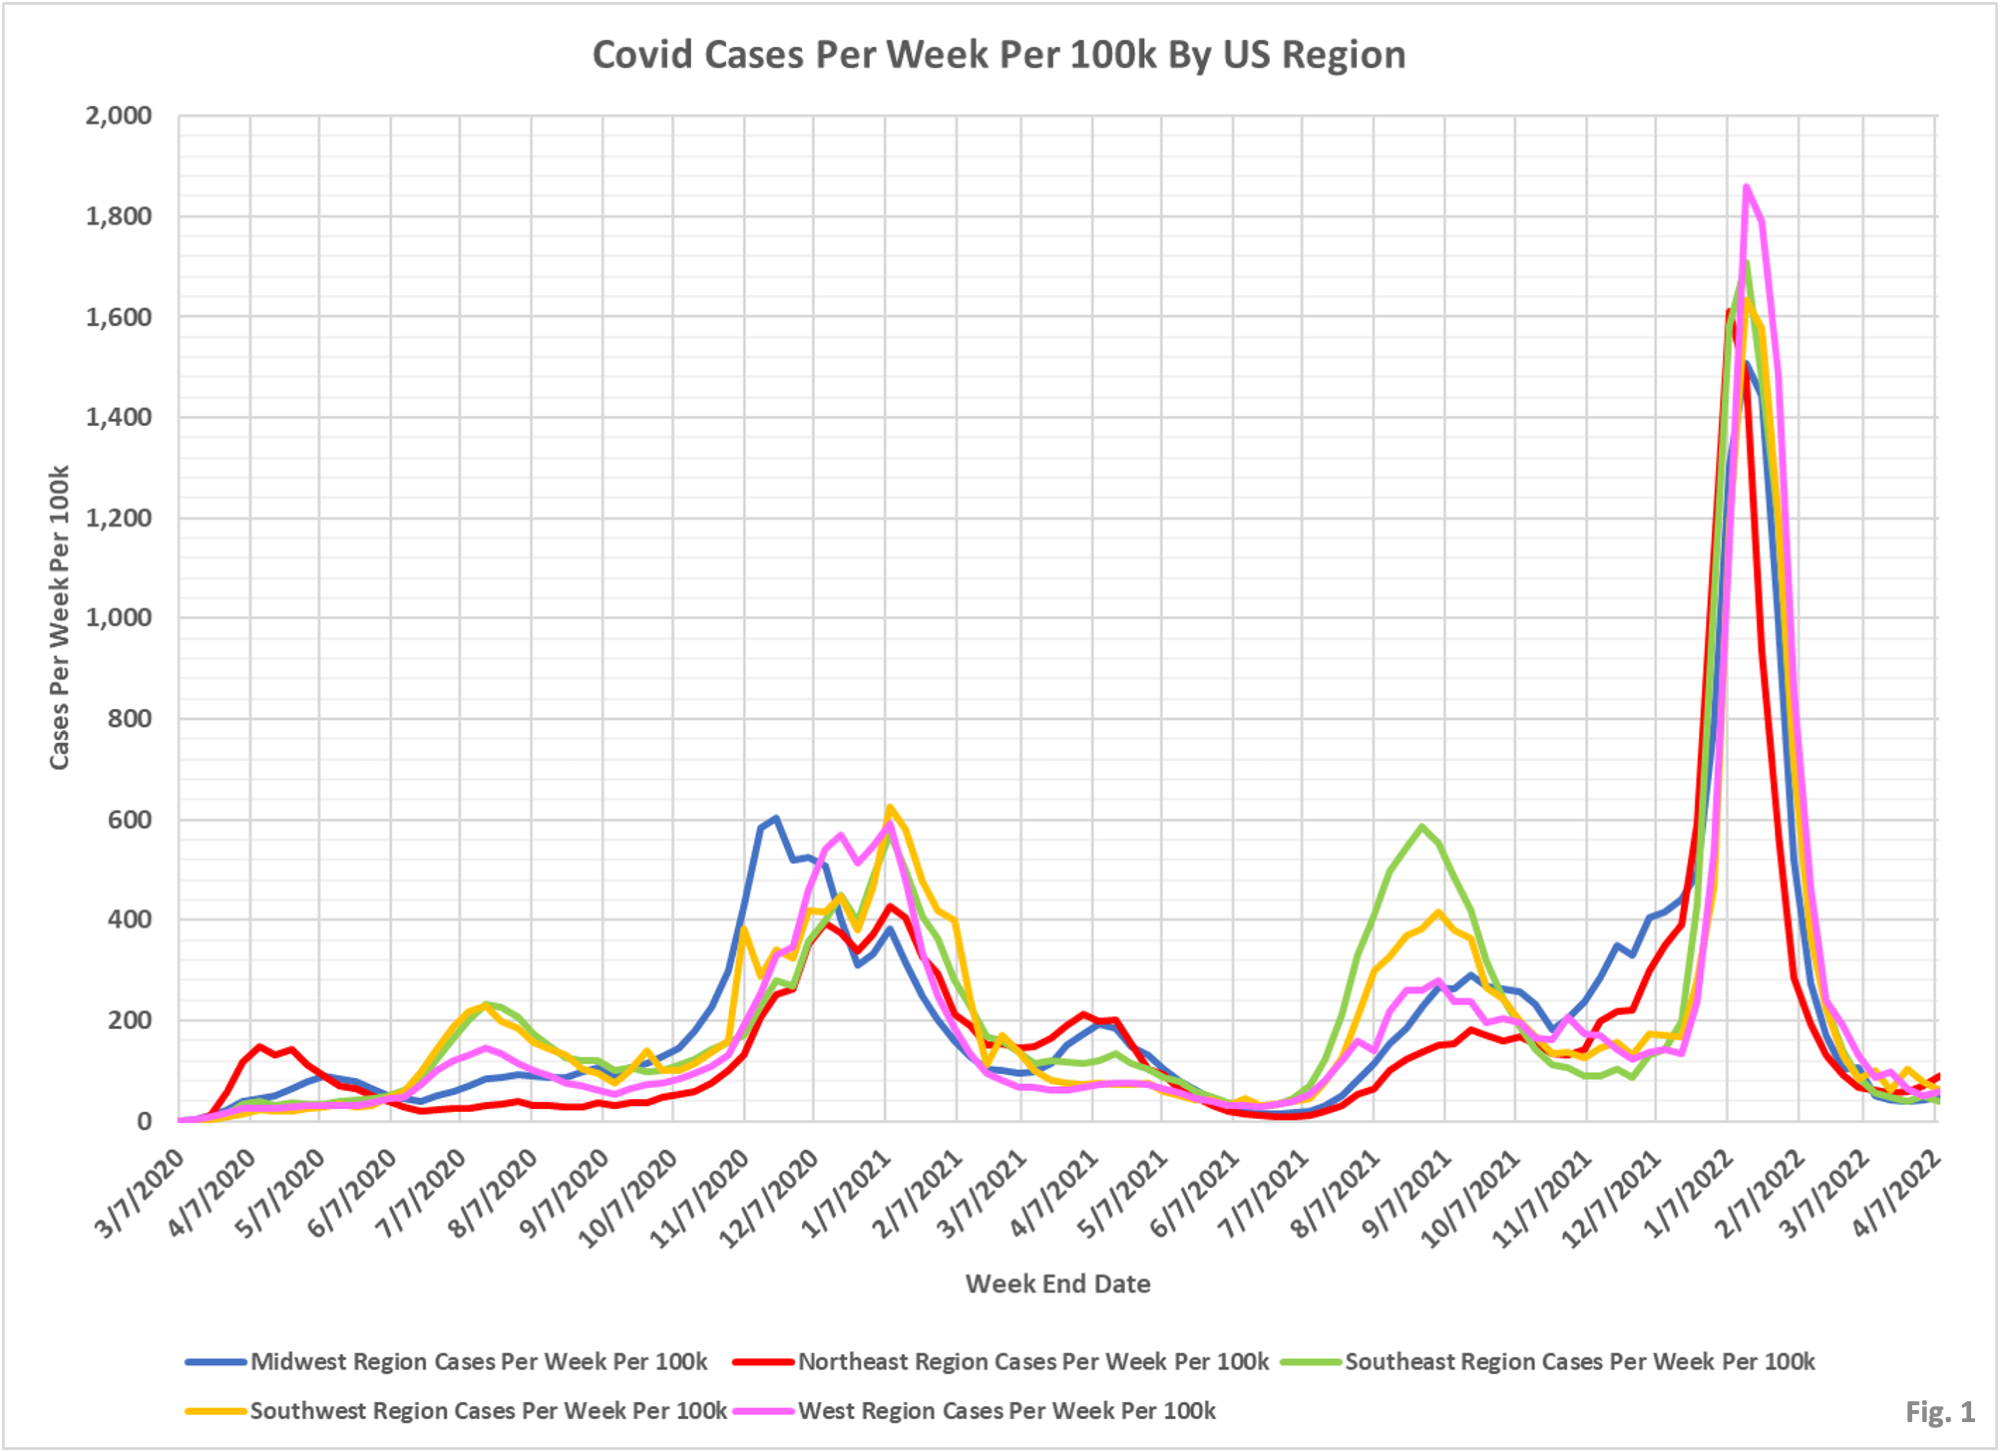
- Fig. 1: Covid cases per week per 100k by US Region. The Omicron wave, peaking in January 2022, is remarkably similar across each region.
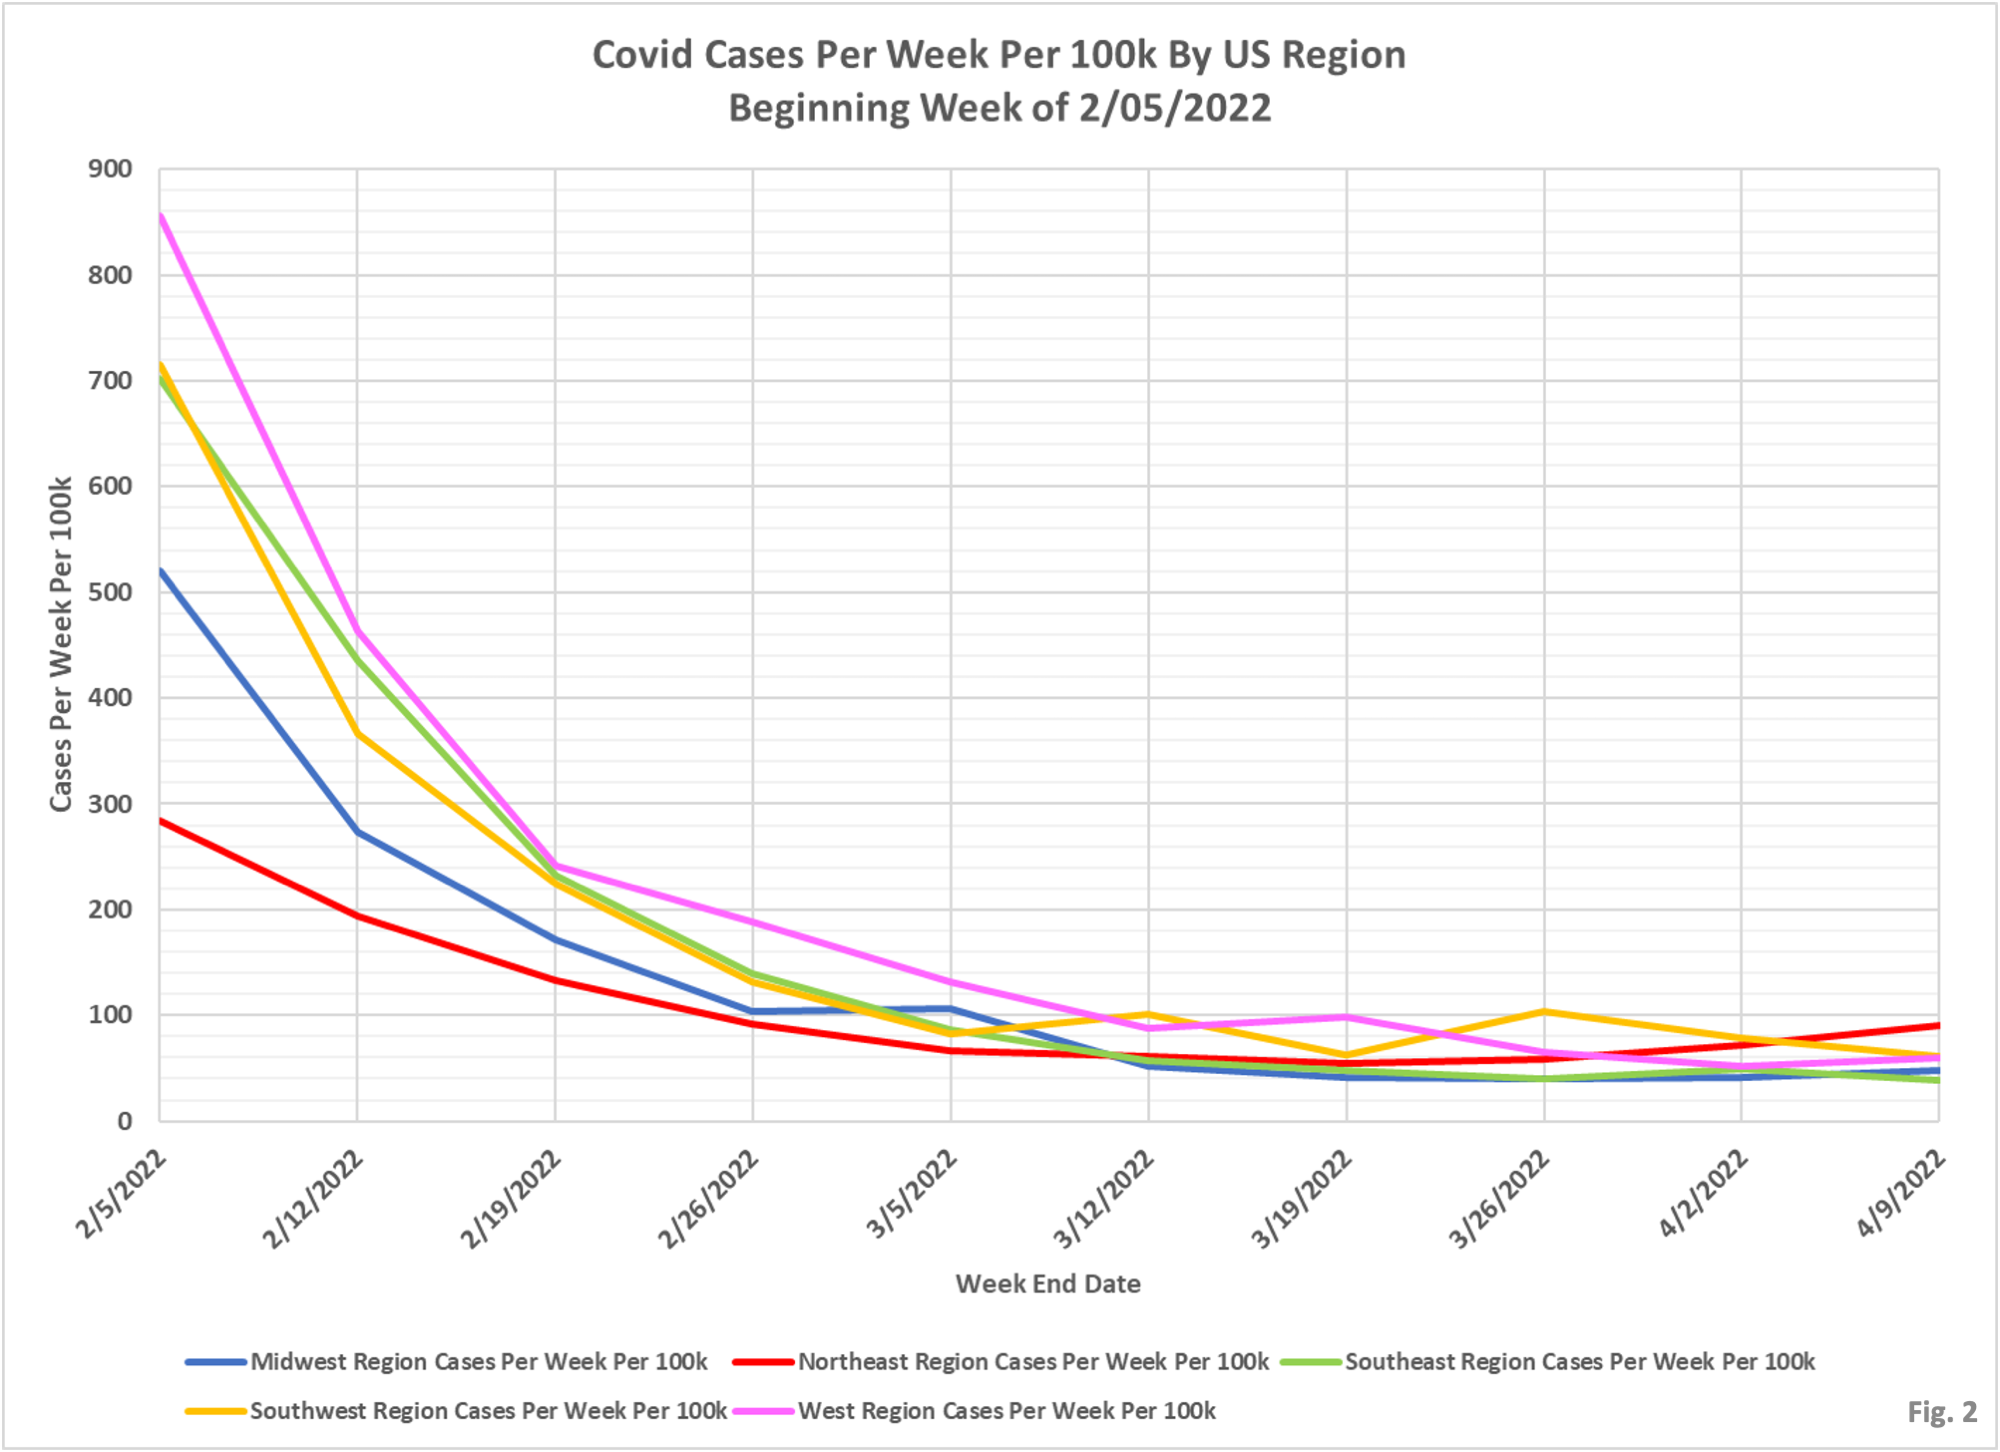
- Fig. 2: Covid cases per week per 100k by US Region, starting 2/05/2022. All regions have been at or below 100 cases per 100k since 3/12/2022, and no region appears to be rising appreciably at the moment.
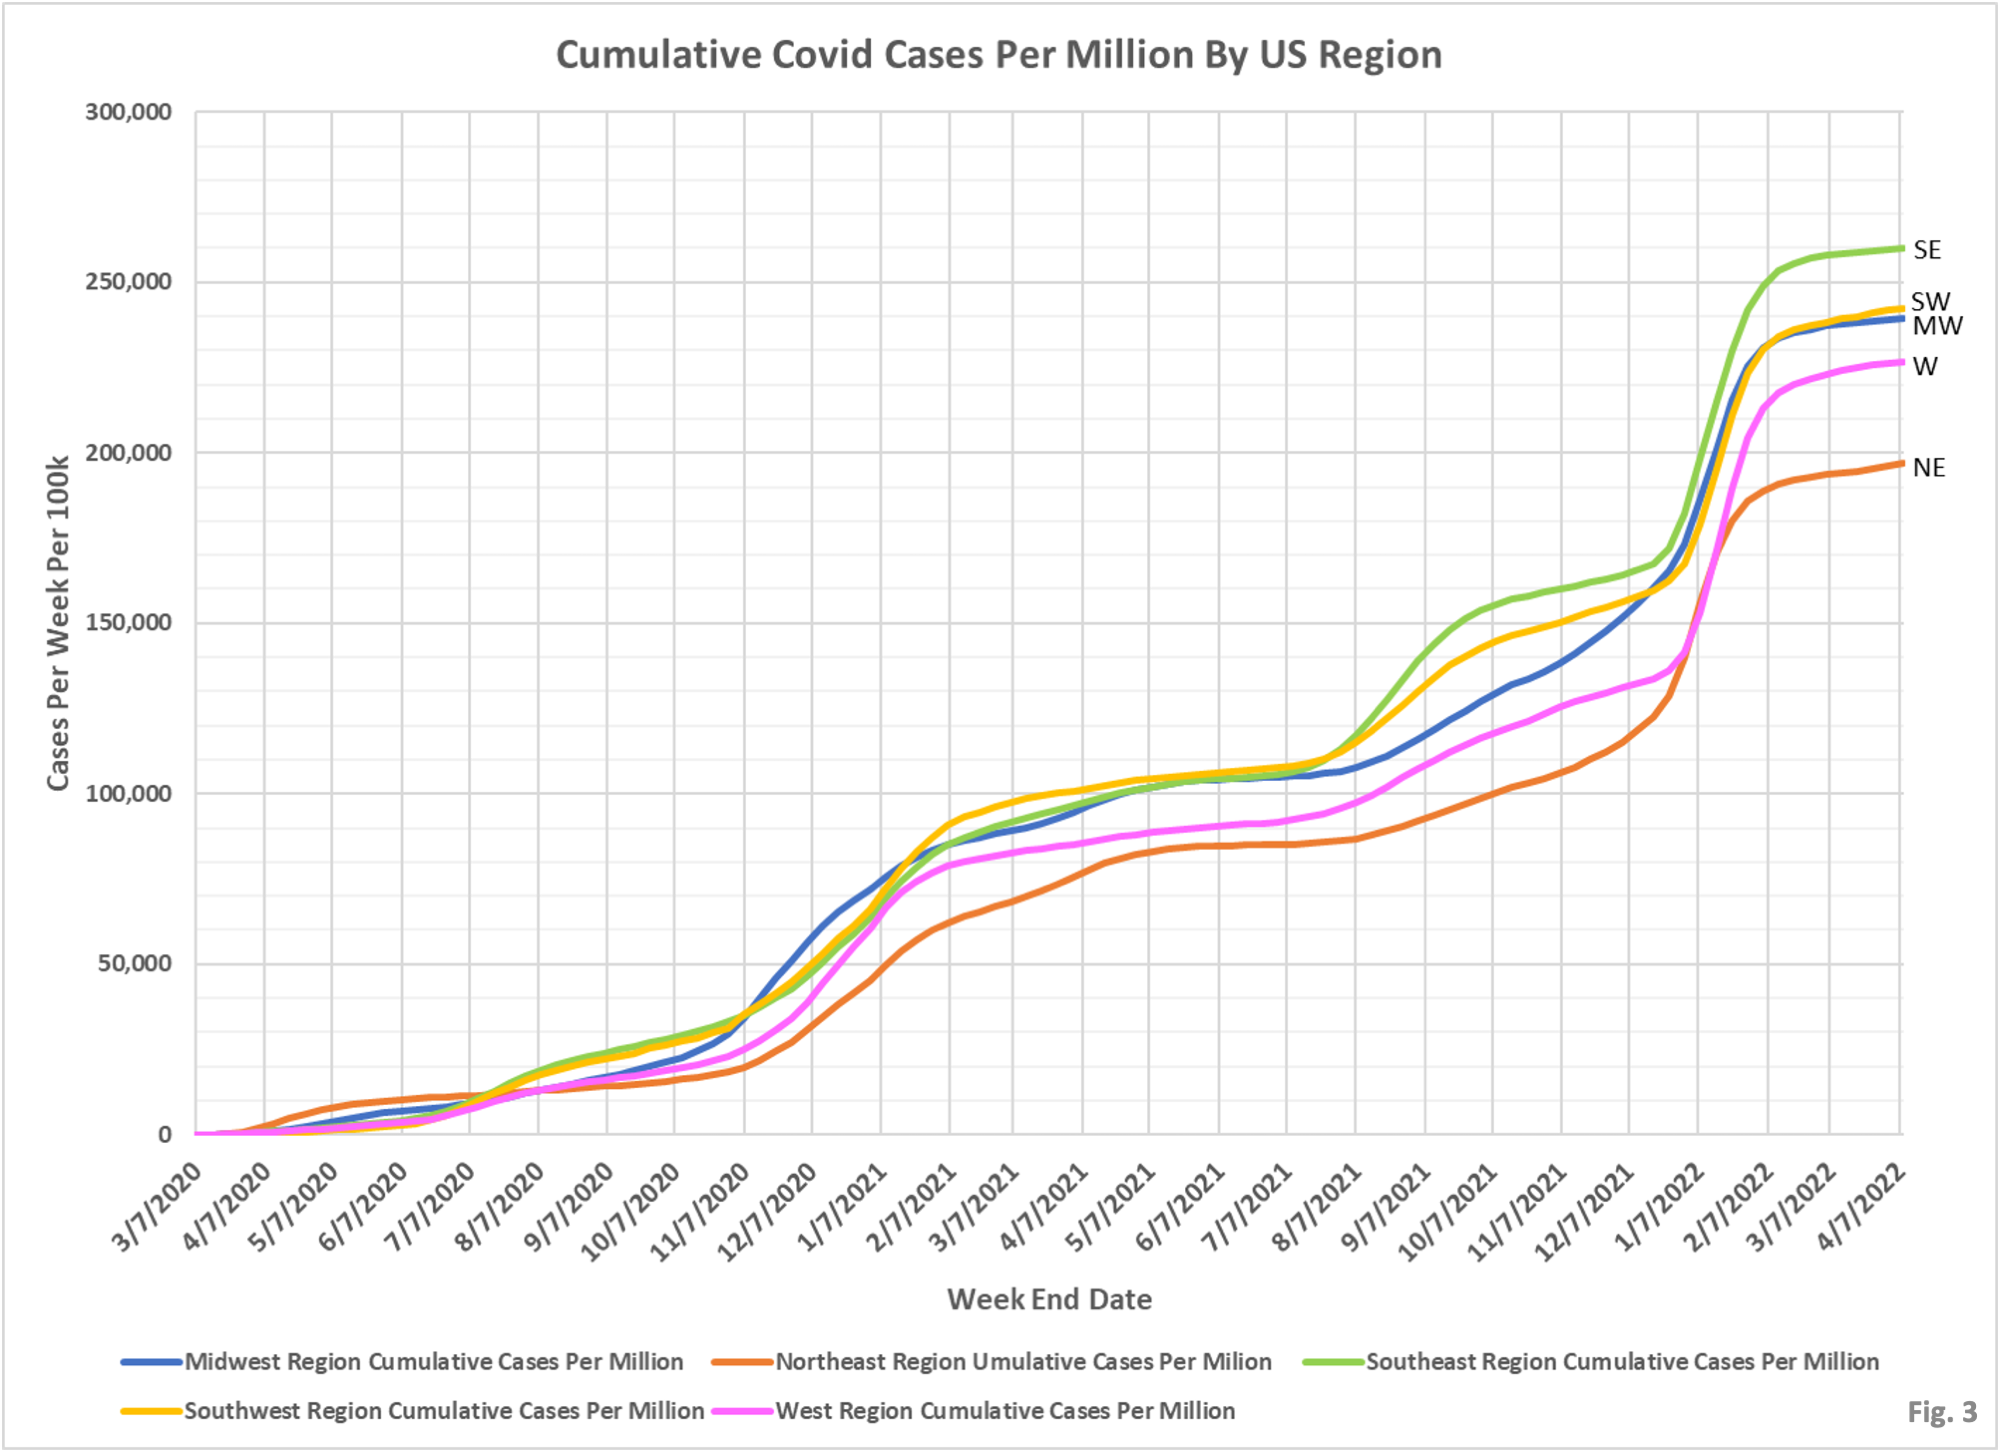
- Fig. 3: Cumulative Covid cases per million per region.

Thanks to you and Dave for your continued logic on this topic. You gave a great talk with the MaskOffMn people – very informative!
Happy Easter, Chag Semeach, solstice or whatever you might be celebrating during this time. The religious holiday stories fit perfectly with this topic – freedom from slavery, spiritual and political. One of the most nauseating things about this last few years is how willing people have been to blindly bow to gov’t tyranny.
The cumulative cases for the NE seems to be very low – mostlikely due to ME, VT , NH being much lower than the rest of the NE and the nation as a whole
Same with the West likely due to the very low case rates in WA & OR and possibly hawaii (assuming HA is included in the west). Removing those 5 states and every state is in just about the same place regardless of the level of compliance with any mitigation protocols.