The most interesting thing about these age group charts is Dave Dixon’s addition of a line showing the percent of the age group vaccinated. Allows you to eyeball vax effectiveness for each age group.

 Dave’s notes:
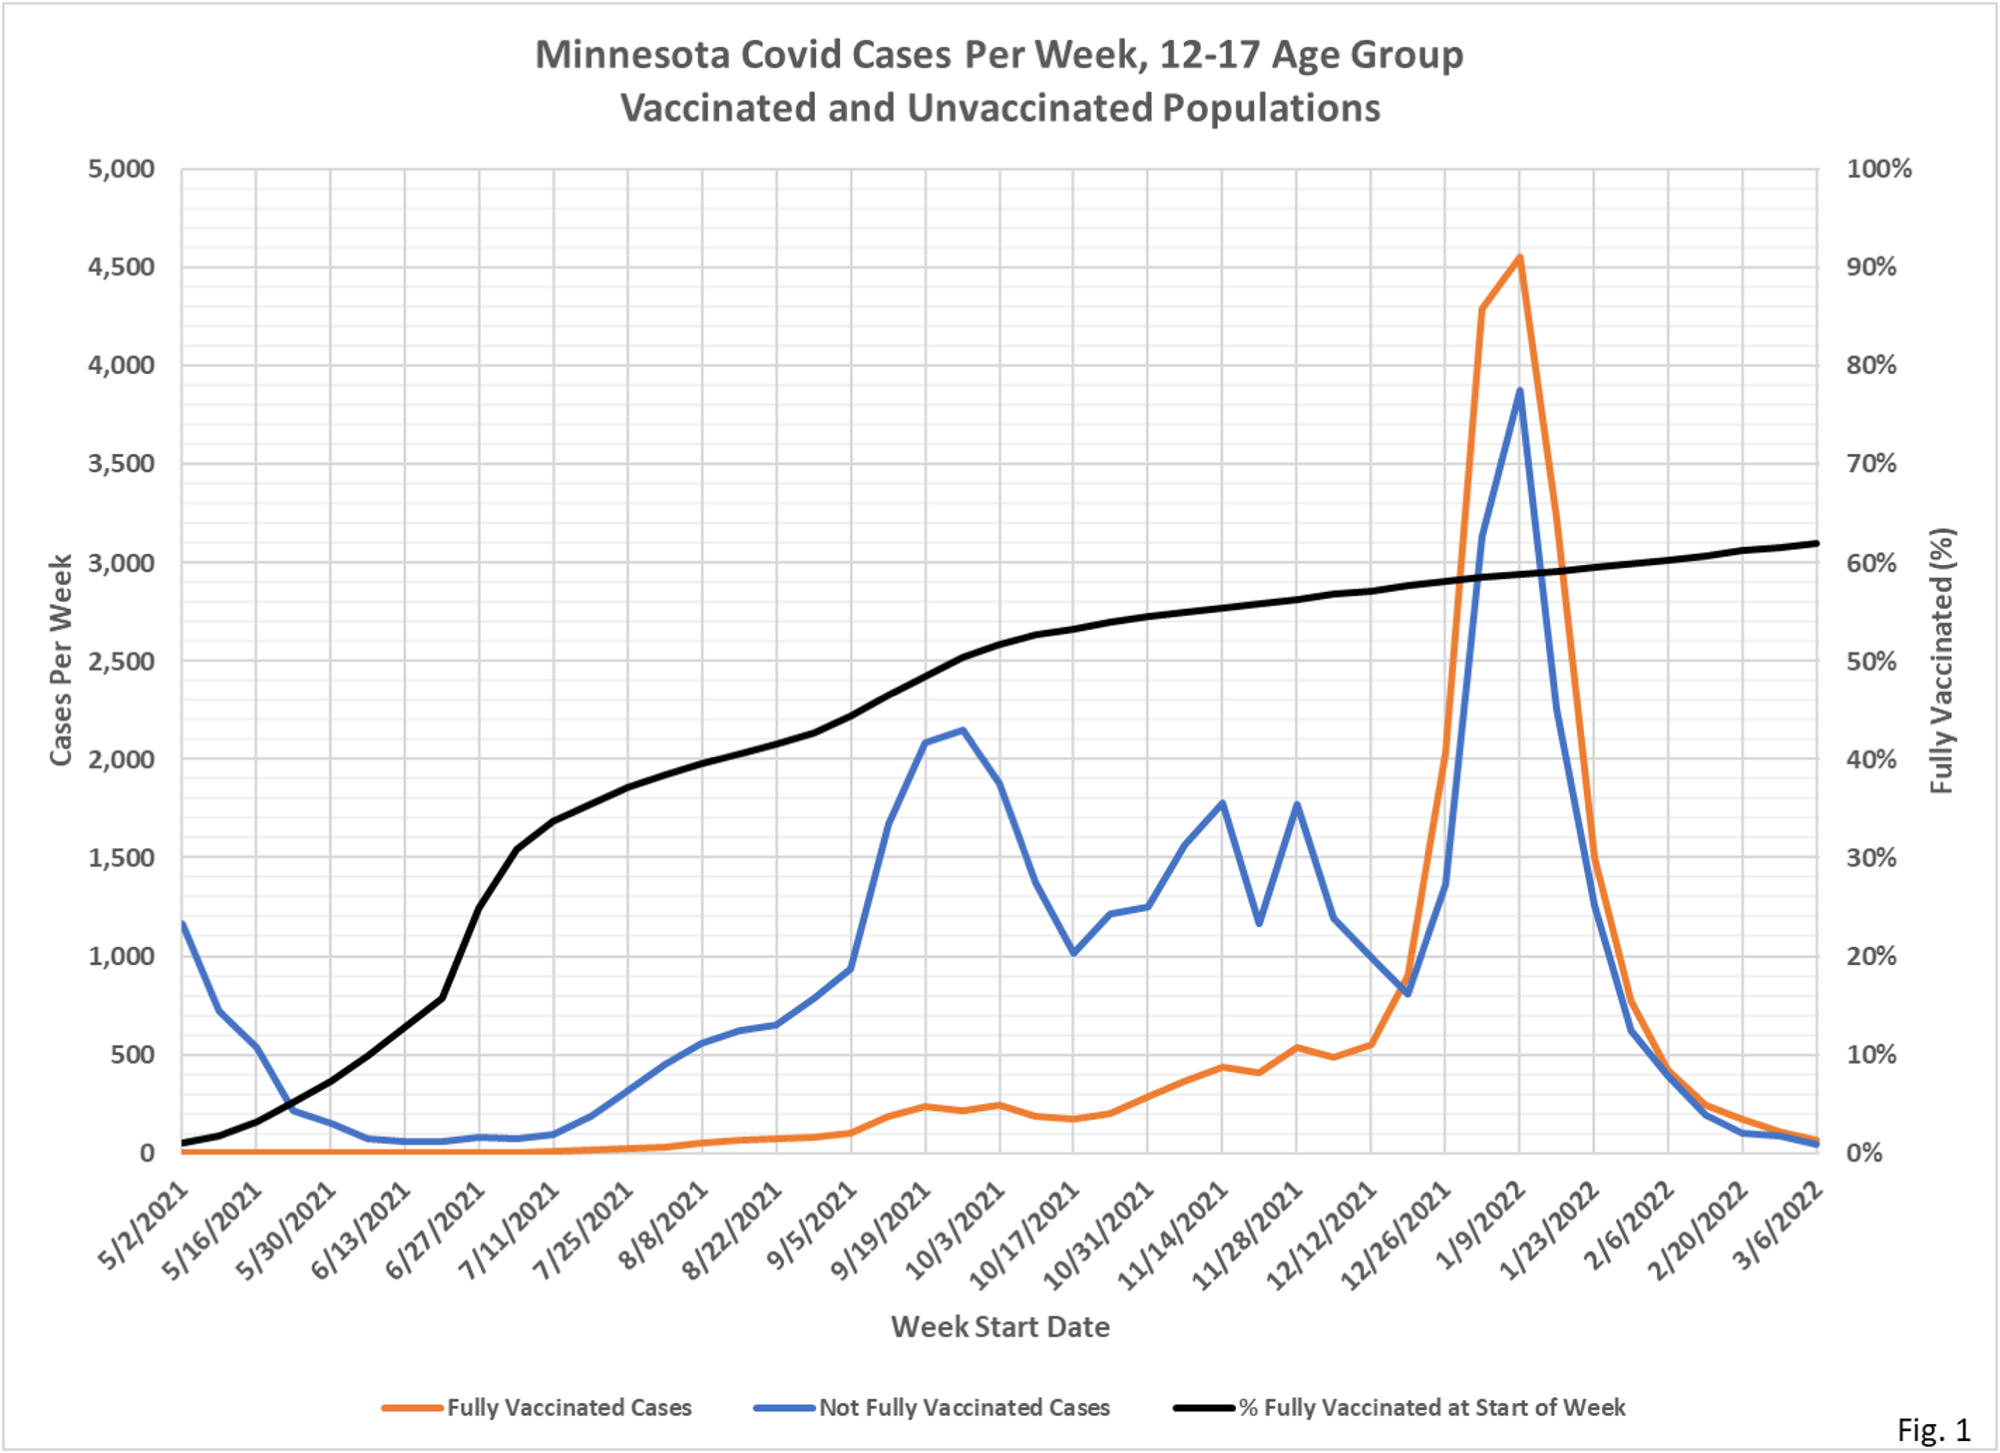
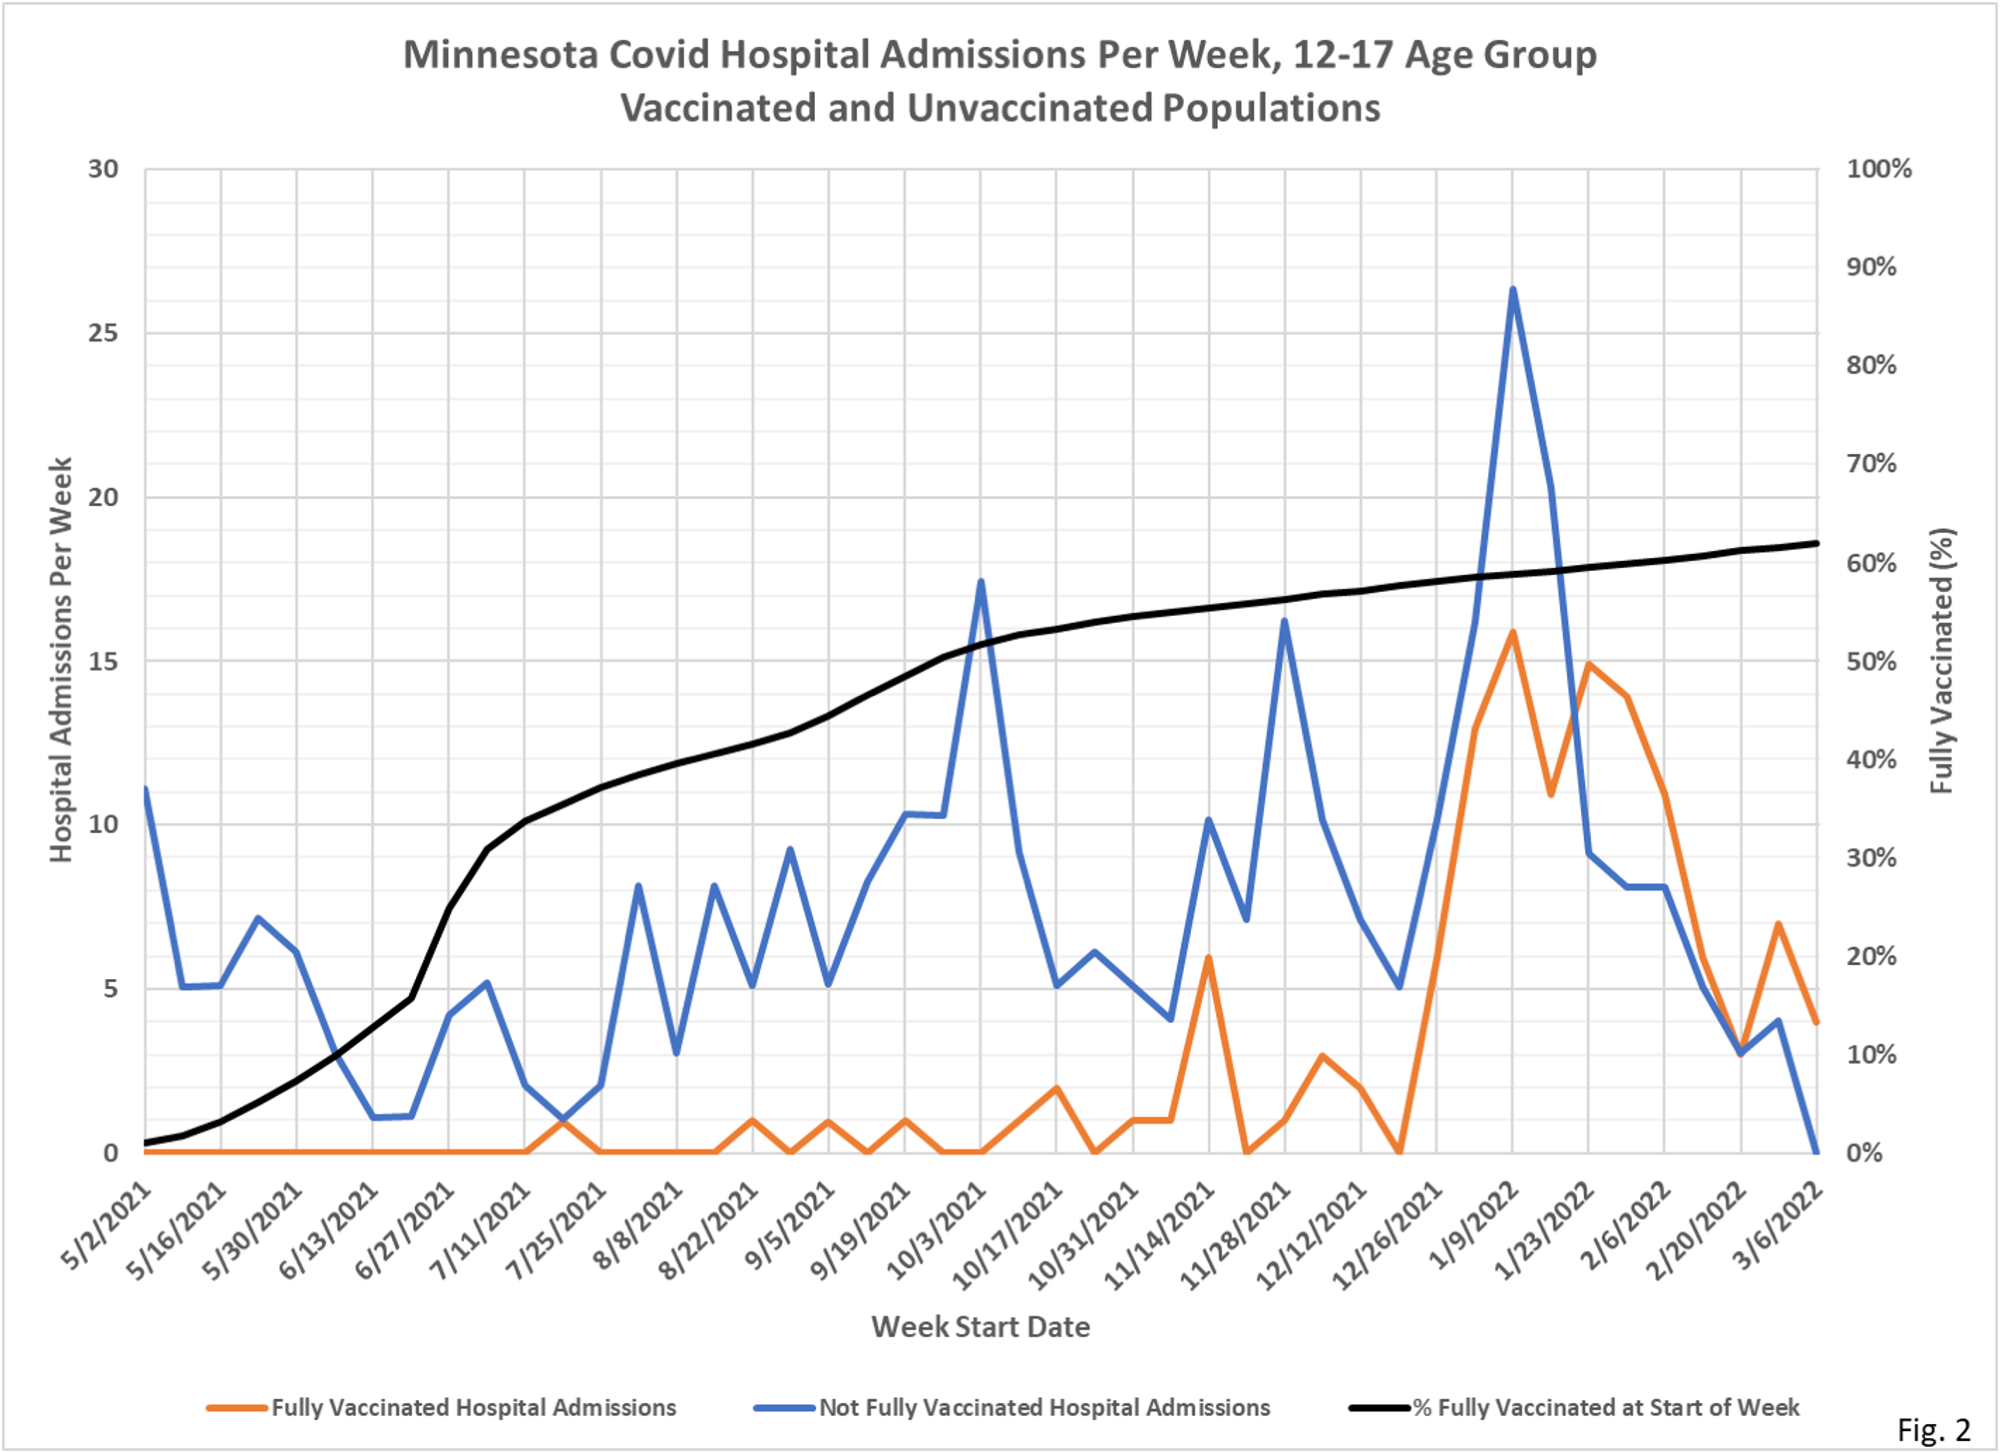
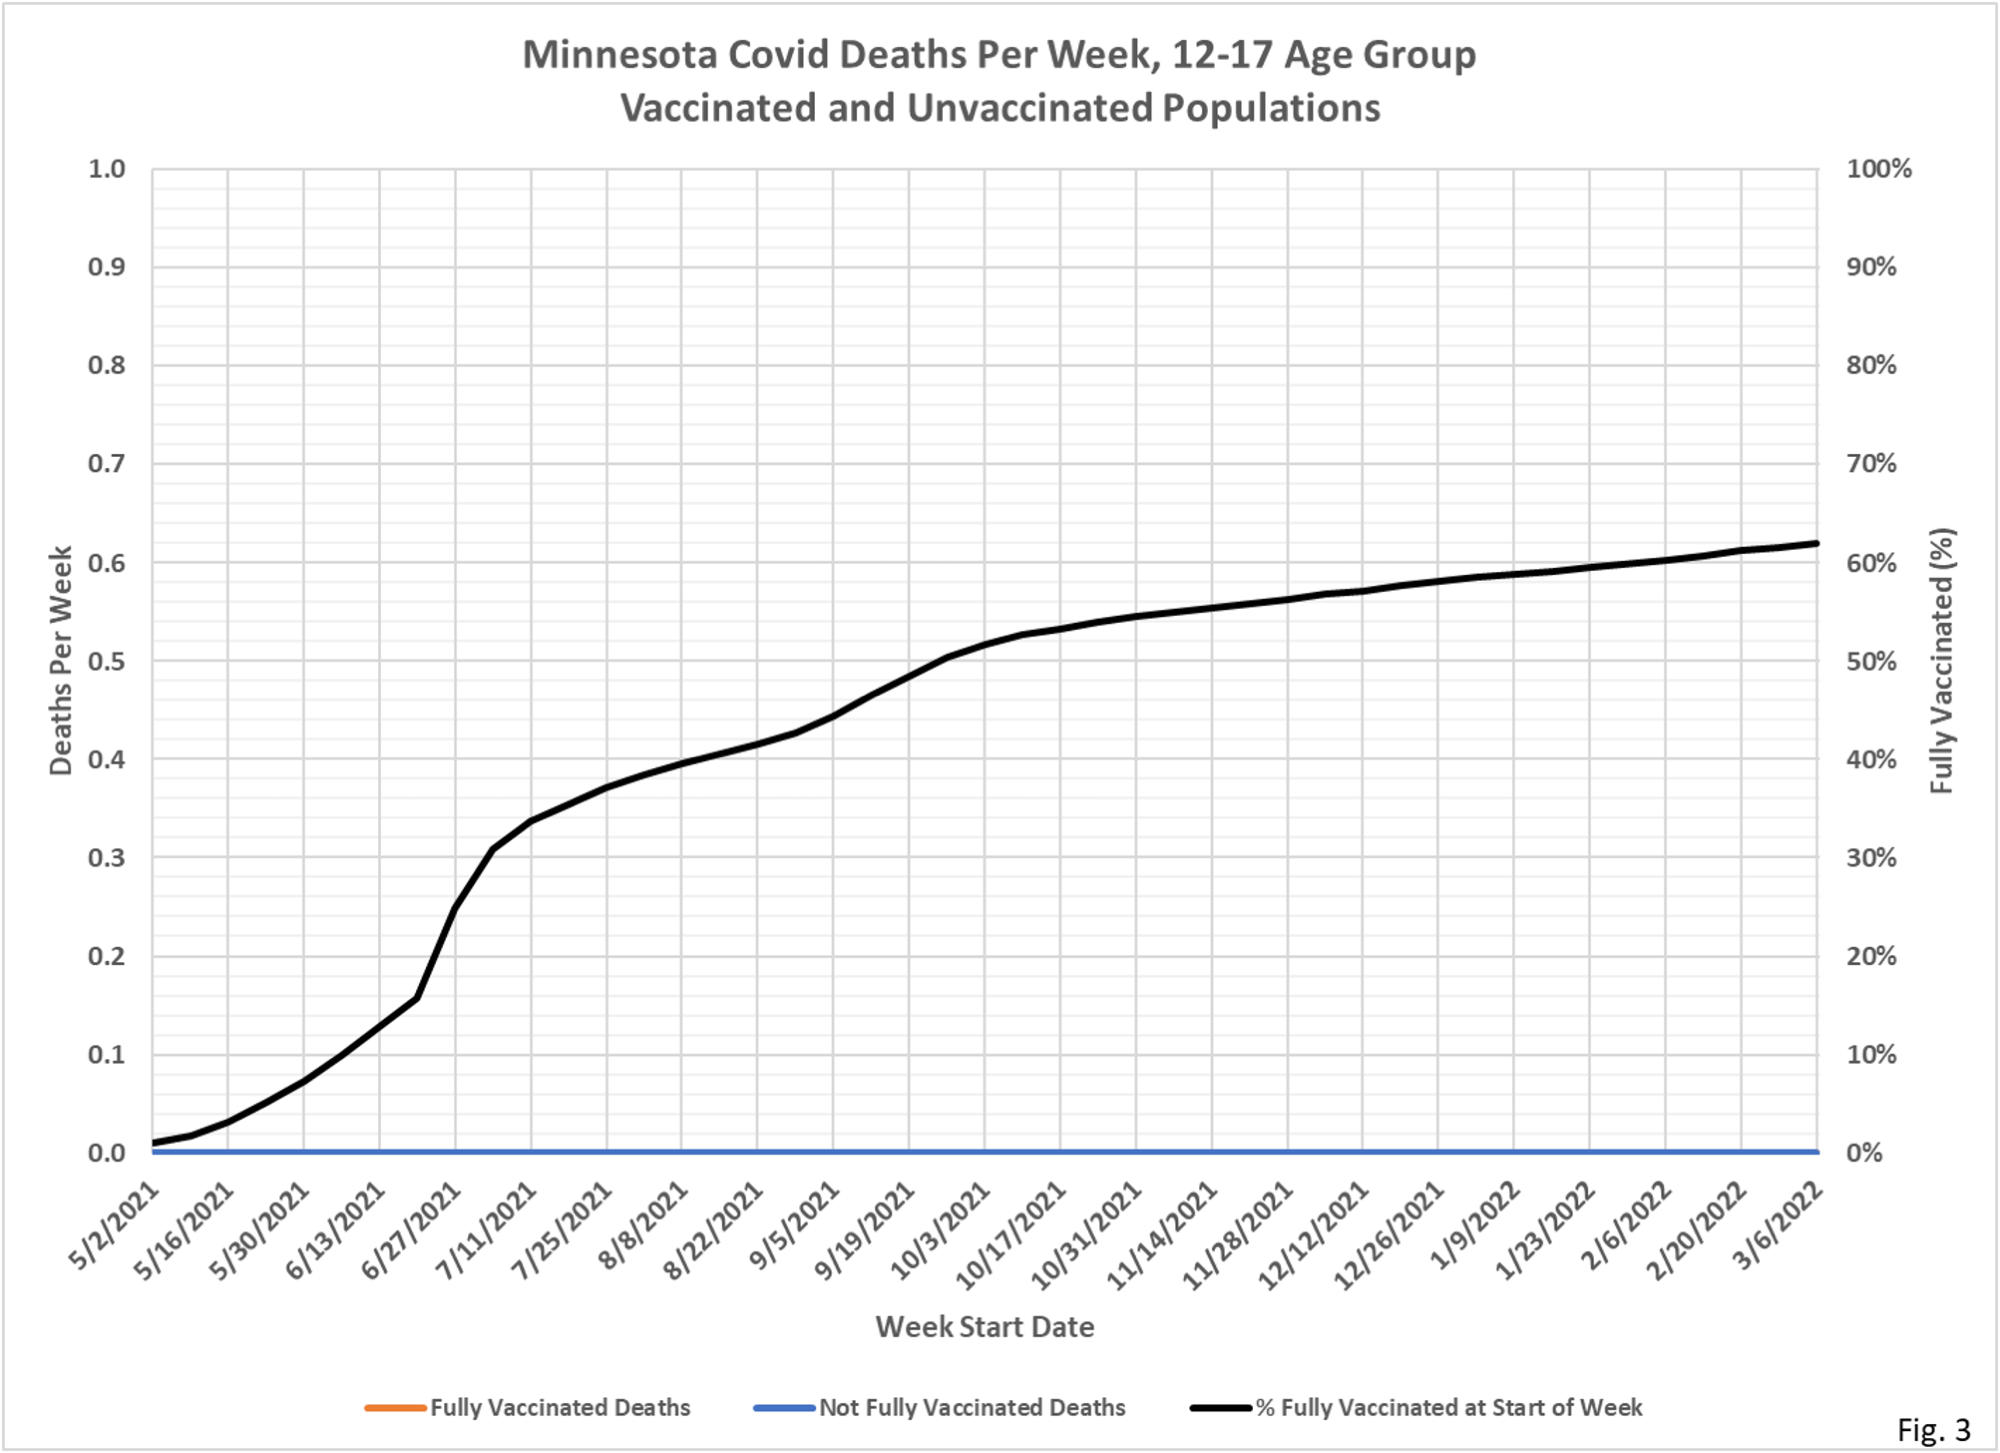
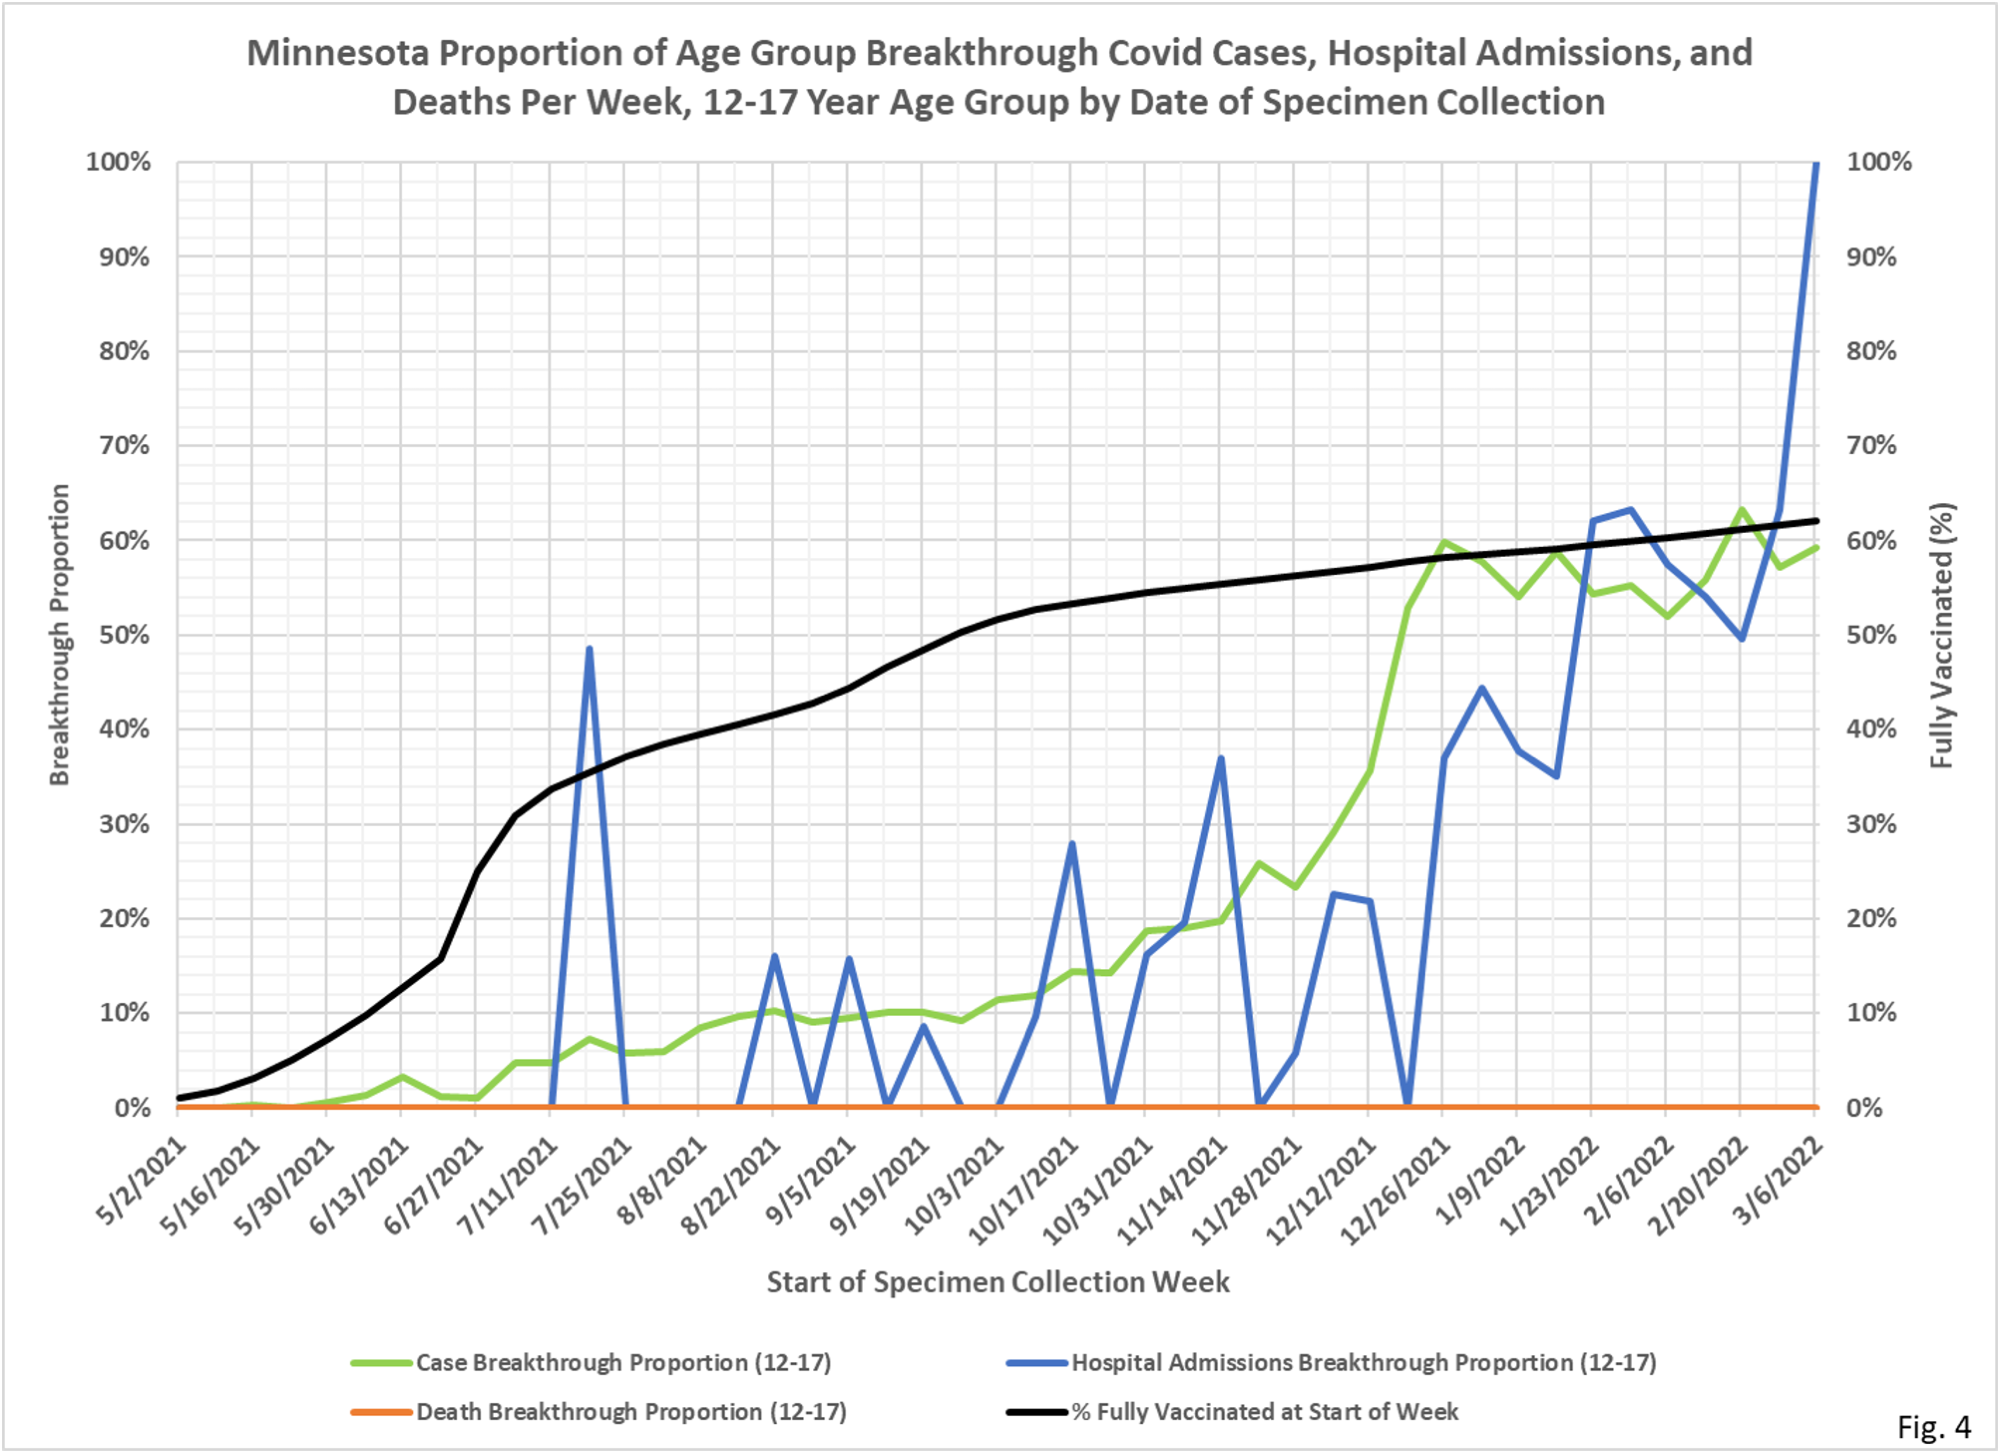
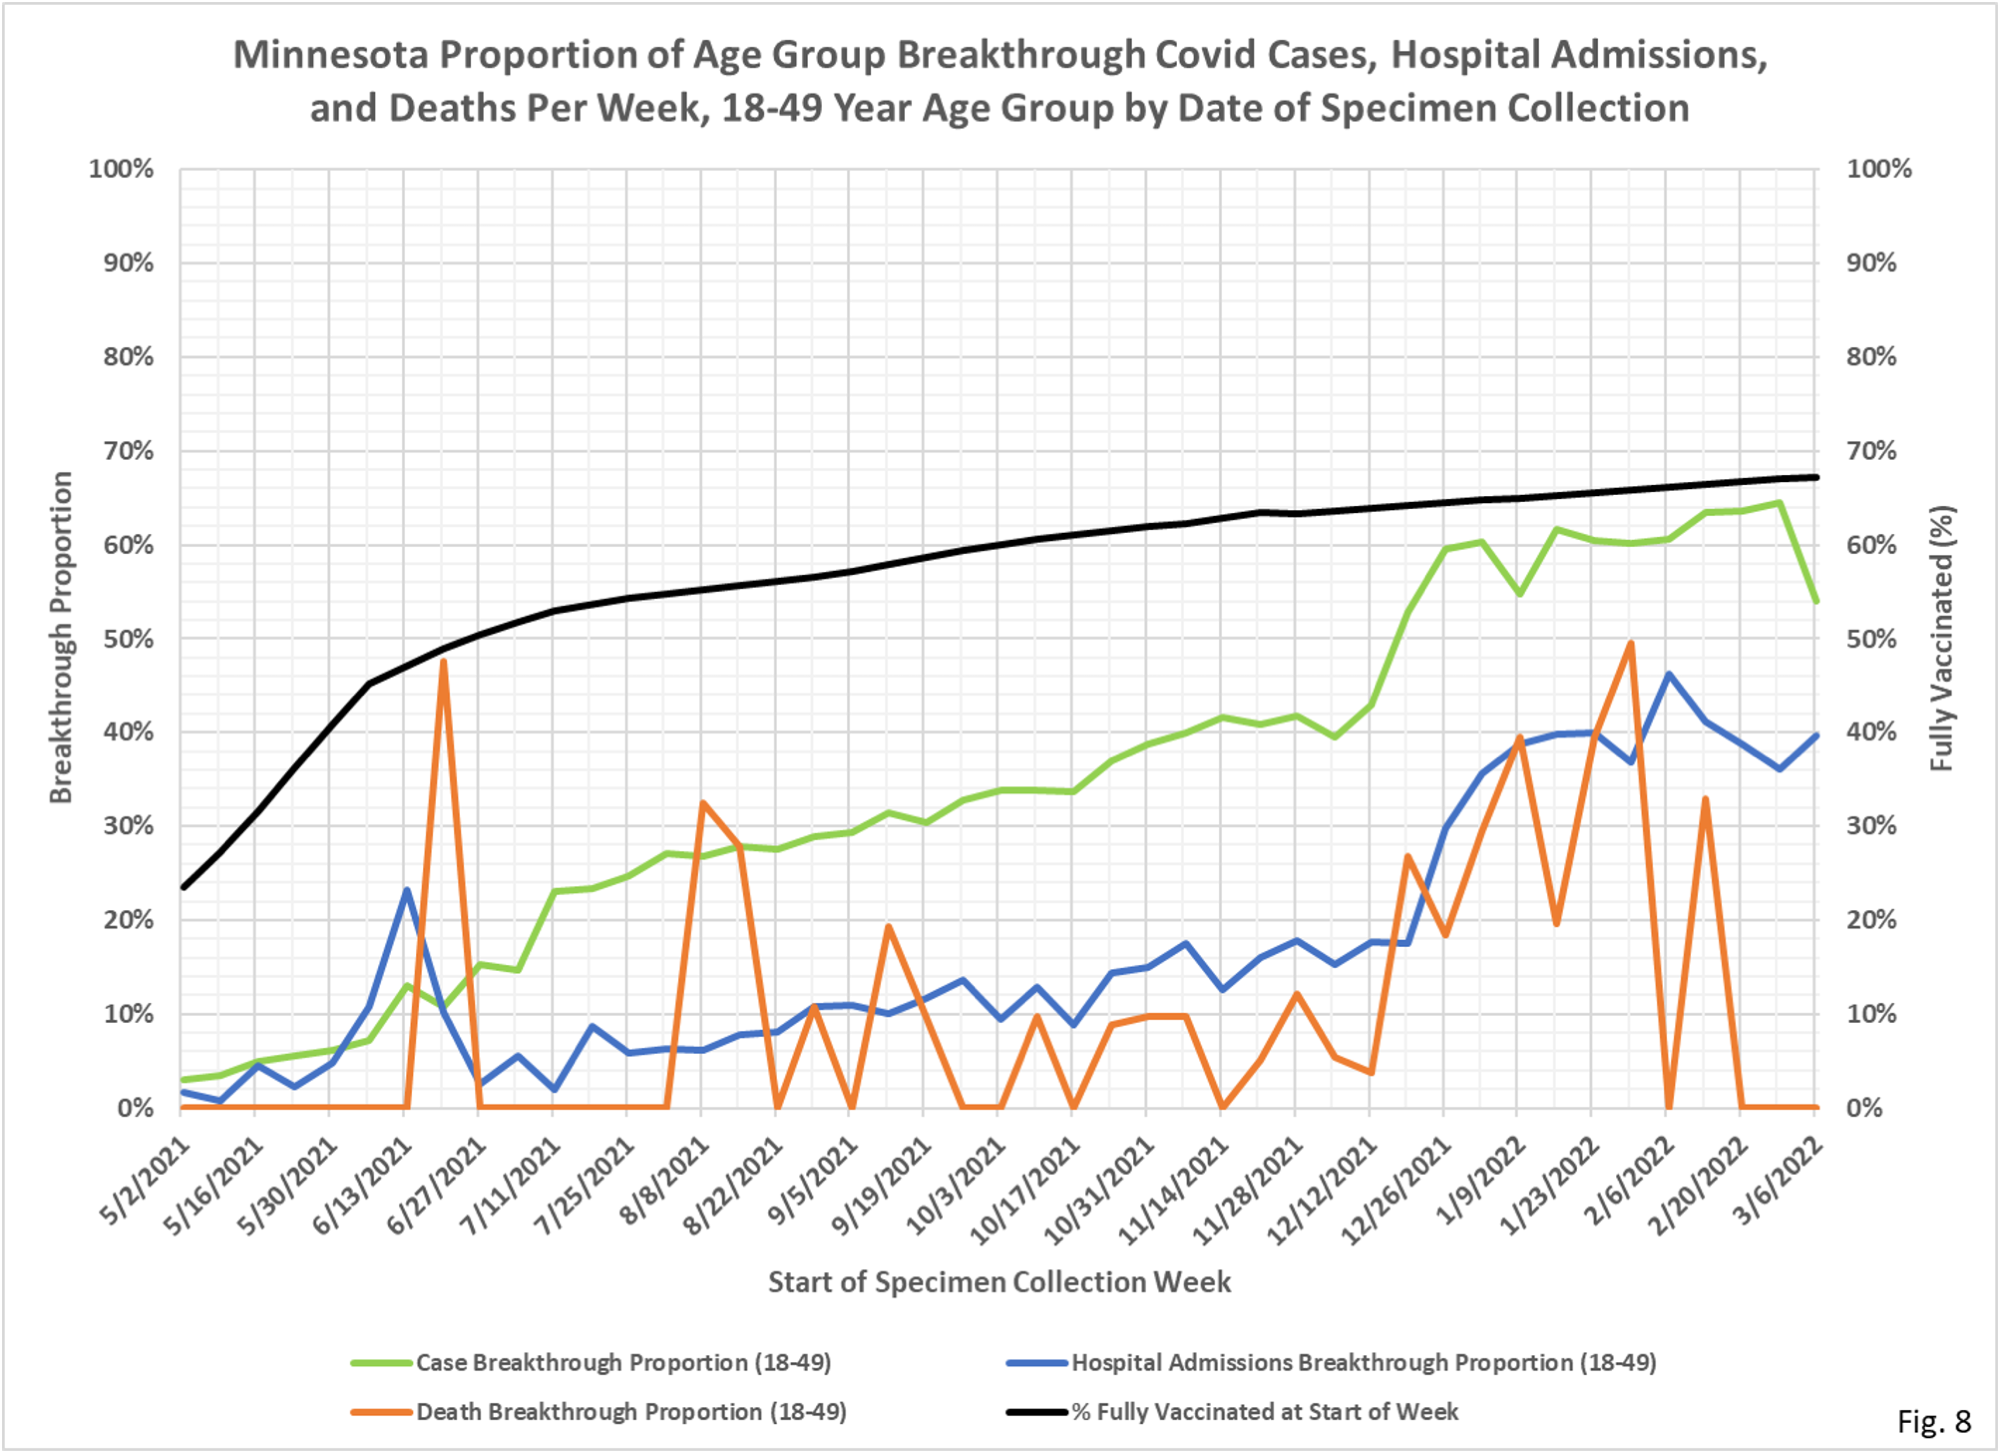
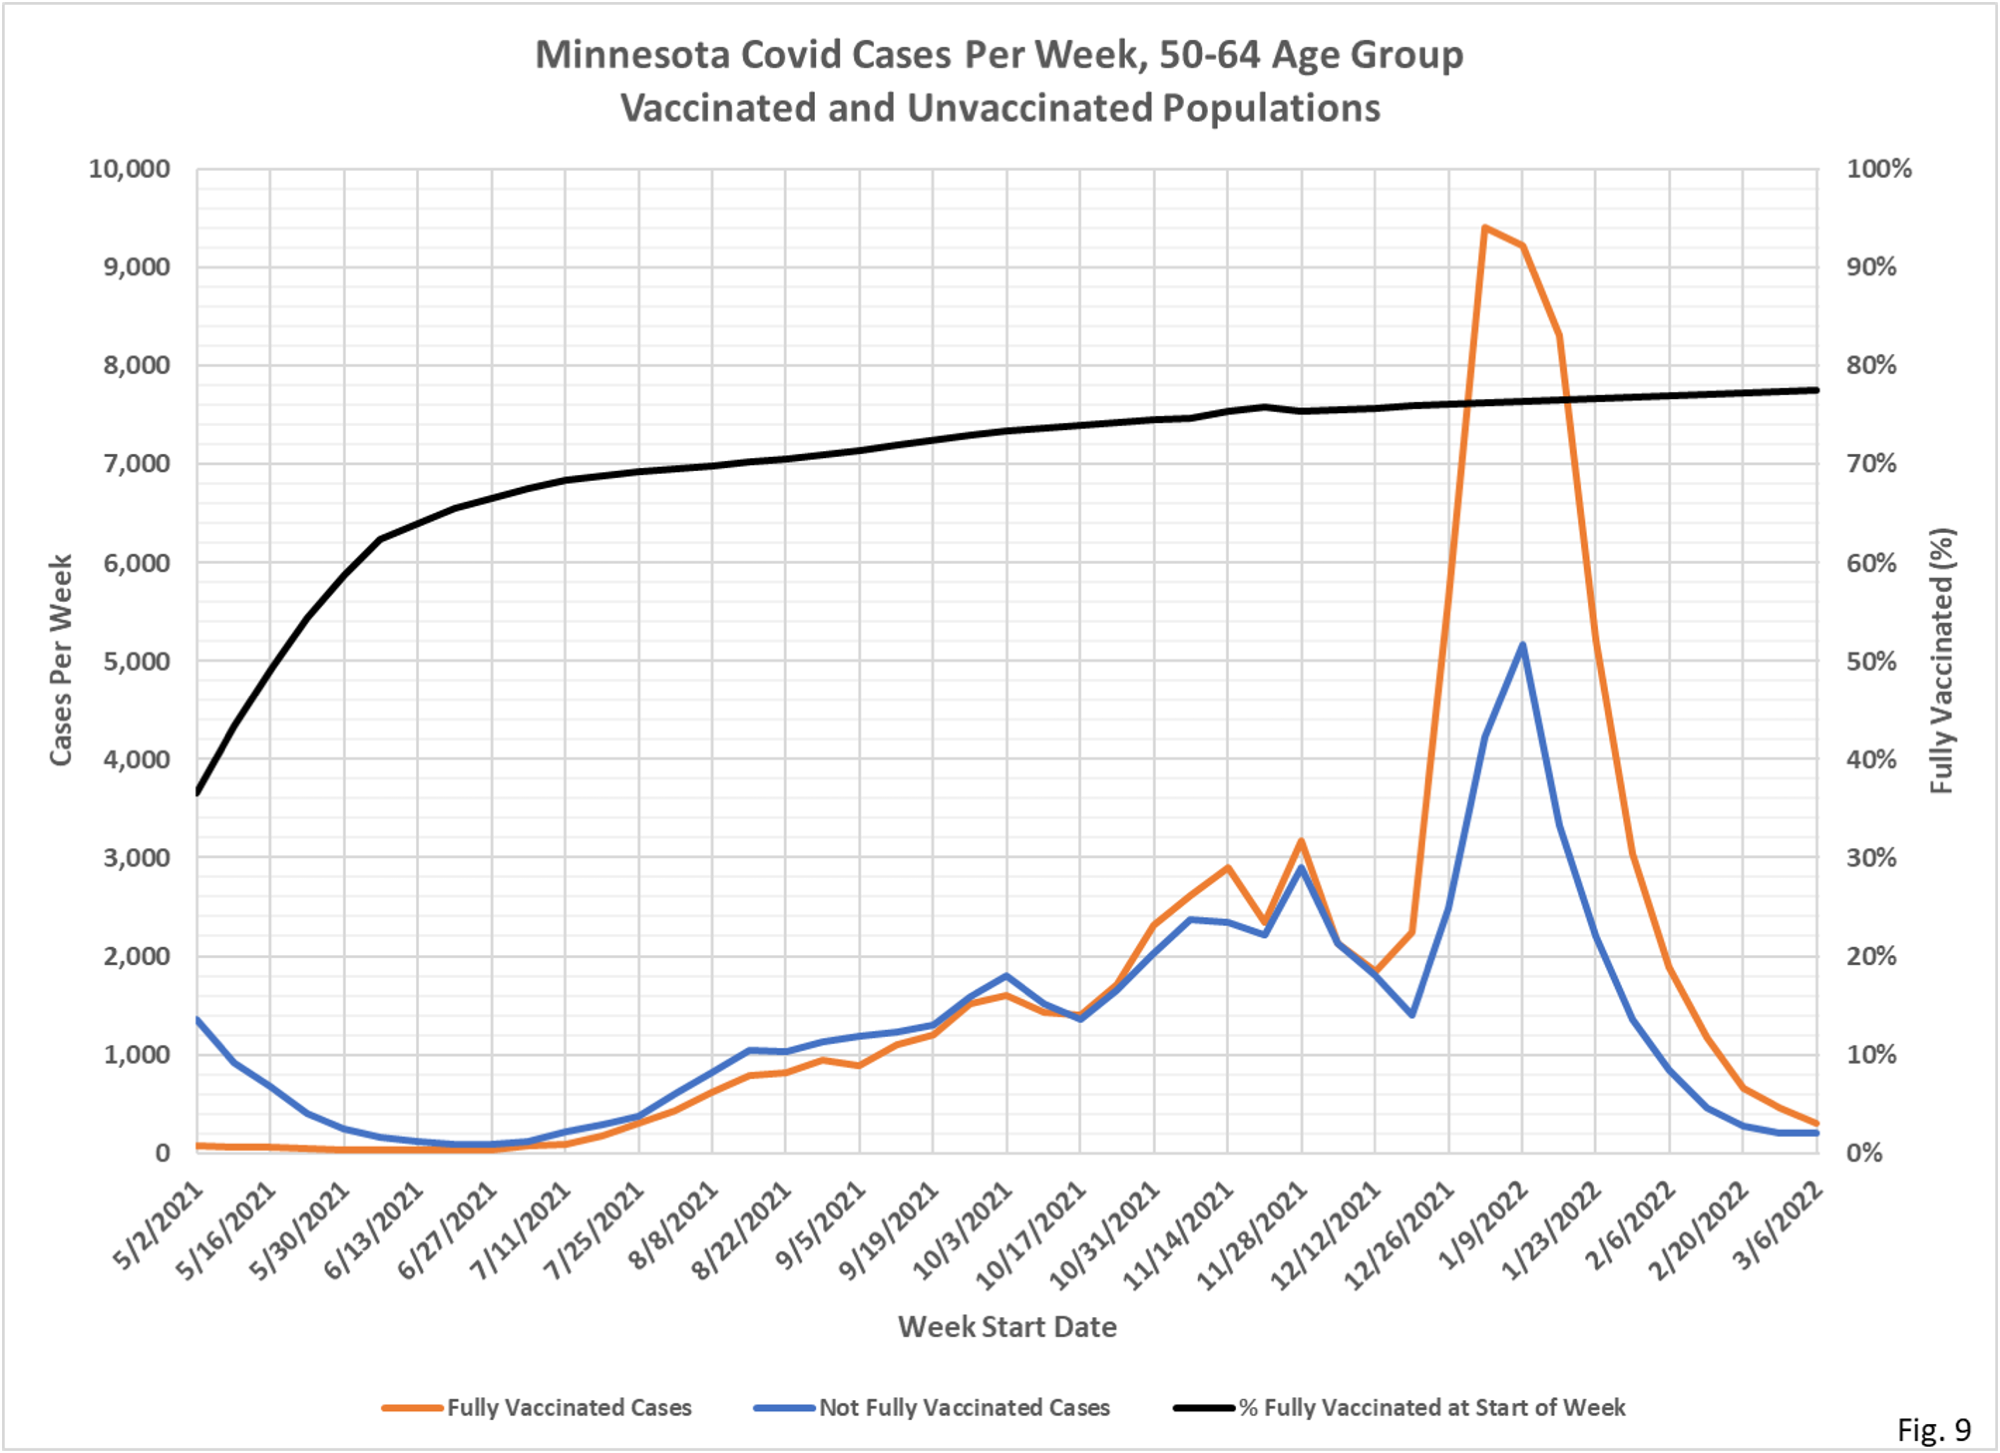
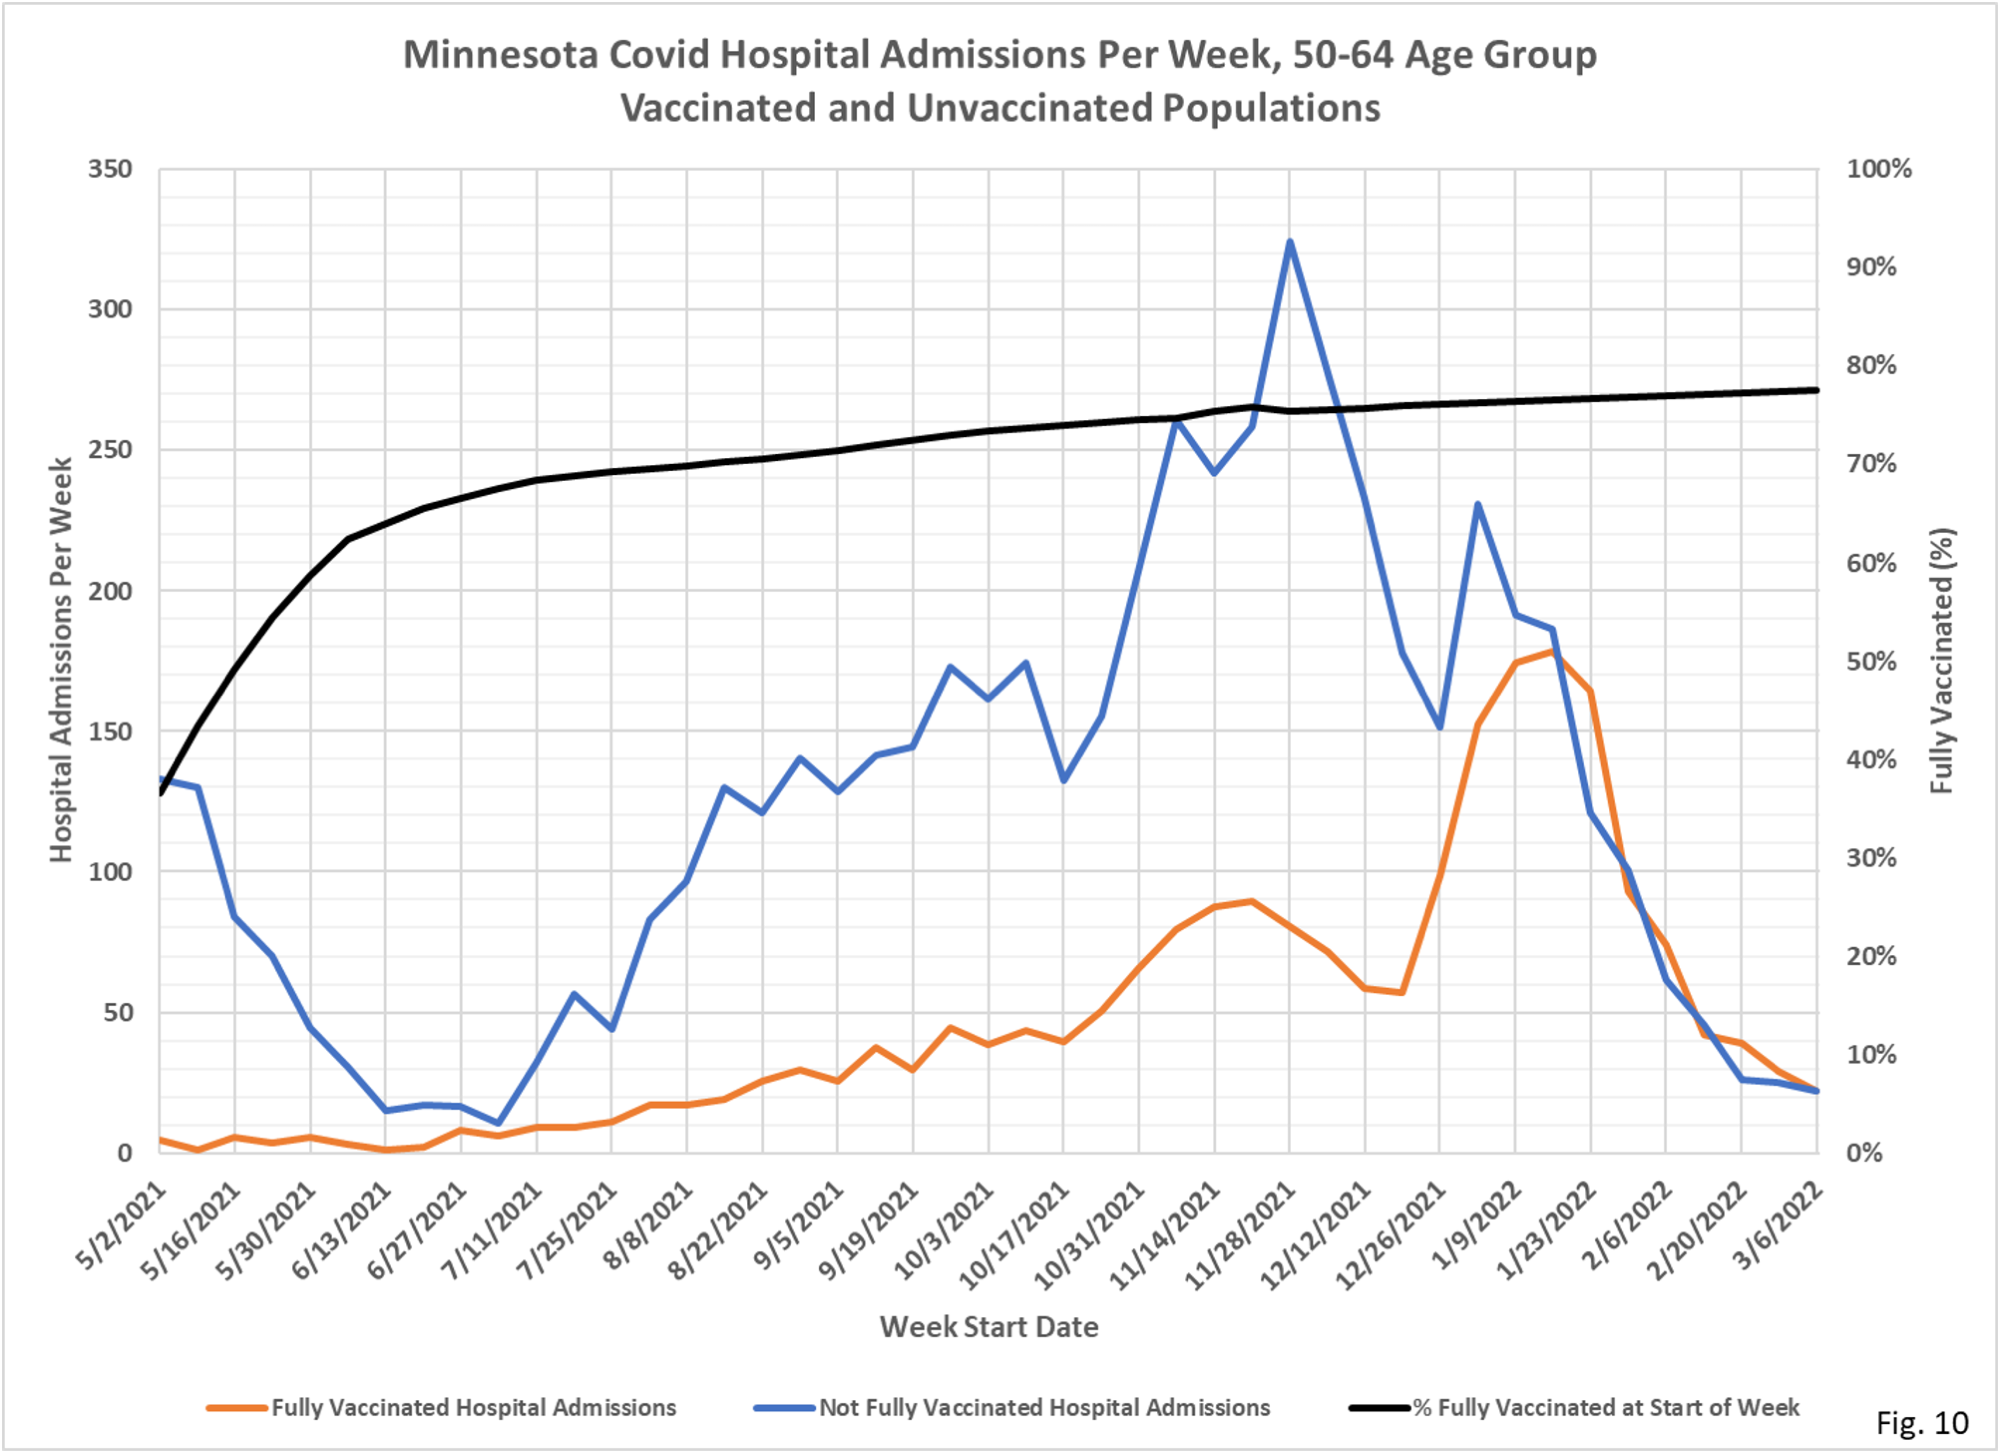
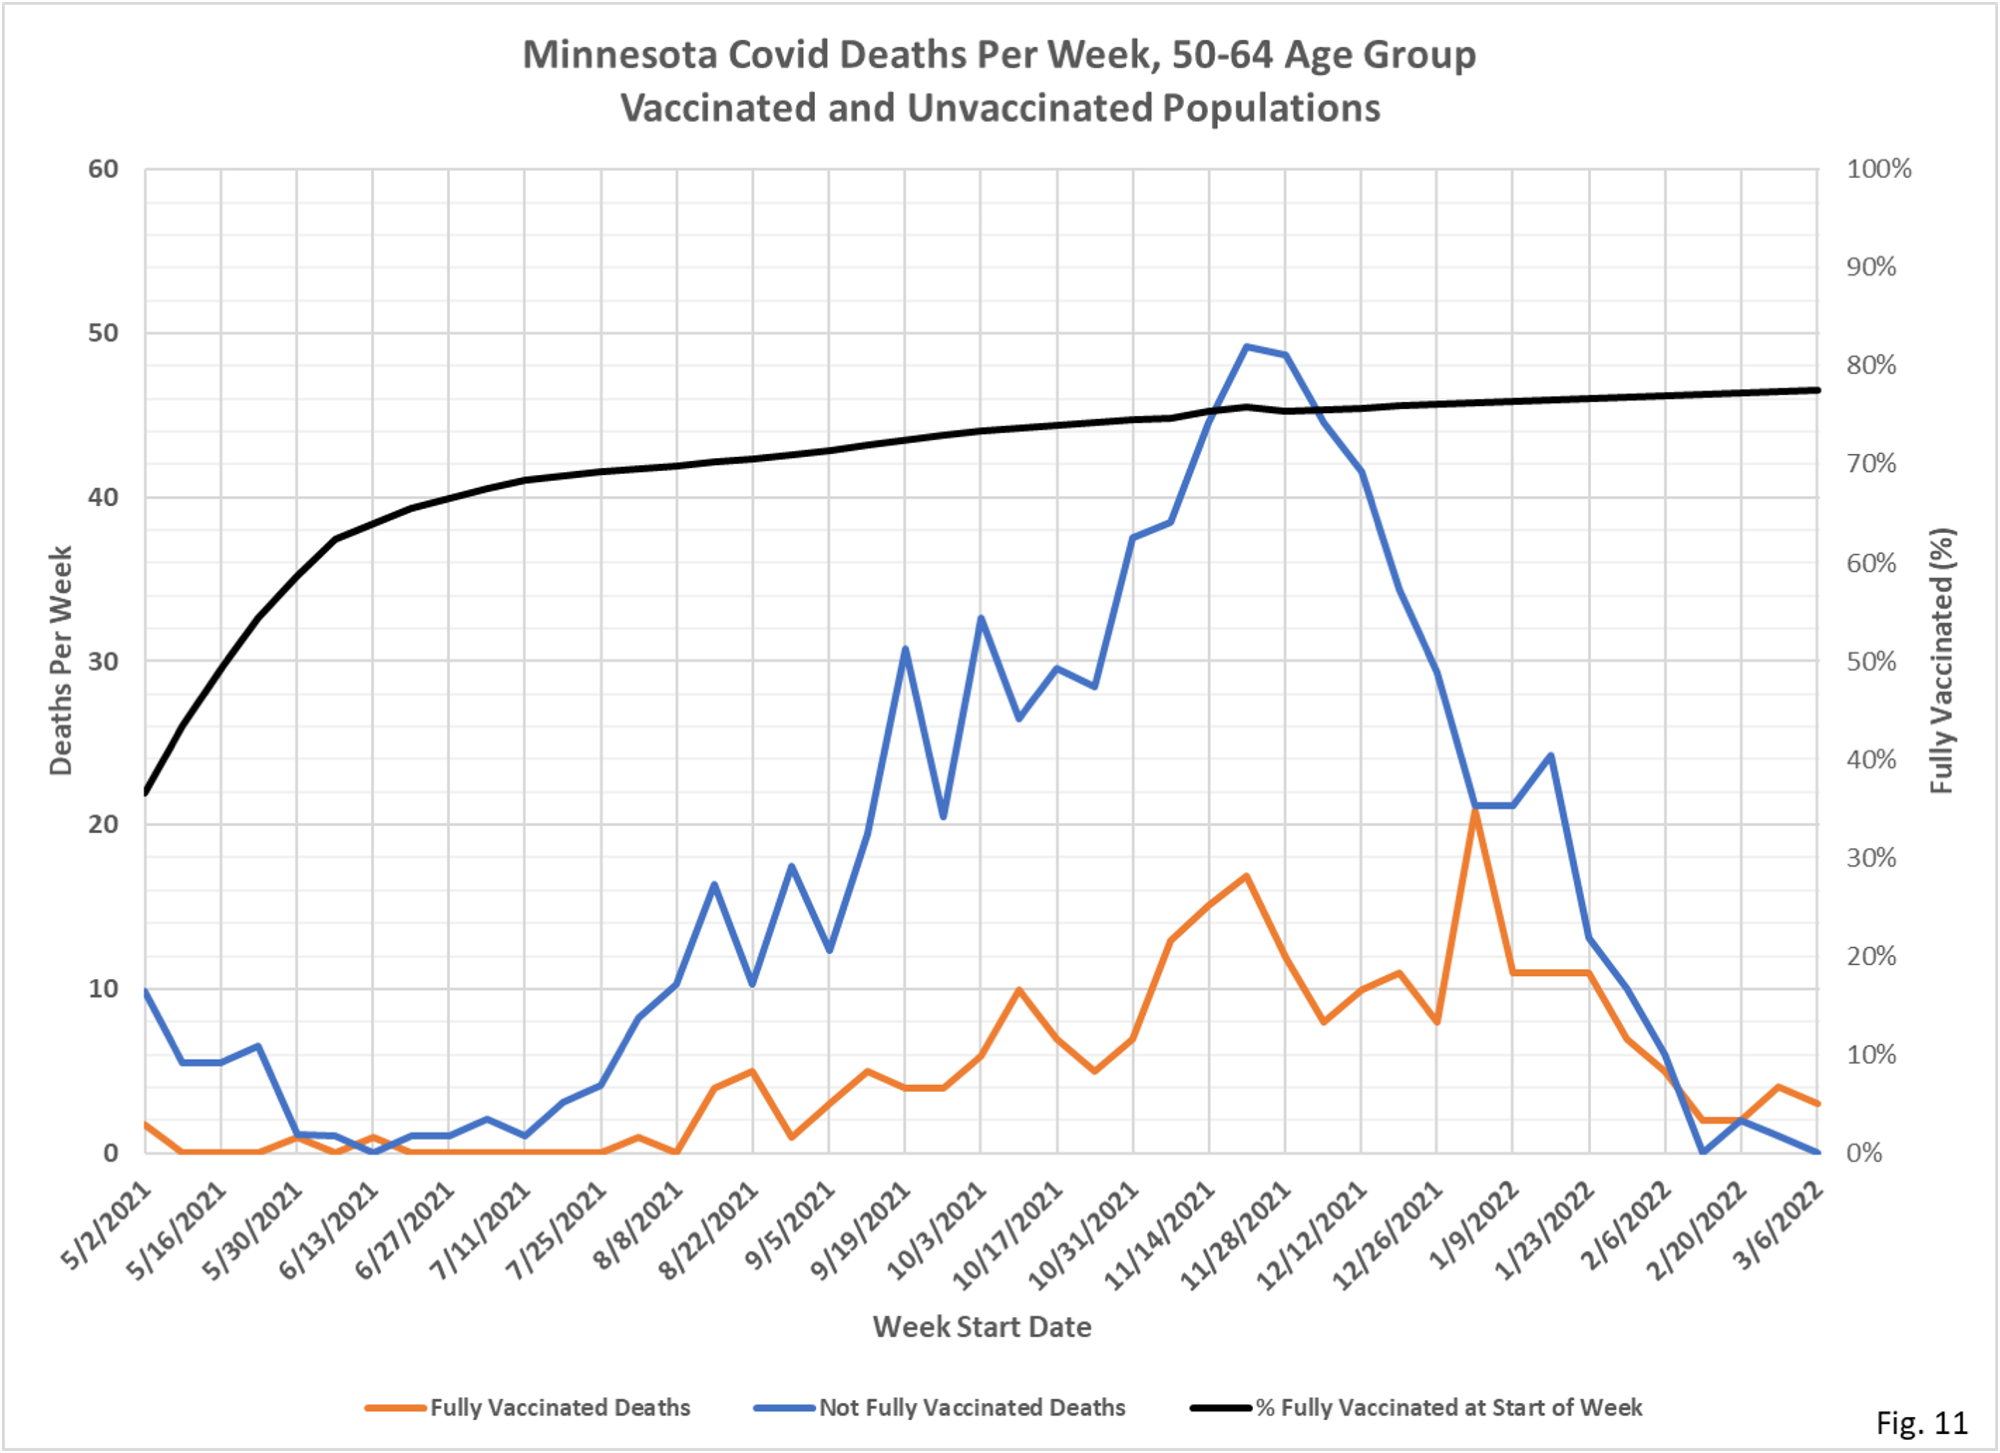
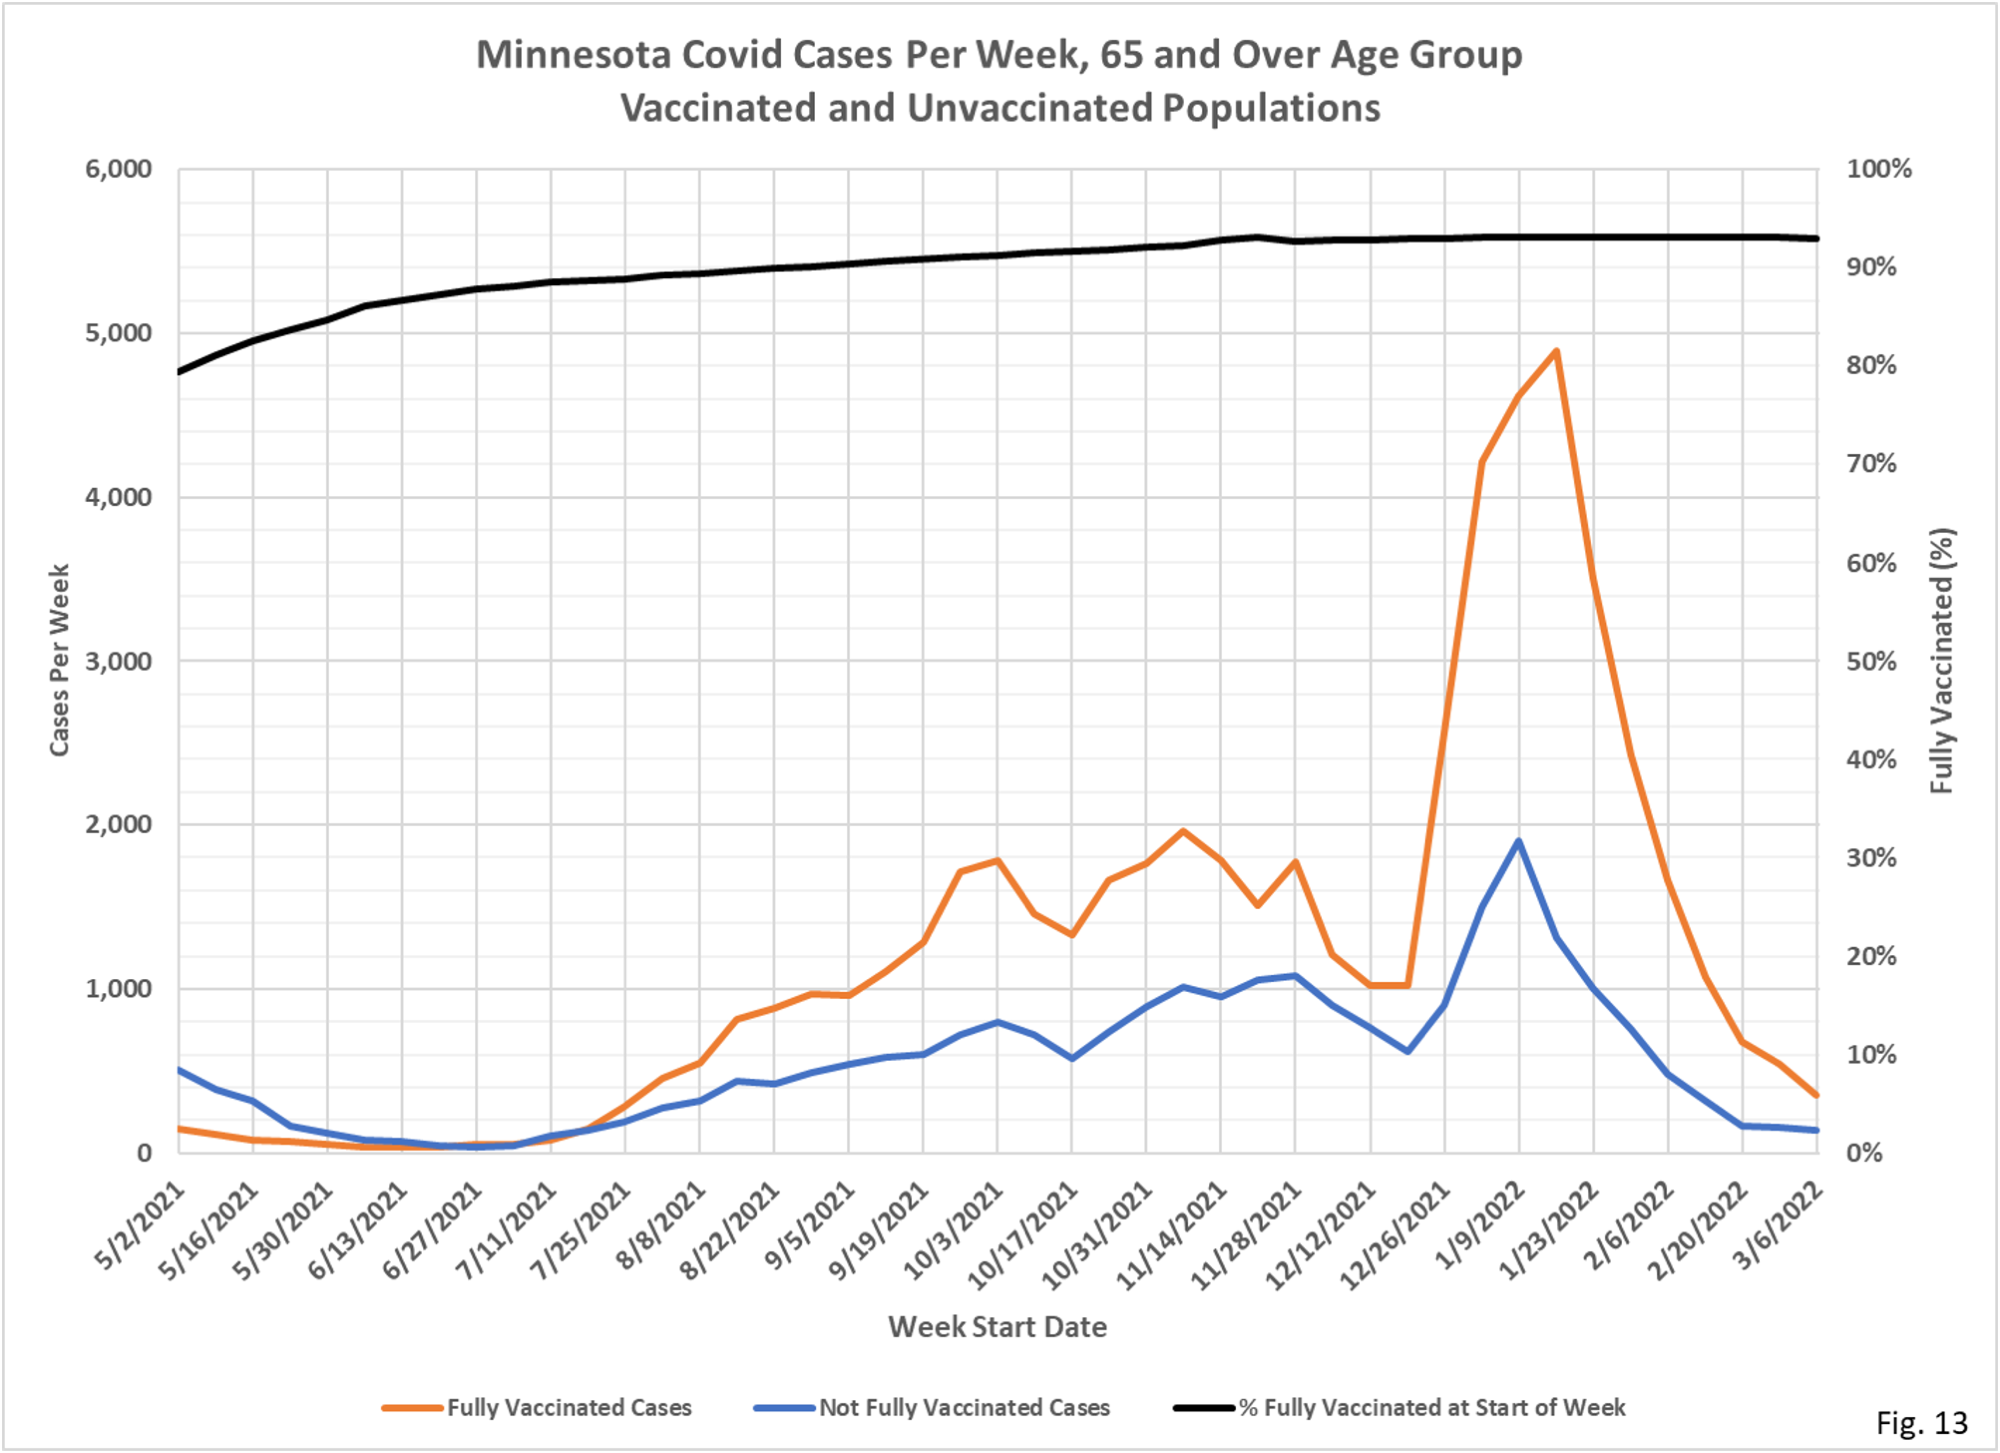
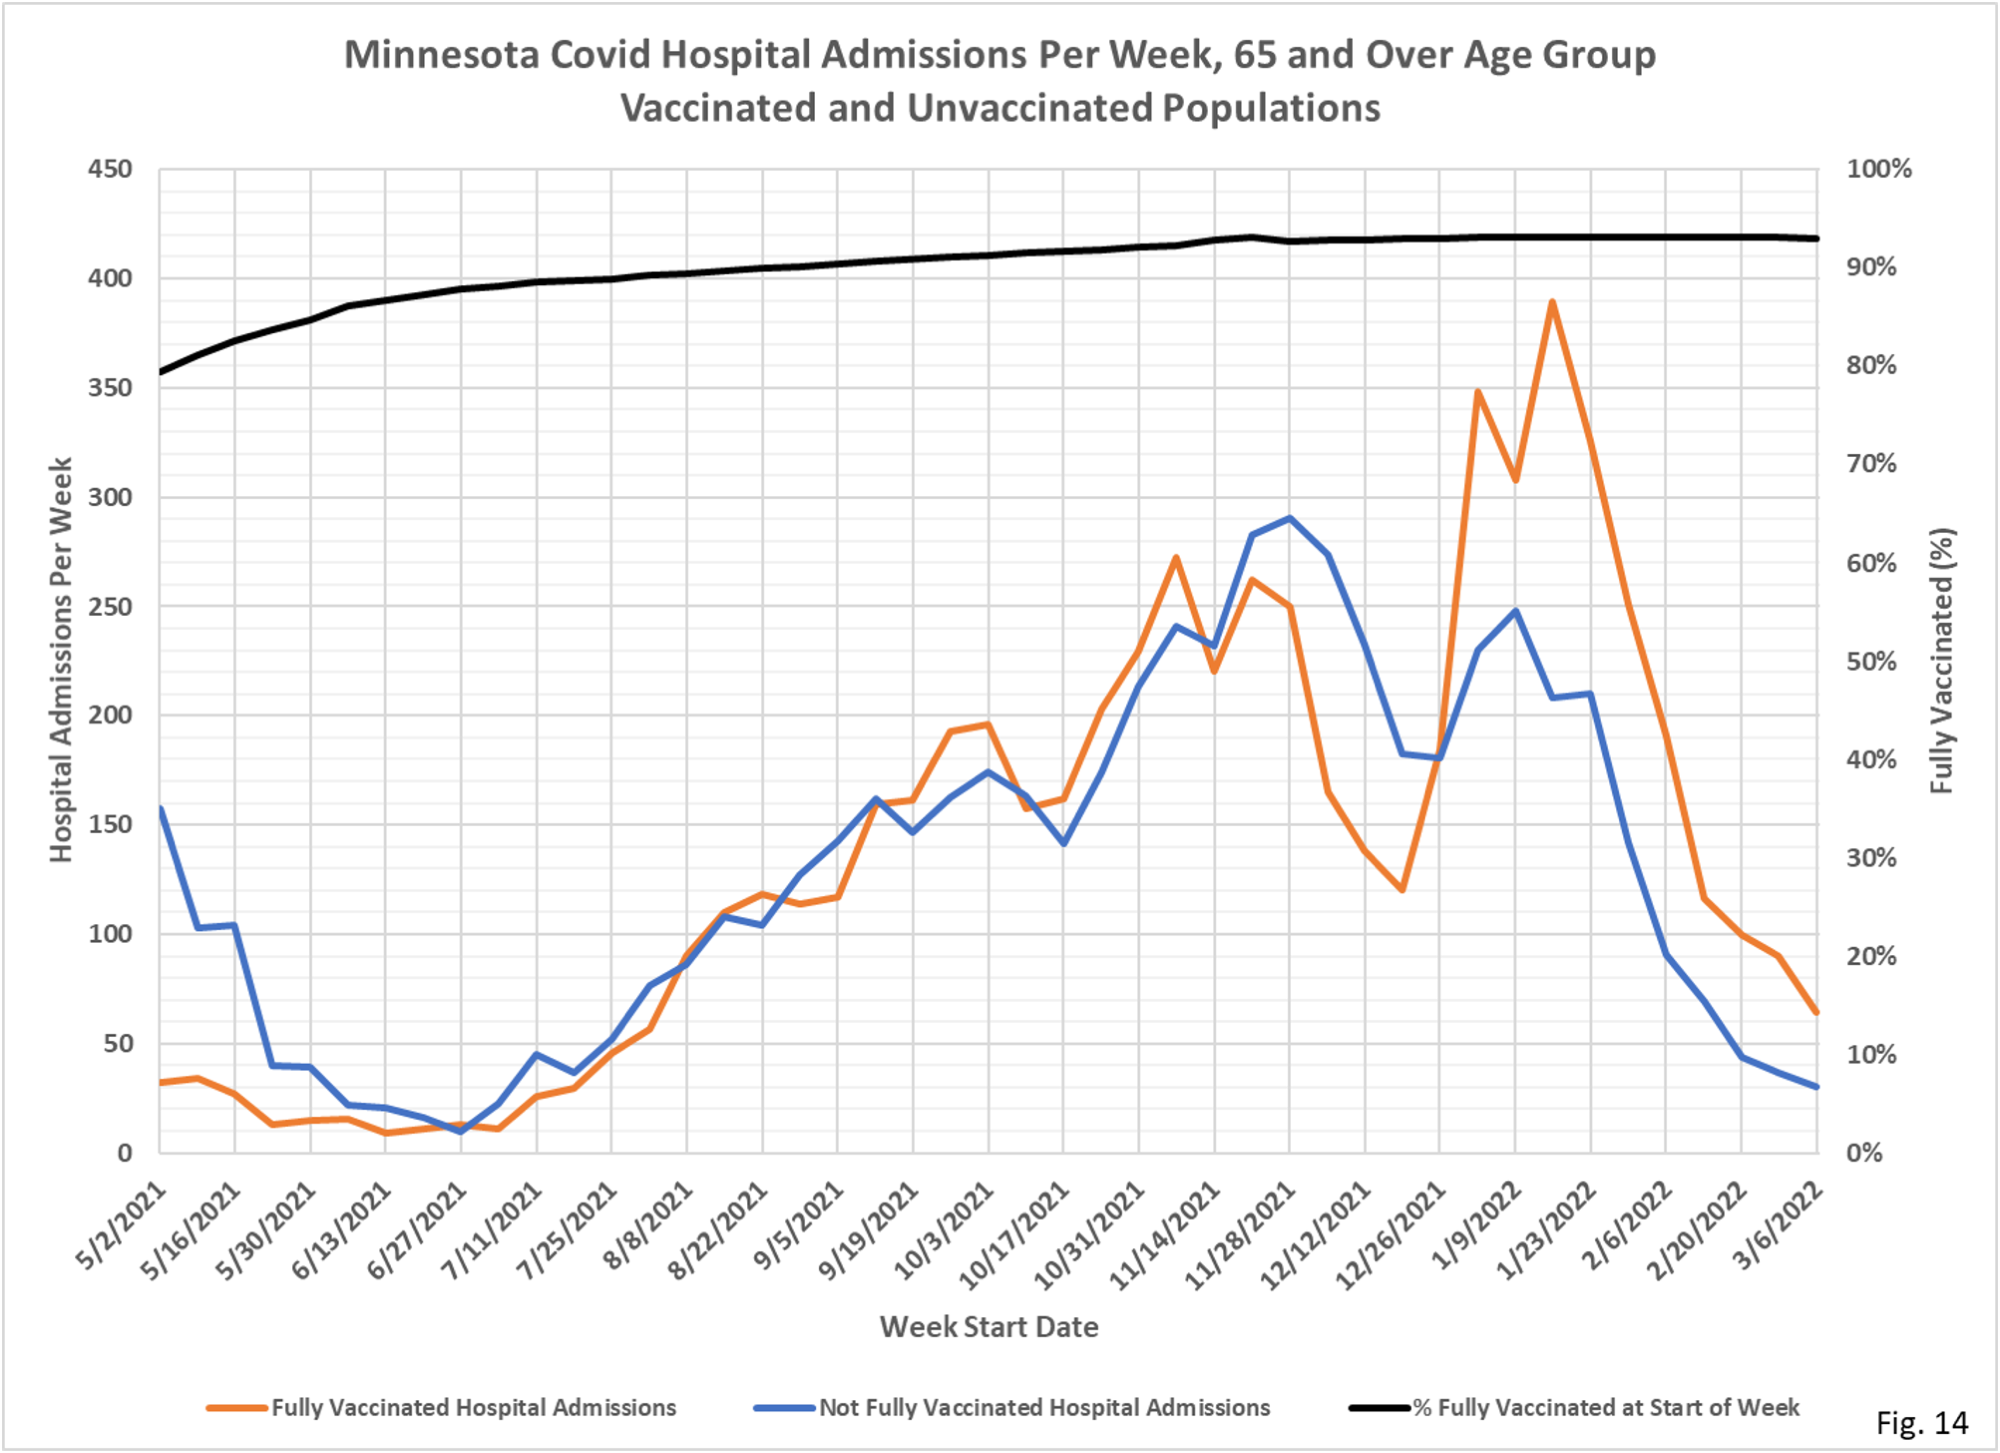
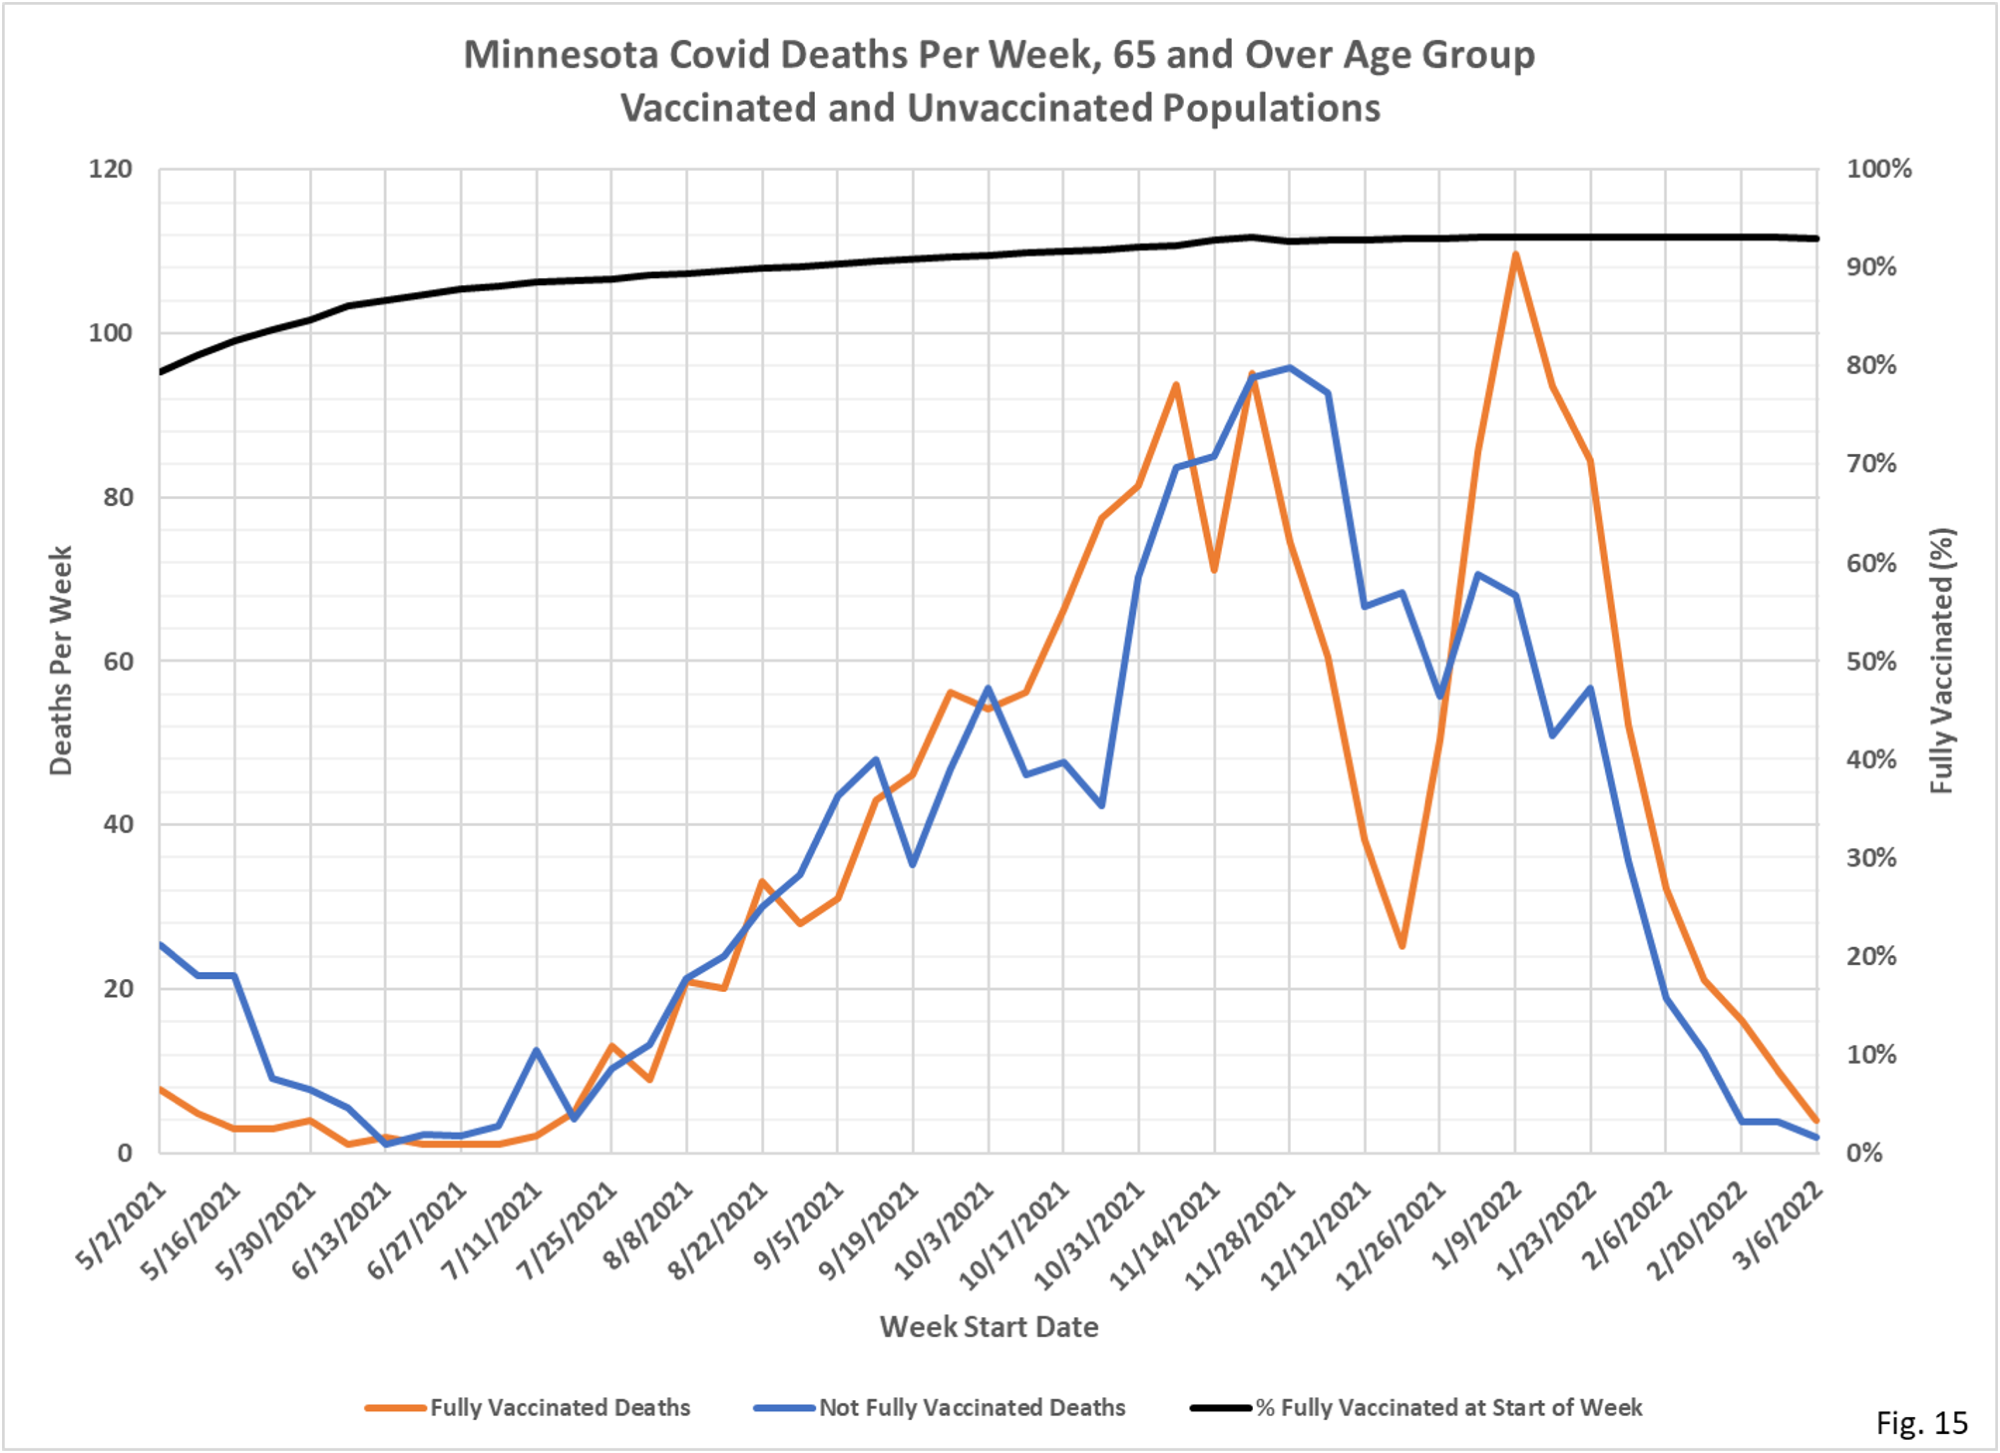
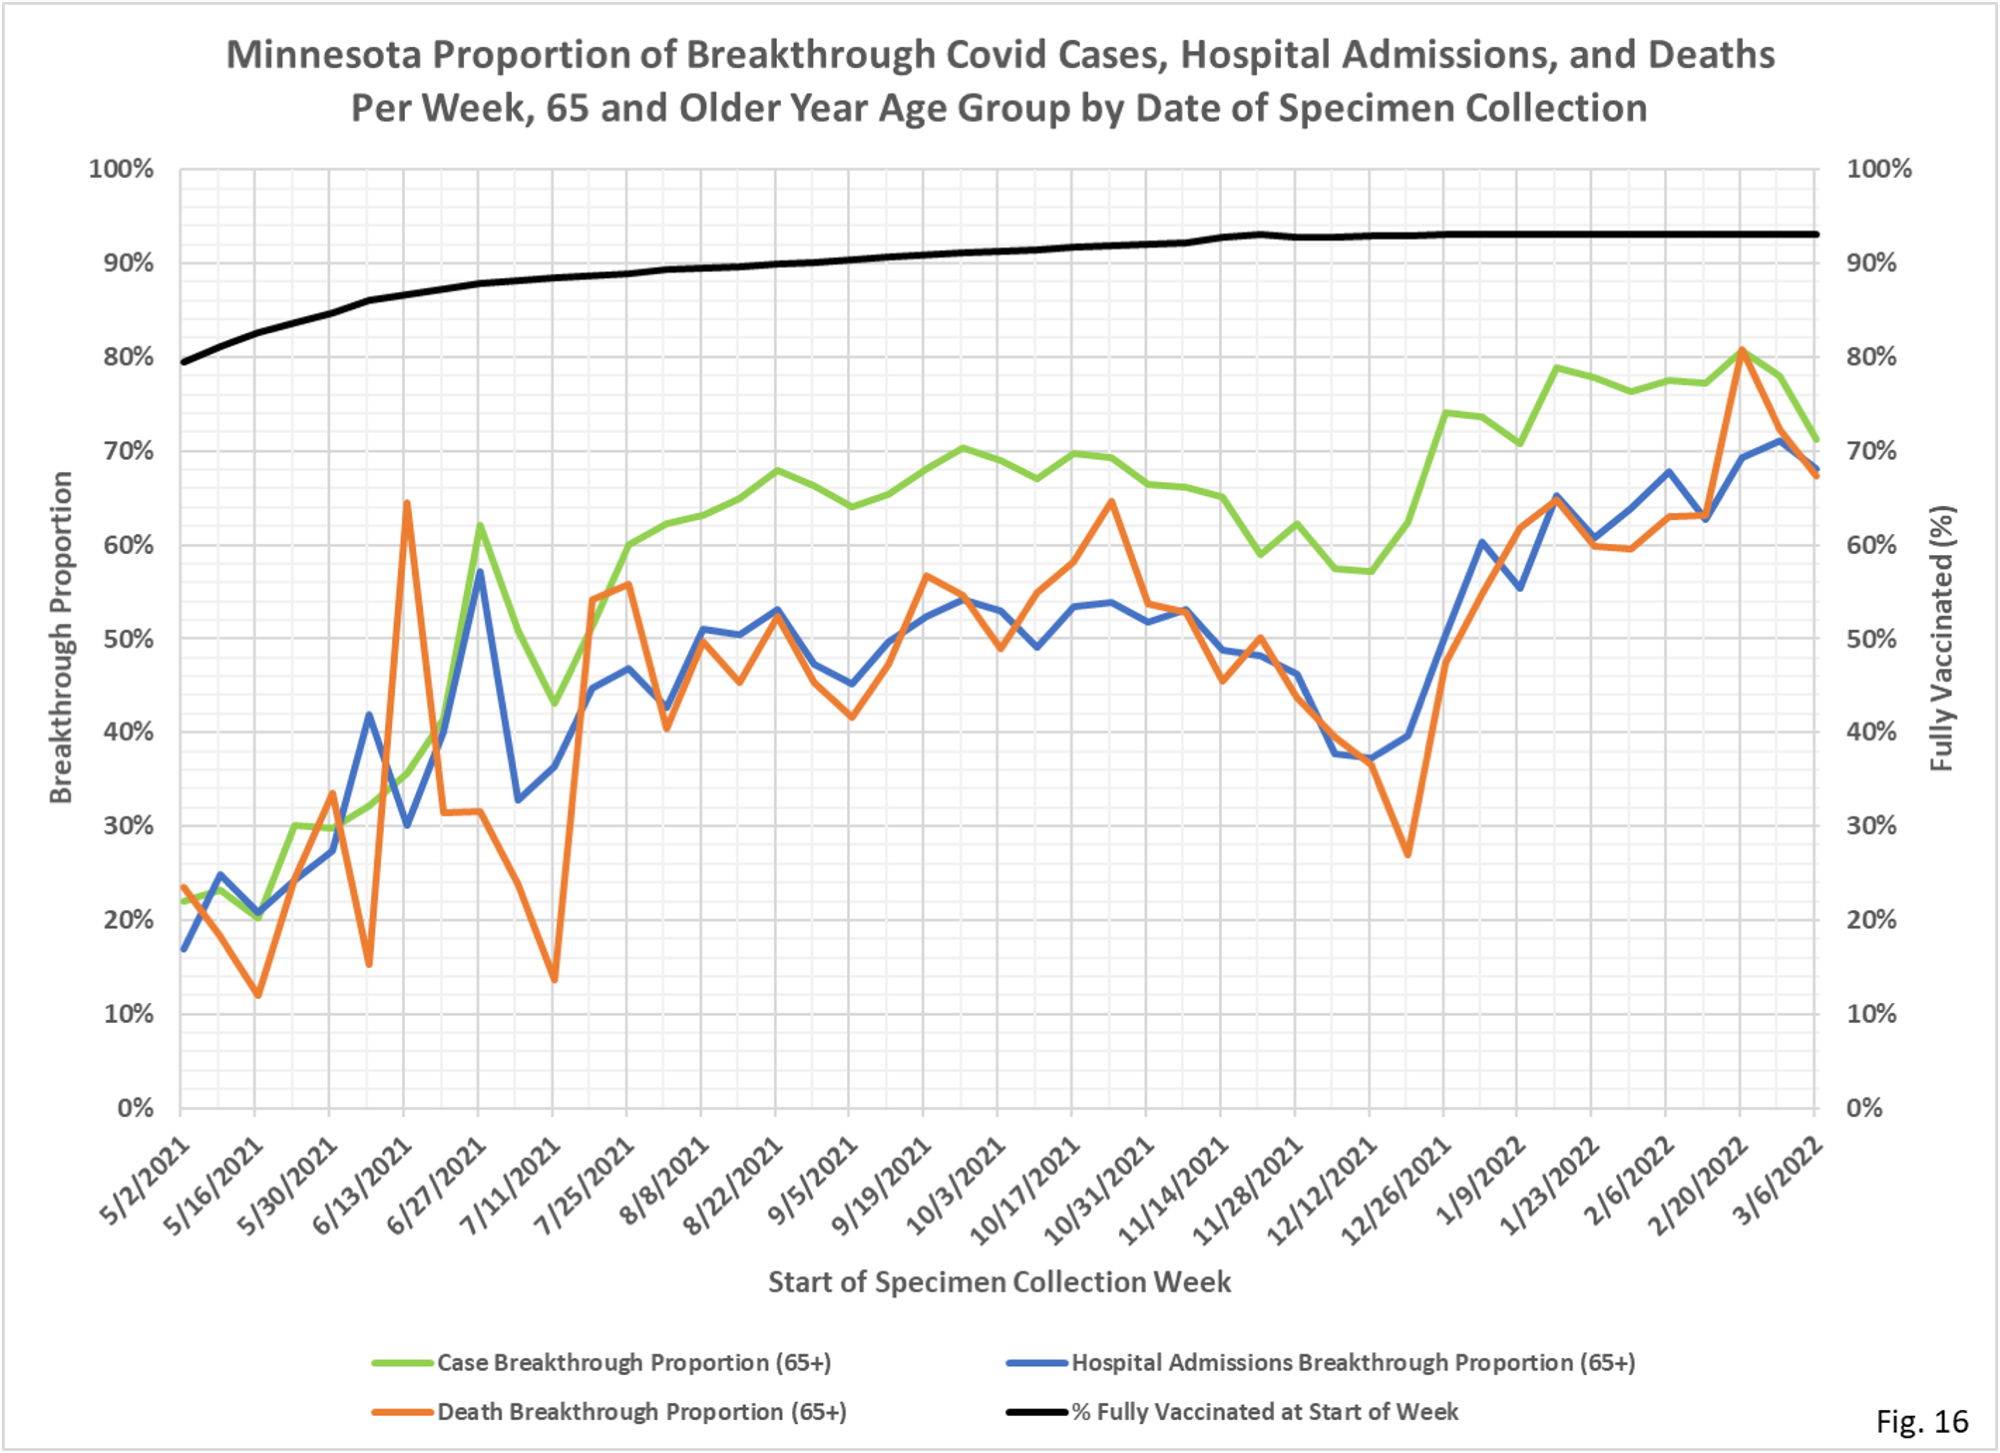
- In the charts that follow there are 4 slides for each age group; cases, hospital admissions, and deaths for the vaccinated and unvaccinated populations each week, and a single chart showing the breakthrough proportions each week.
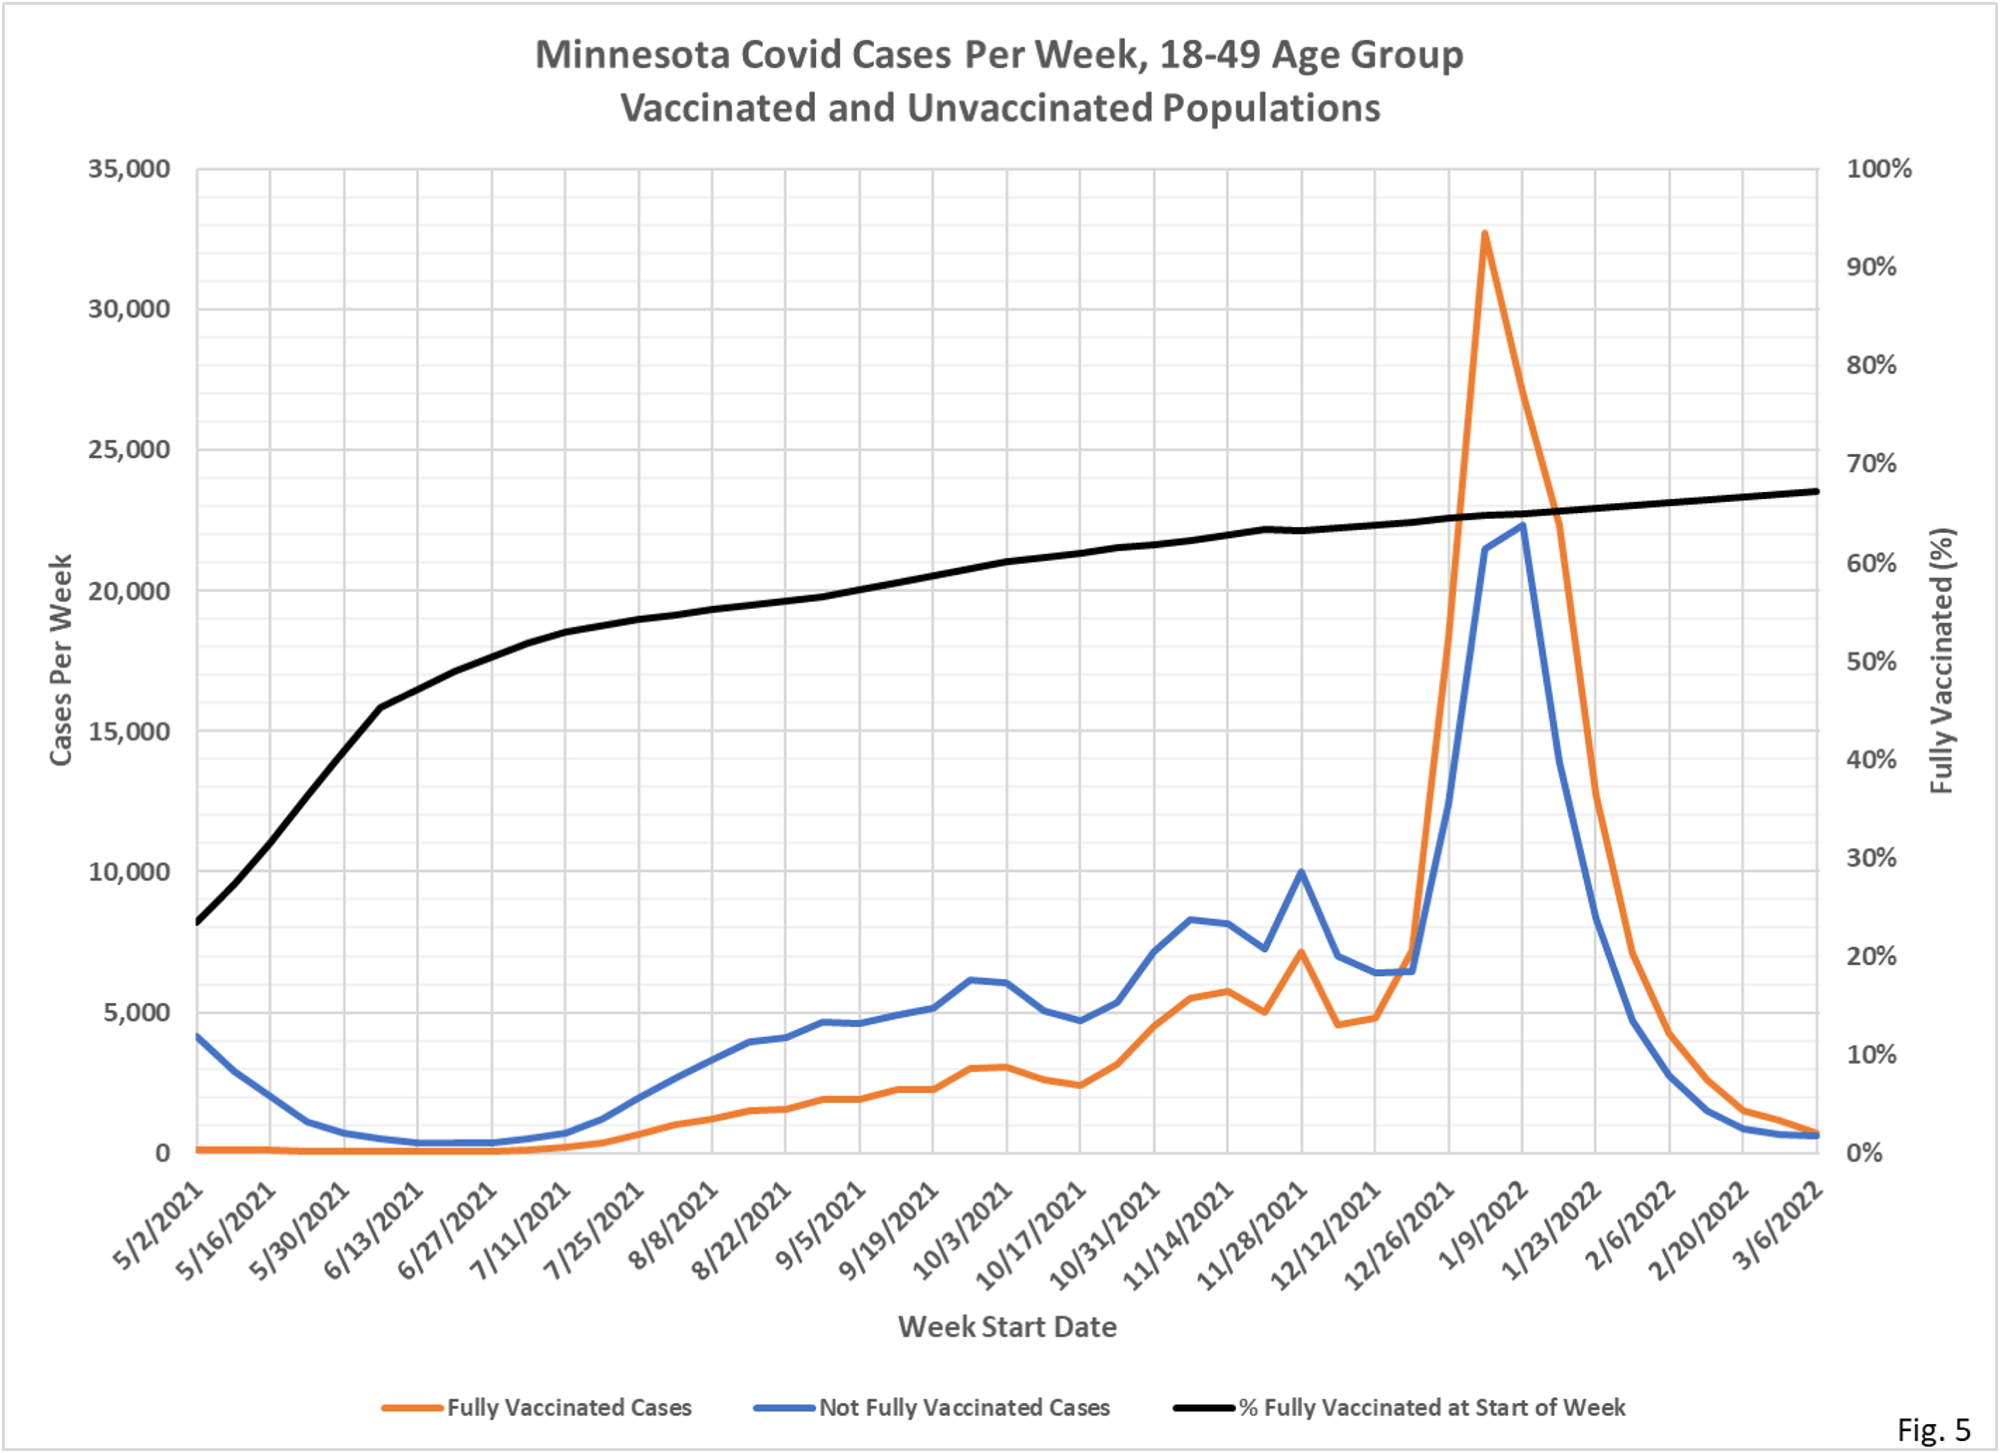
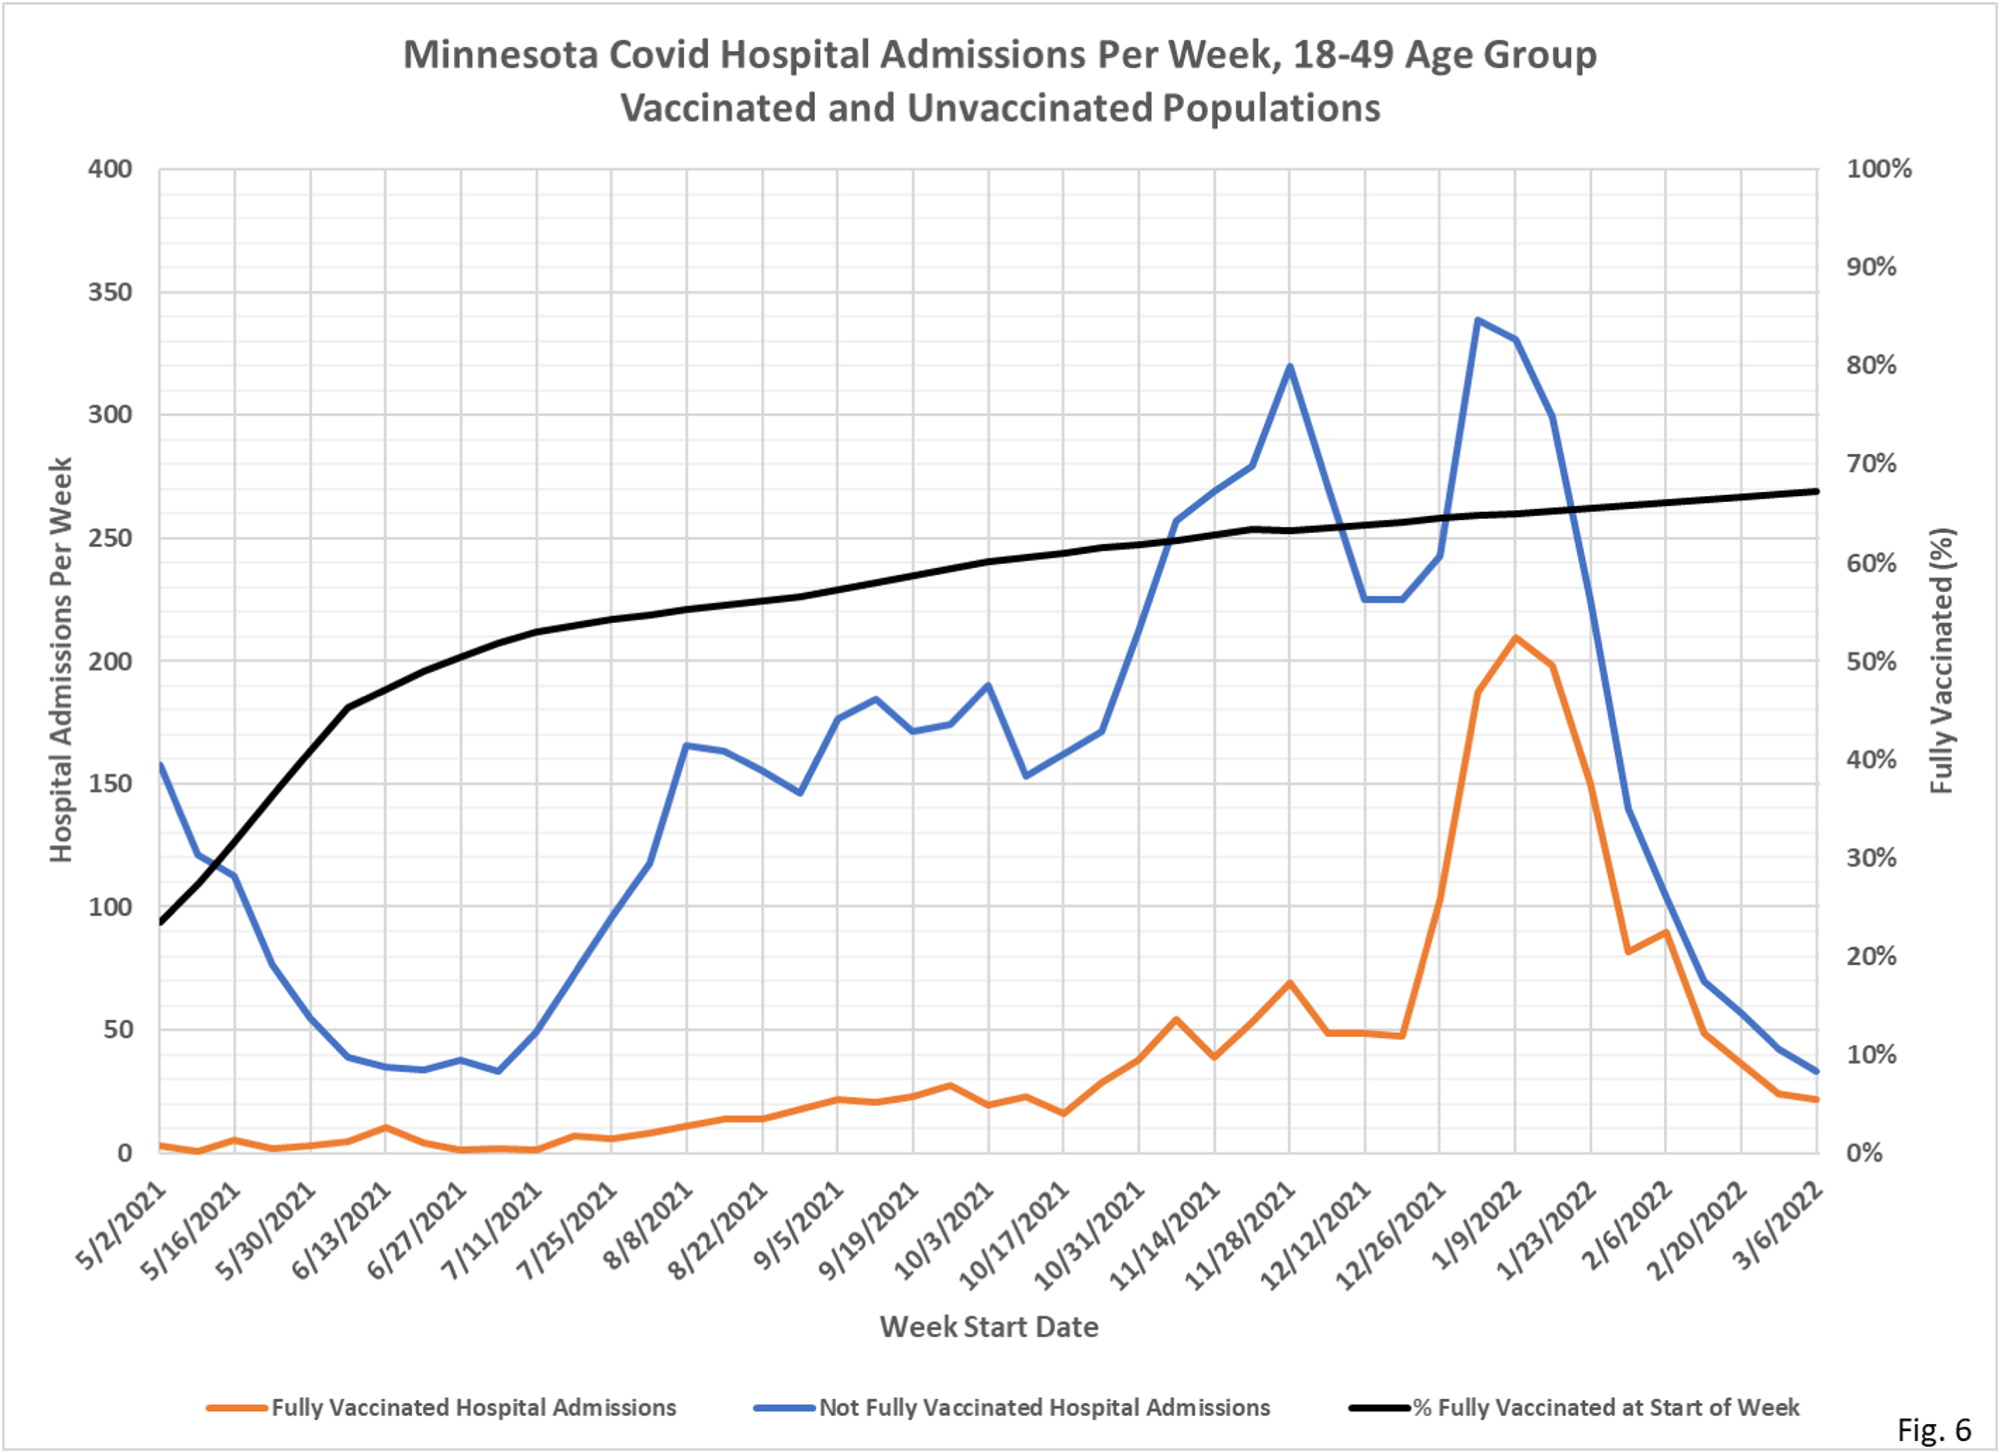
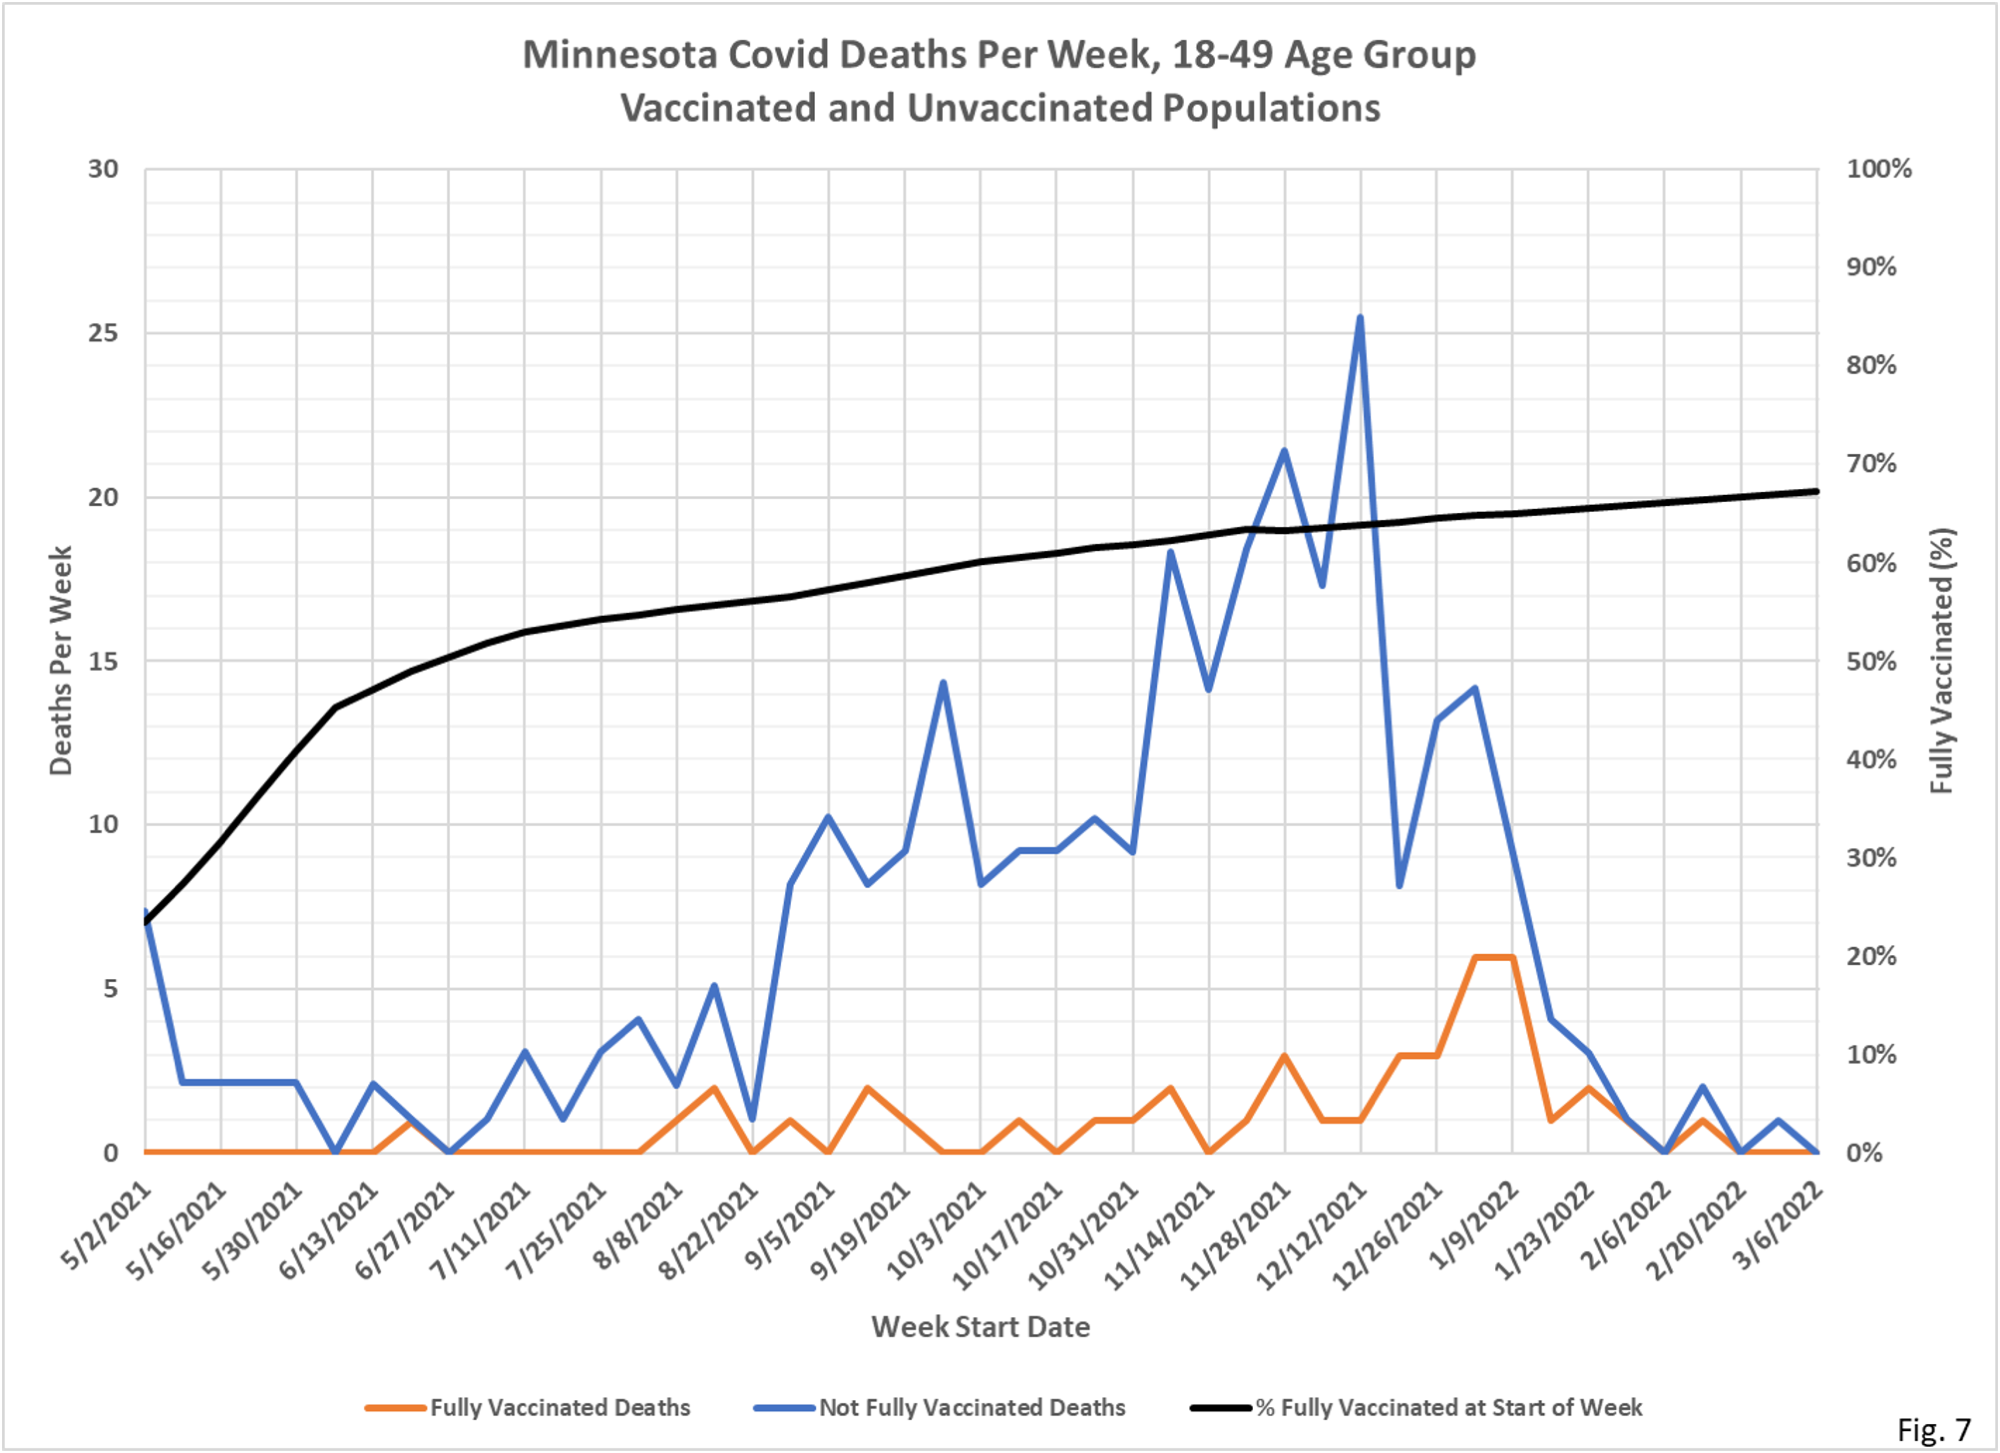
- New again this week is the addition of a curve on each chart showing the per cent of each age group that is fully vaccinated at the start of each week. Fully vaccinated is defined as completing their vaccination shots at least 14 days prior to the start of the week, but booster shots are not considered.
- Fig. 1 thru 4, 12-17 Age Group: Vaccinated cases exceed unvaccinated since 12/19/2021. Cases per week for both the vaccinated and unvaccinated are at very low rates.
- Fig. 5 thru 8, 18-49 Age Group: Cases for both vaccinated and unvaccinated are at very low levels, with hospital admissions lagging behind somewhat. Deaths in this age group are very rare in recent weeks, whether vaccinated or not.
- Fig. 9 thru 12, 50-64 Age Group: The 50-64 age group charts appear quite similar to the 18-49 age group charts. Cases are at very low levels, while hospital admissions continue to decline. There are very few deaths in recent weeks.
- Fig. 13 thru 16, 65 and Over Age Group: Cases, hospitalizations, and deaths in this age group are still declining, in contrast to the other groups which have already leveled out at low levels.
- The data source for all charts is the data file vbtcirates.xlsx, found on the Minnesota Department of Health (MDH) web page: https://www.health.state.mn.
us/diseases/coronavirus/stats/ vbtcirates.xlsx . This data file gives the rates per 100k of cases, hospitalizations, and deaths in full vaccinated and not fully vaccinated people, broken out by age group. The rates per 100k in vbtcirates.xlsx are converted into cases, hospitalizations, and deaths by multiplying by the appropriate population. The number of vaccinated people by age group can found on the Vaccine Data page, https://mn.gov/covid19/ vaccine/data/index.jsp , in the data file People Vaccinated by Age. The unvaccinated population is found by taking the US Census American Community Survey 5-Year Estimate (Data Table S0101, https://data.census.gov/ cedsci/table) and subtracting the vaccinated population. The breakthrough proportion is then found by dividing the breakthrough events by the total of the breakthrough and non-breakthrough weekly events. - MDH defines a breakthrough event as a Covid case, hospital admission, or death that occurs 14 or more days after completing the vaccination series (not including boosters).

It would be terrific if % using masks were overlayed as well as vaxxed.
Also, when you see someone wearing a mask start asking them when they plan to stop wearing them.
Of course, any place that requires masks tell them they are useless or worse.
I always offer them a rabbit’s foot instead of the mask, same if not better odds. And, much more environmentally friendly, which most of the ‘mask wearers’ think they are experts on as well.
Curious about your take on the roughly 3 month ‘dip’ shift from June (2021) to March (2022). You had posted what was thought to be ‘seasonal’ representations of the ‘cases’ moving through the country last year. 2022 seems to be much different. Maybe too many variables to untangle?
I think there is some meteorological effect, I can’t for the life of me figure out what it is, and it obviously can be overridden by other factors. As you note, we have seen somewhat different patterns even in the two year of the epidemic to date.
After the winter 2020/21 spike, there was a very similar, although not as low, dip in March of 2021. Then there was a slight rise in April and by July it was back down to extremely low levels. Now after the winter 2021/2022 (mostly January/February 2022) spike, we’re now in another March dip. If the pattern continues, we might see another slight rise in April/May and then back down again on June/July.
Anyways, pointing that out as the charts above only go back the full year, so the comment about a shift (June 2021 –> March 2022) might not be apples to apples since there was a March 2021 dip as well.