Once more into the breach with the look at events by age group. Not much to see that is different from recent weeks.
 Dave’s notes:
- Overall, Covid cases remain flat at low levels, with no sign of an increase in the last several weeks. ICU admissions and Non-ICU admissions appear to have reached an equilibrium at levels somewhat higher than the lows in the summer of 2021. Reported Covid deaths are still declining.
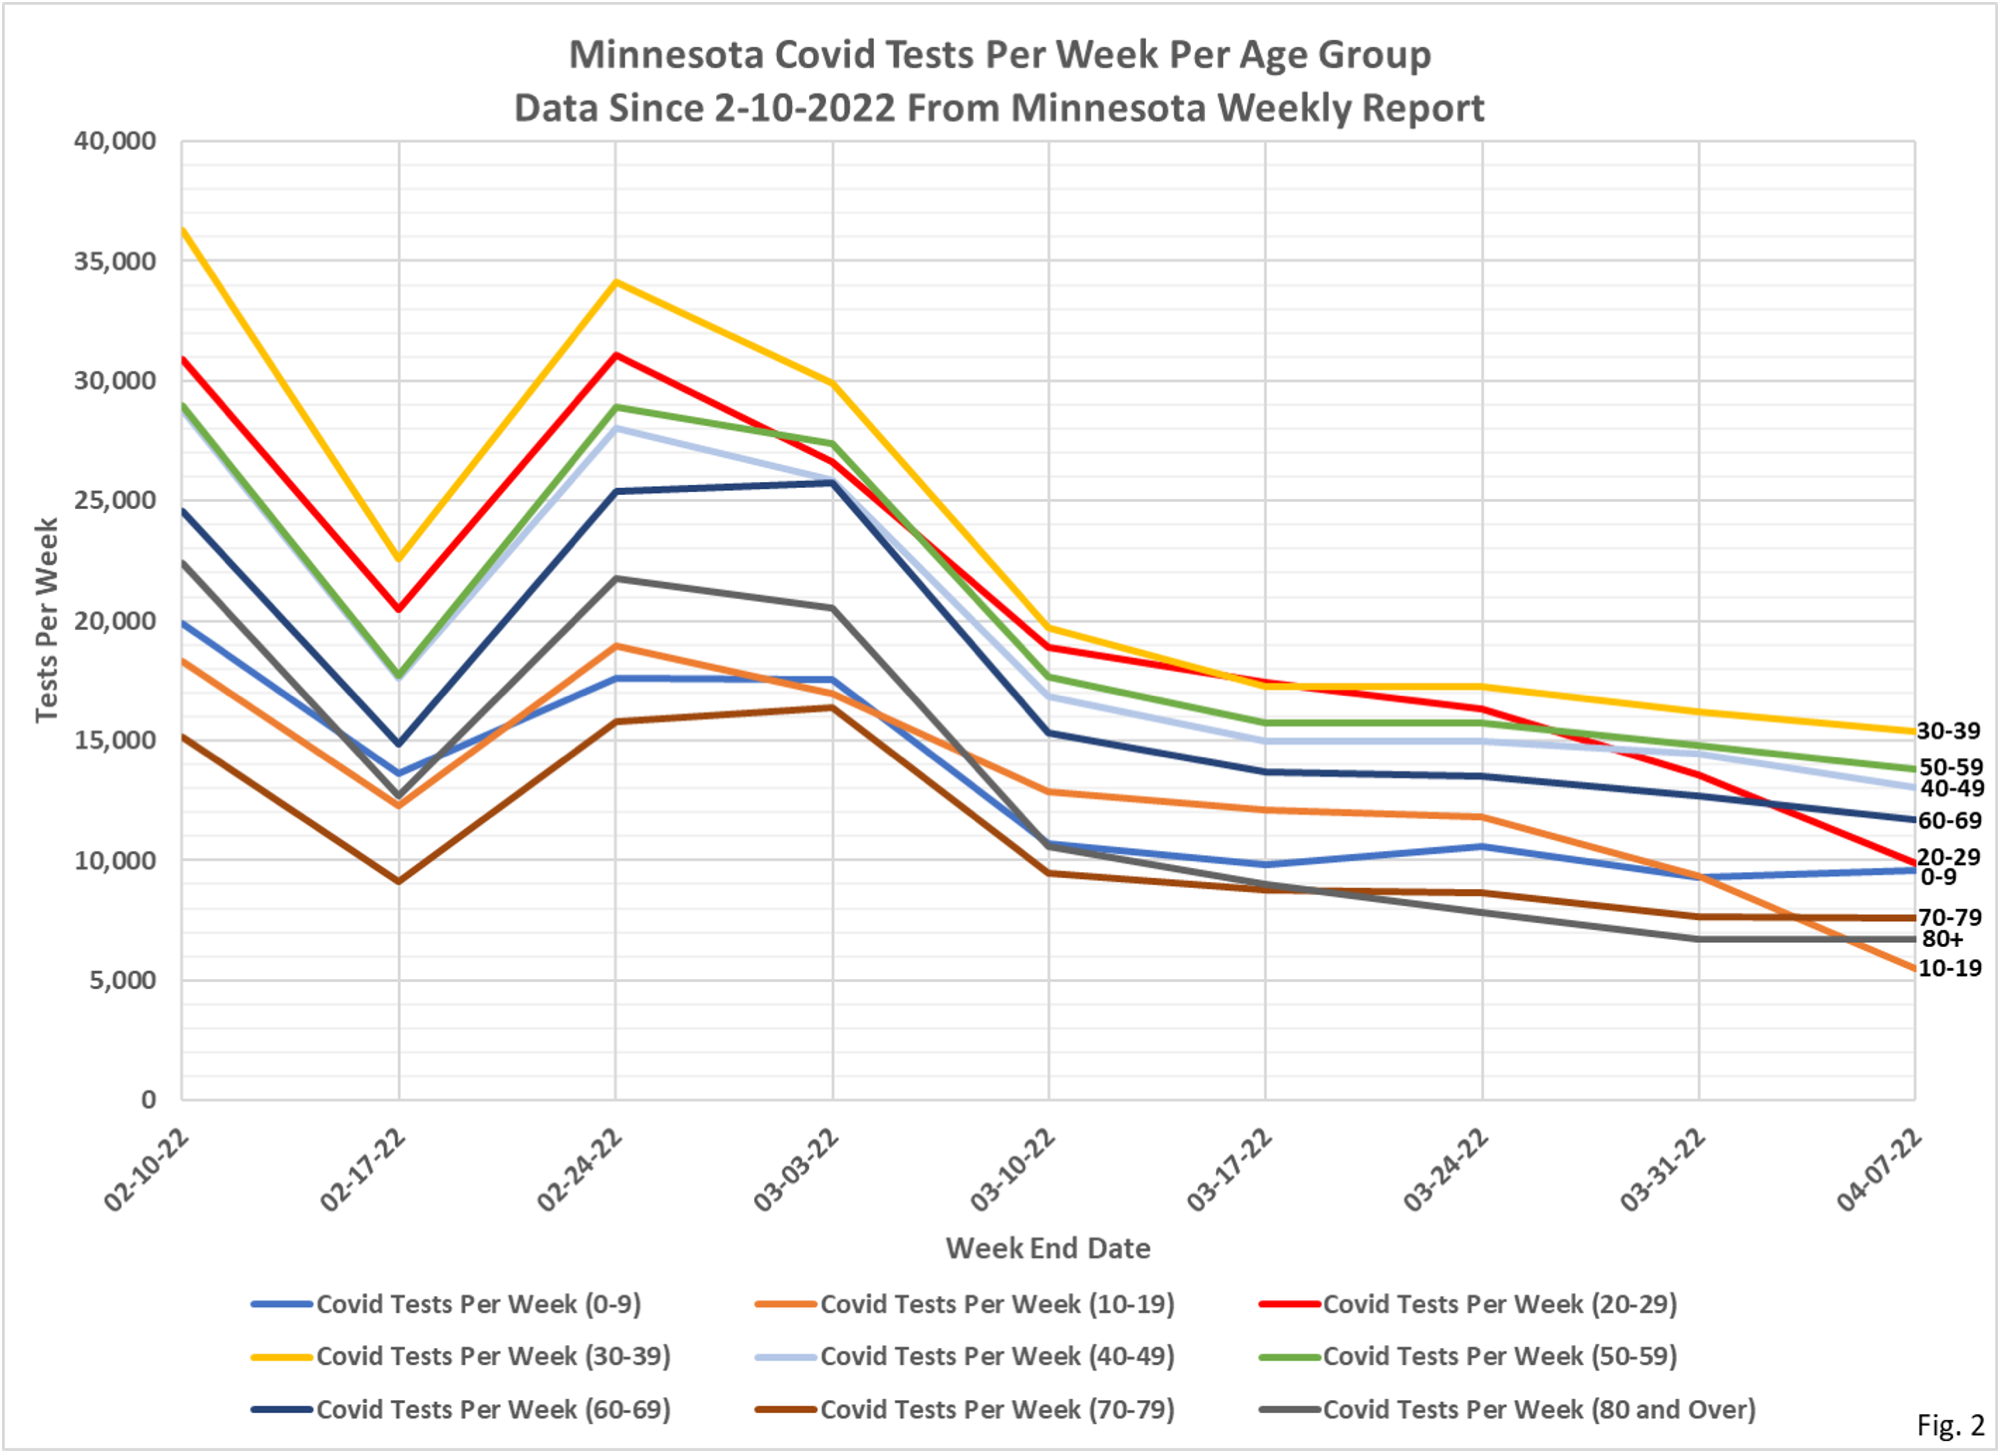
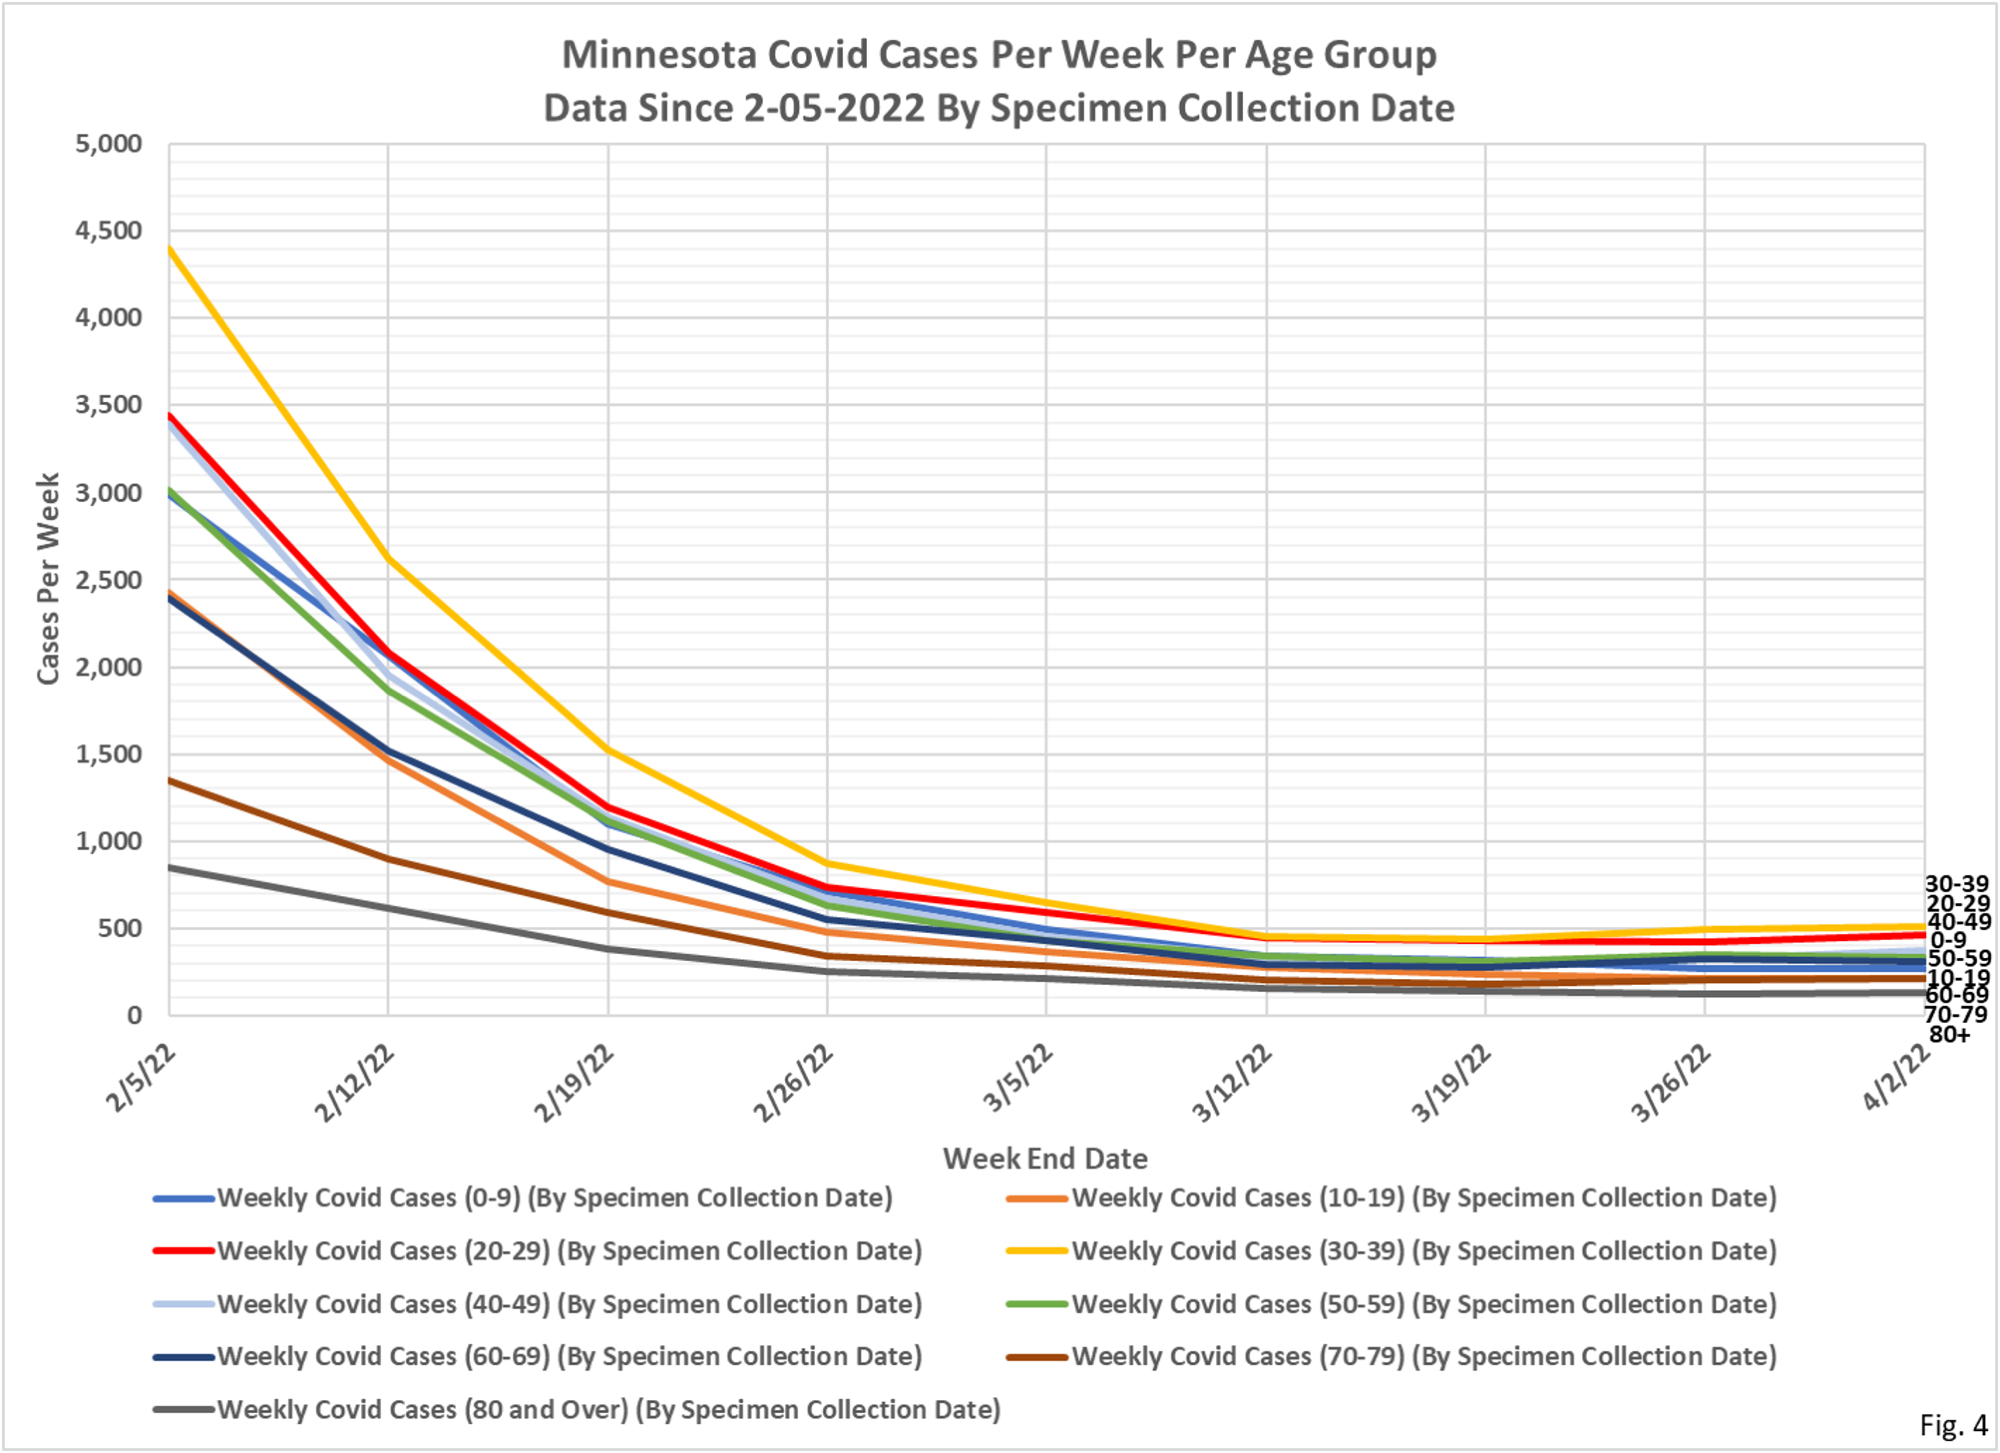
- As always there are 2 charts for each metric. New this week, the second chart for each metric starts on 2/10/2022 (2/05/2022 for the Cases chart, because the data source for cases uses different date definitions).
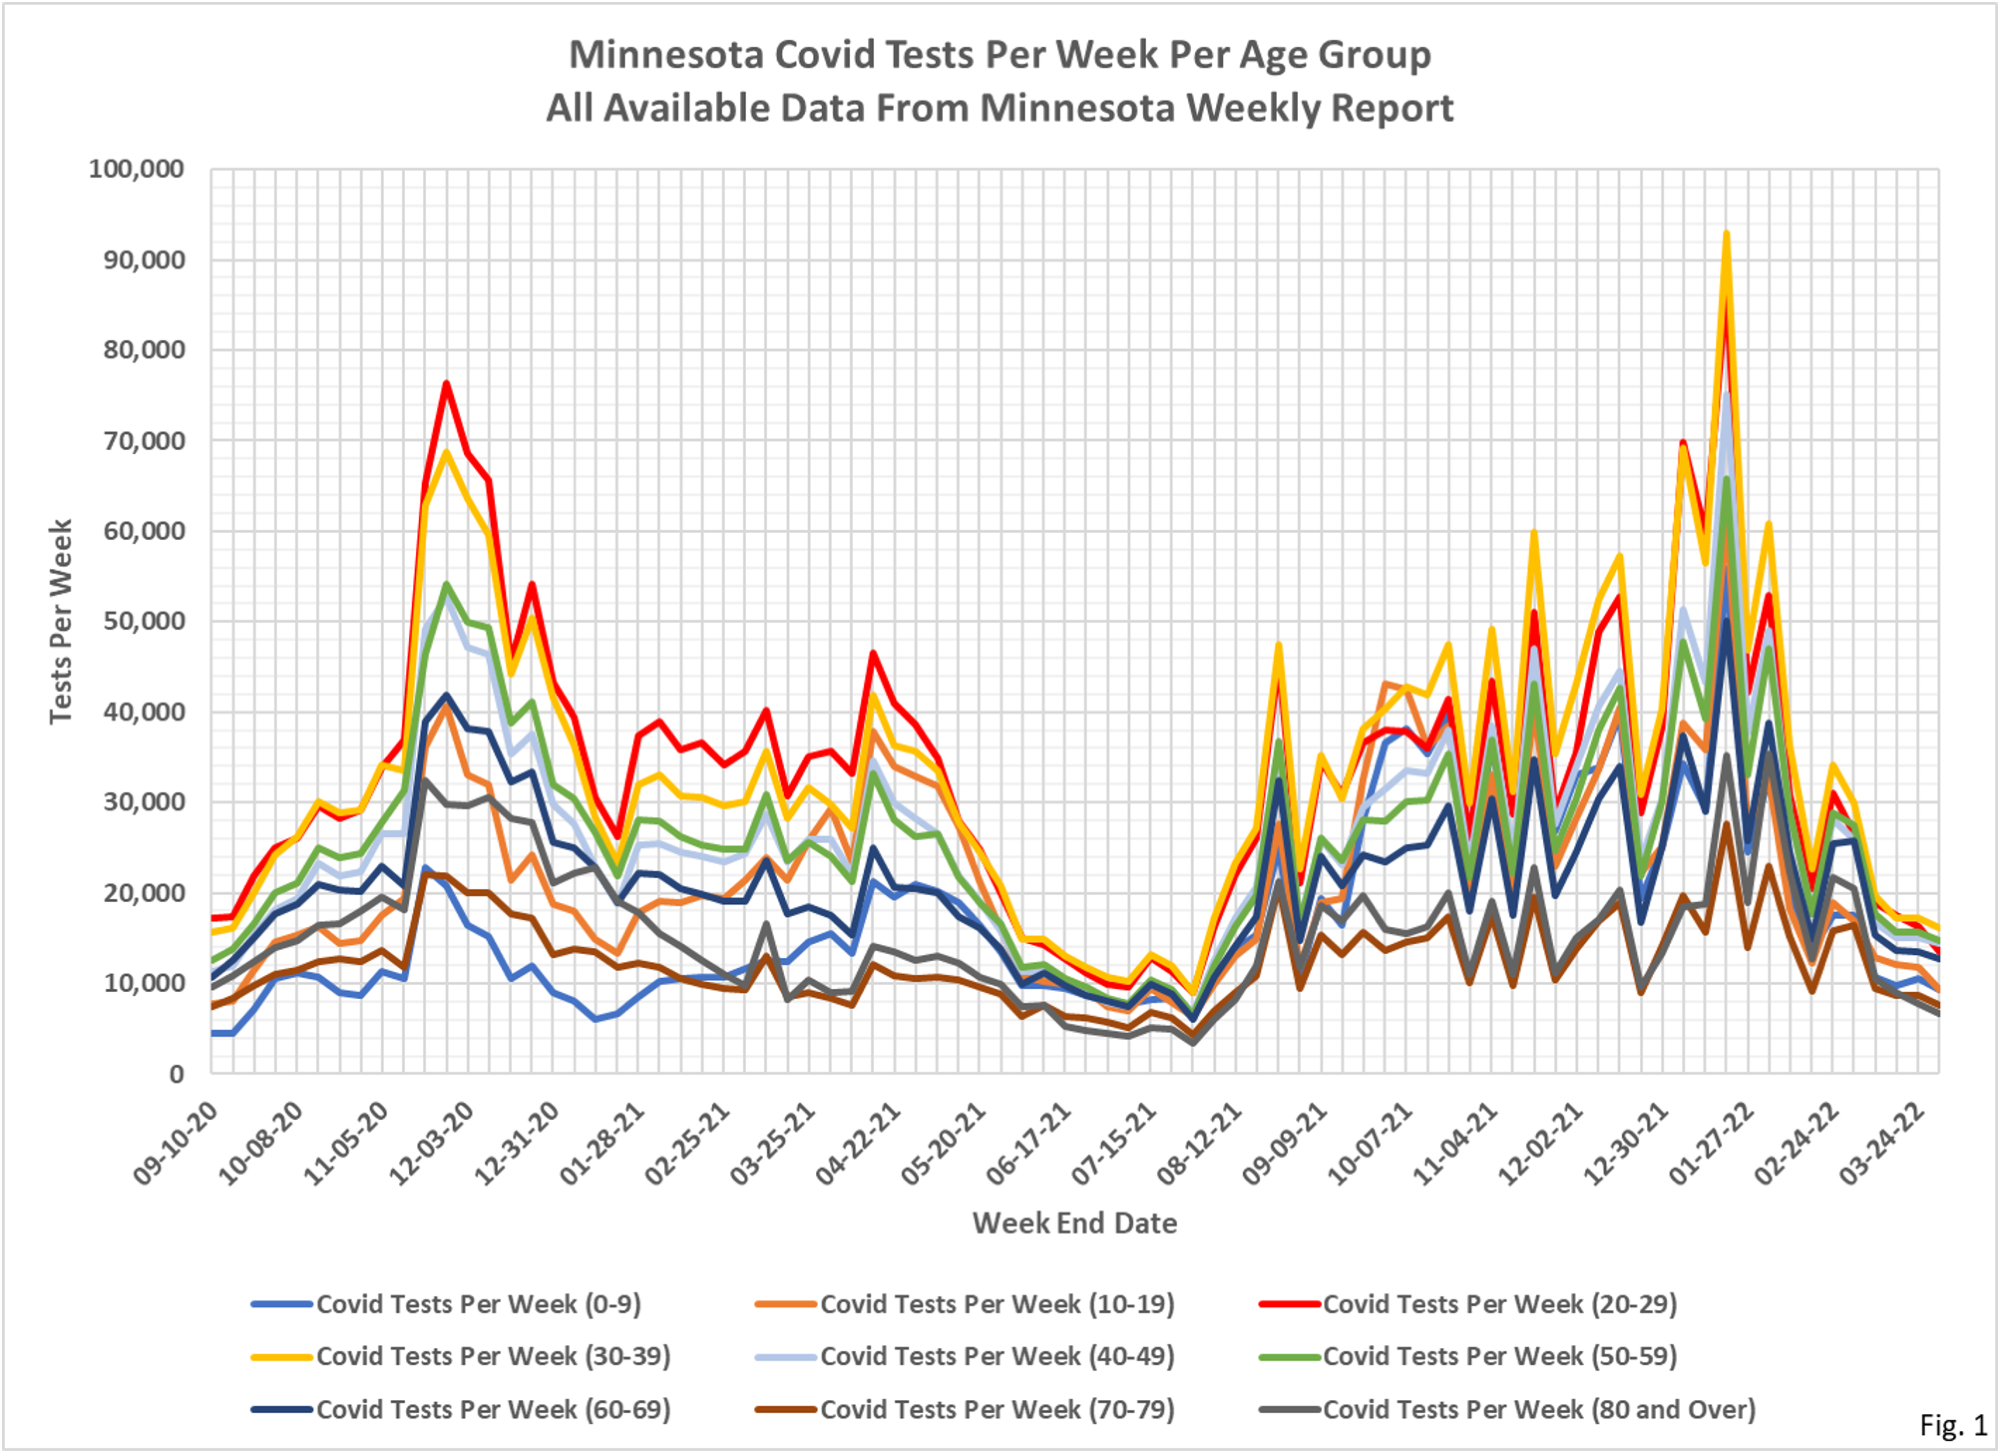
- Fig. 1 and 2: Covid Tests Per Week. Reported testing for all age groups was flat to slightly lower this week, except for the 10-19 and 20-29 age groups, which have had steeper declines the last 2 weeks than the other age groups. Lower testing related to schools? Total reported tests this week were 93,202, the lowest since the week of 7/29/2021 when there were only 57,980 total reported tests.
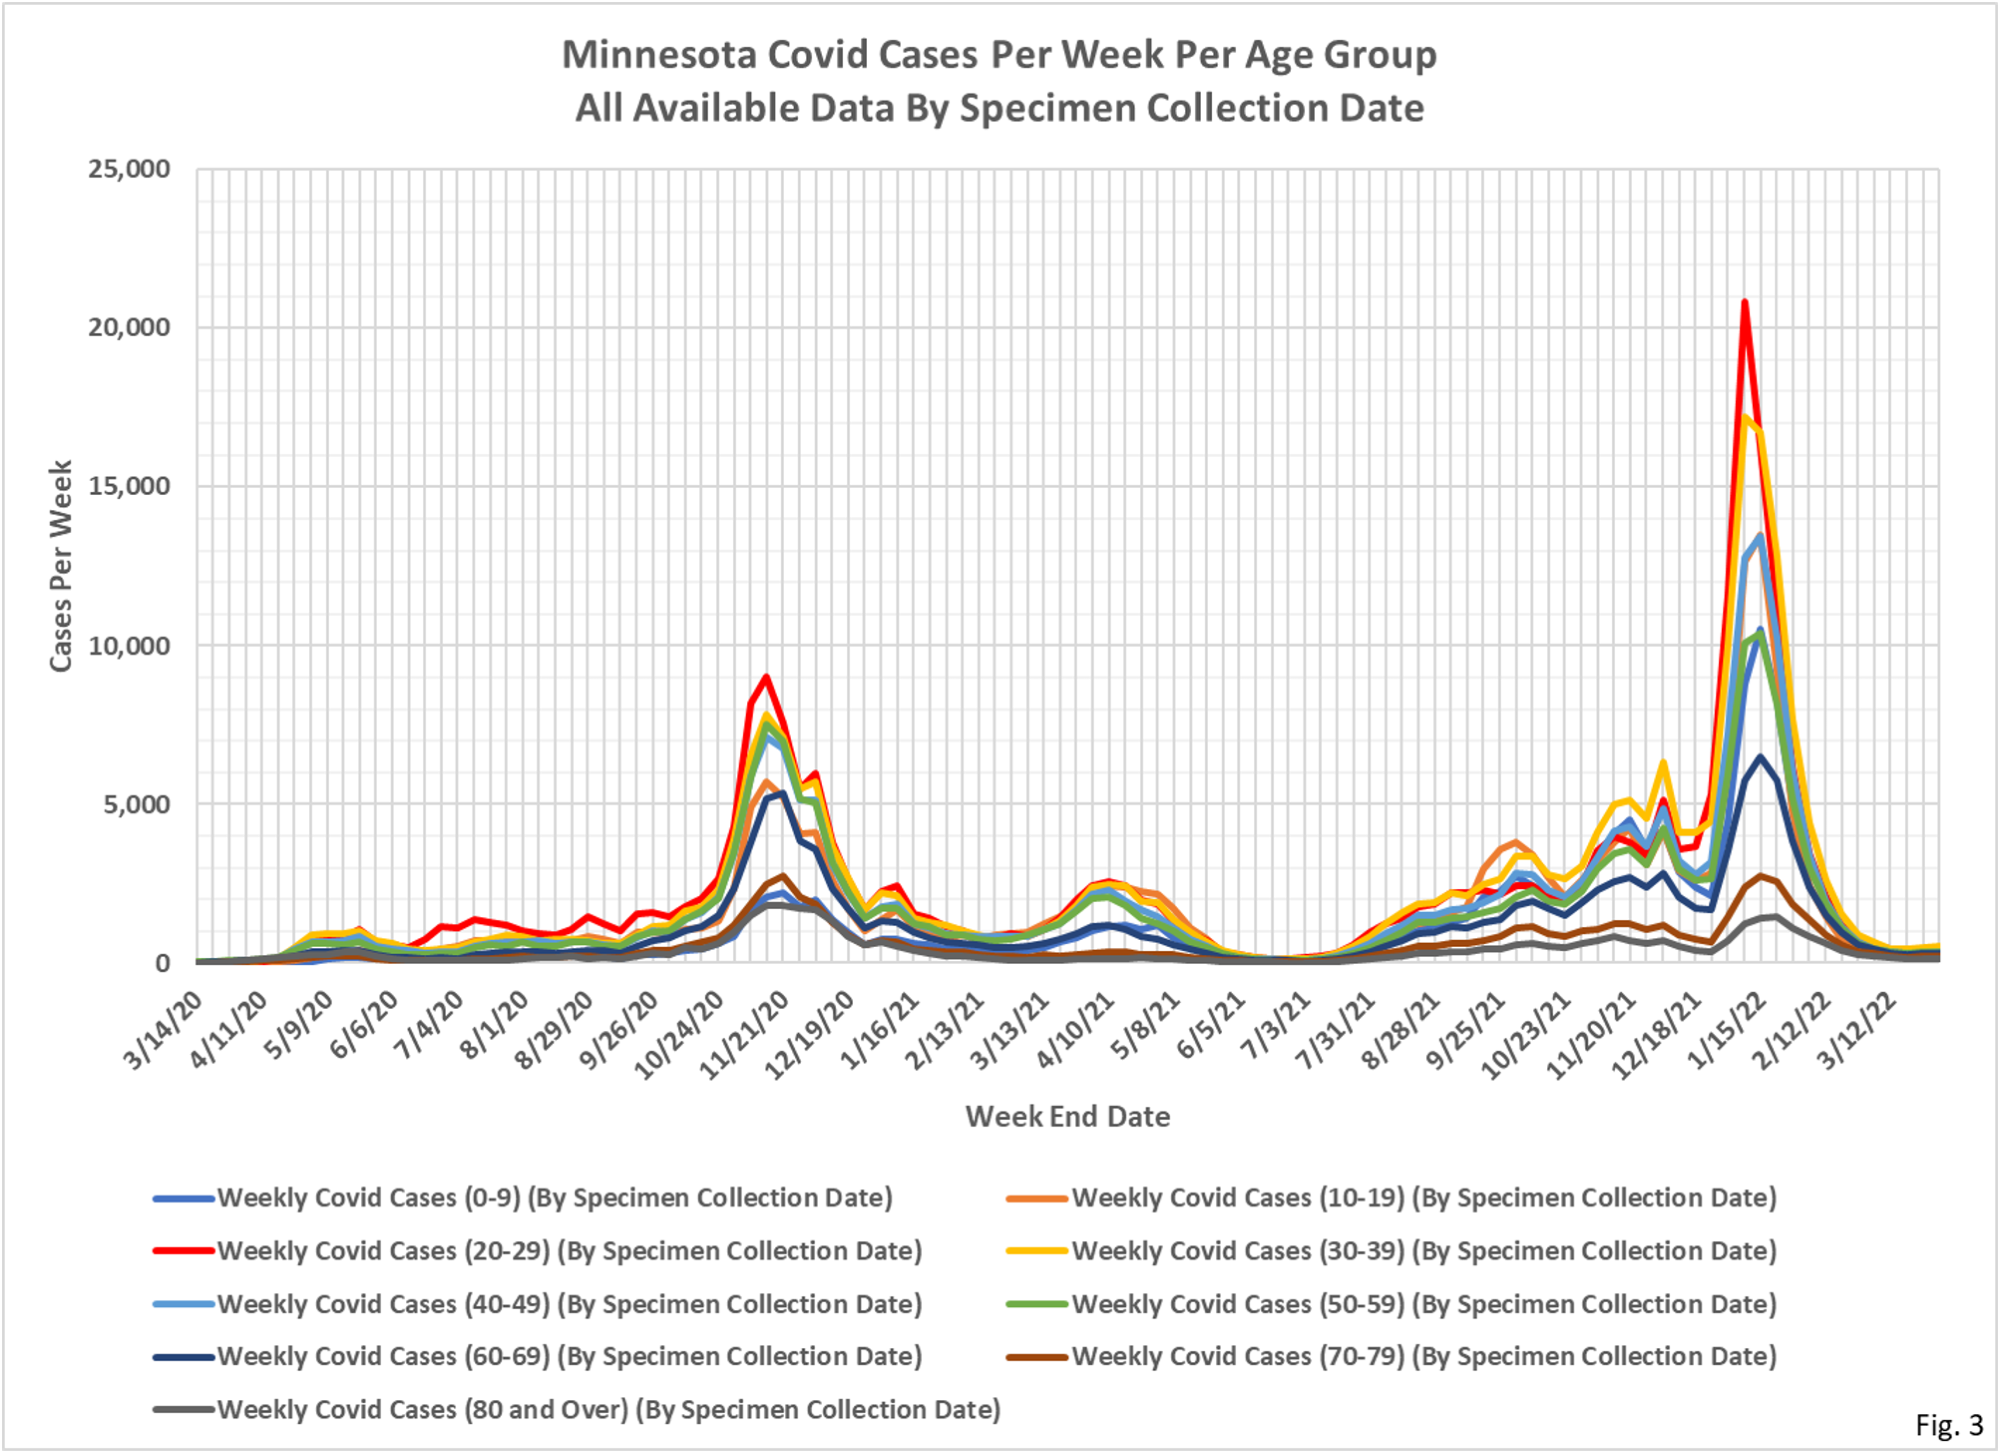
- Fig. 3 and 4: Covid Cases Per Week. The reported Covid cases this week have been relatively constant now for 4 weeks, with no sign of a spring increase like Minnesota experienced last year. Total reported cases for the week were 3,067 total for all age groups, a modest increase from 2,764 cases reported last week.
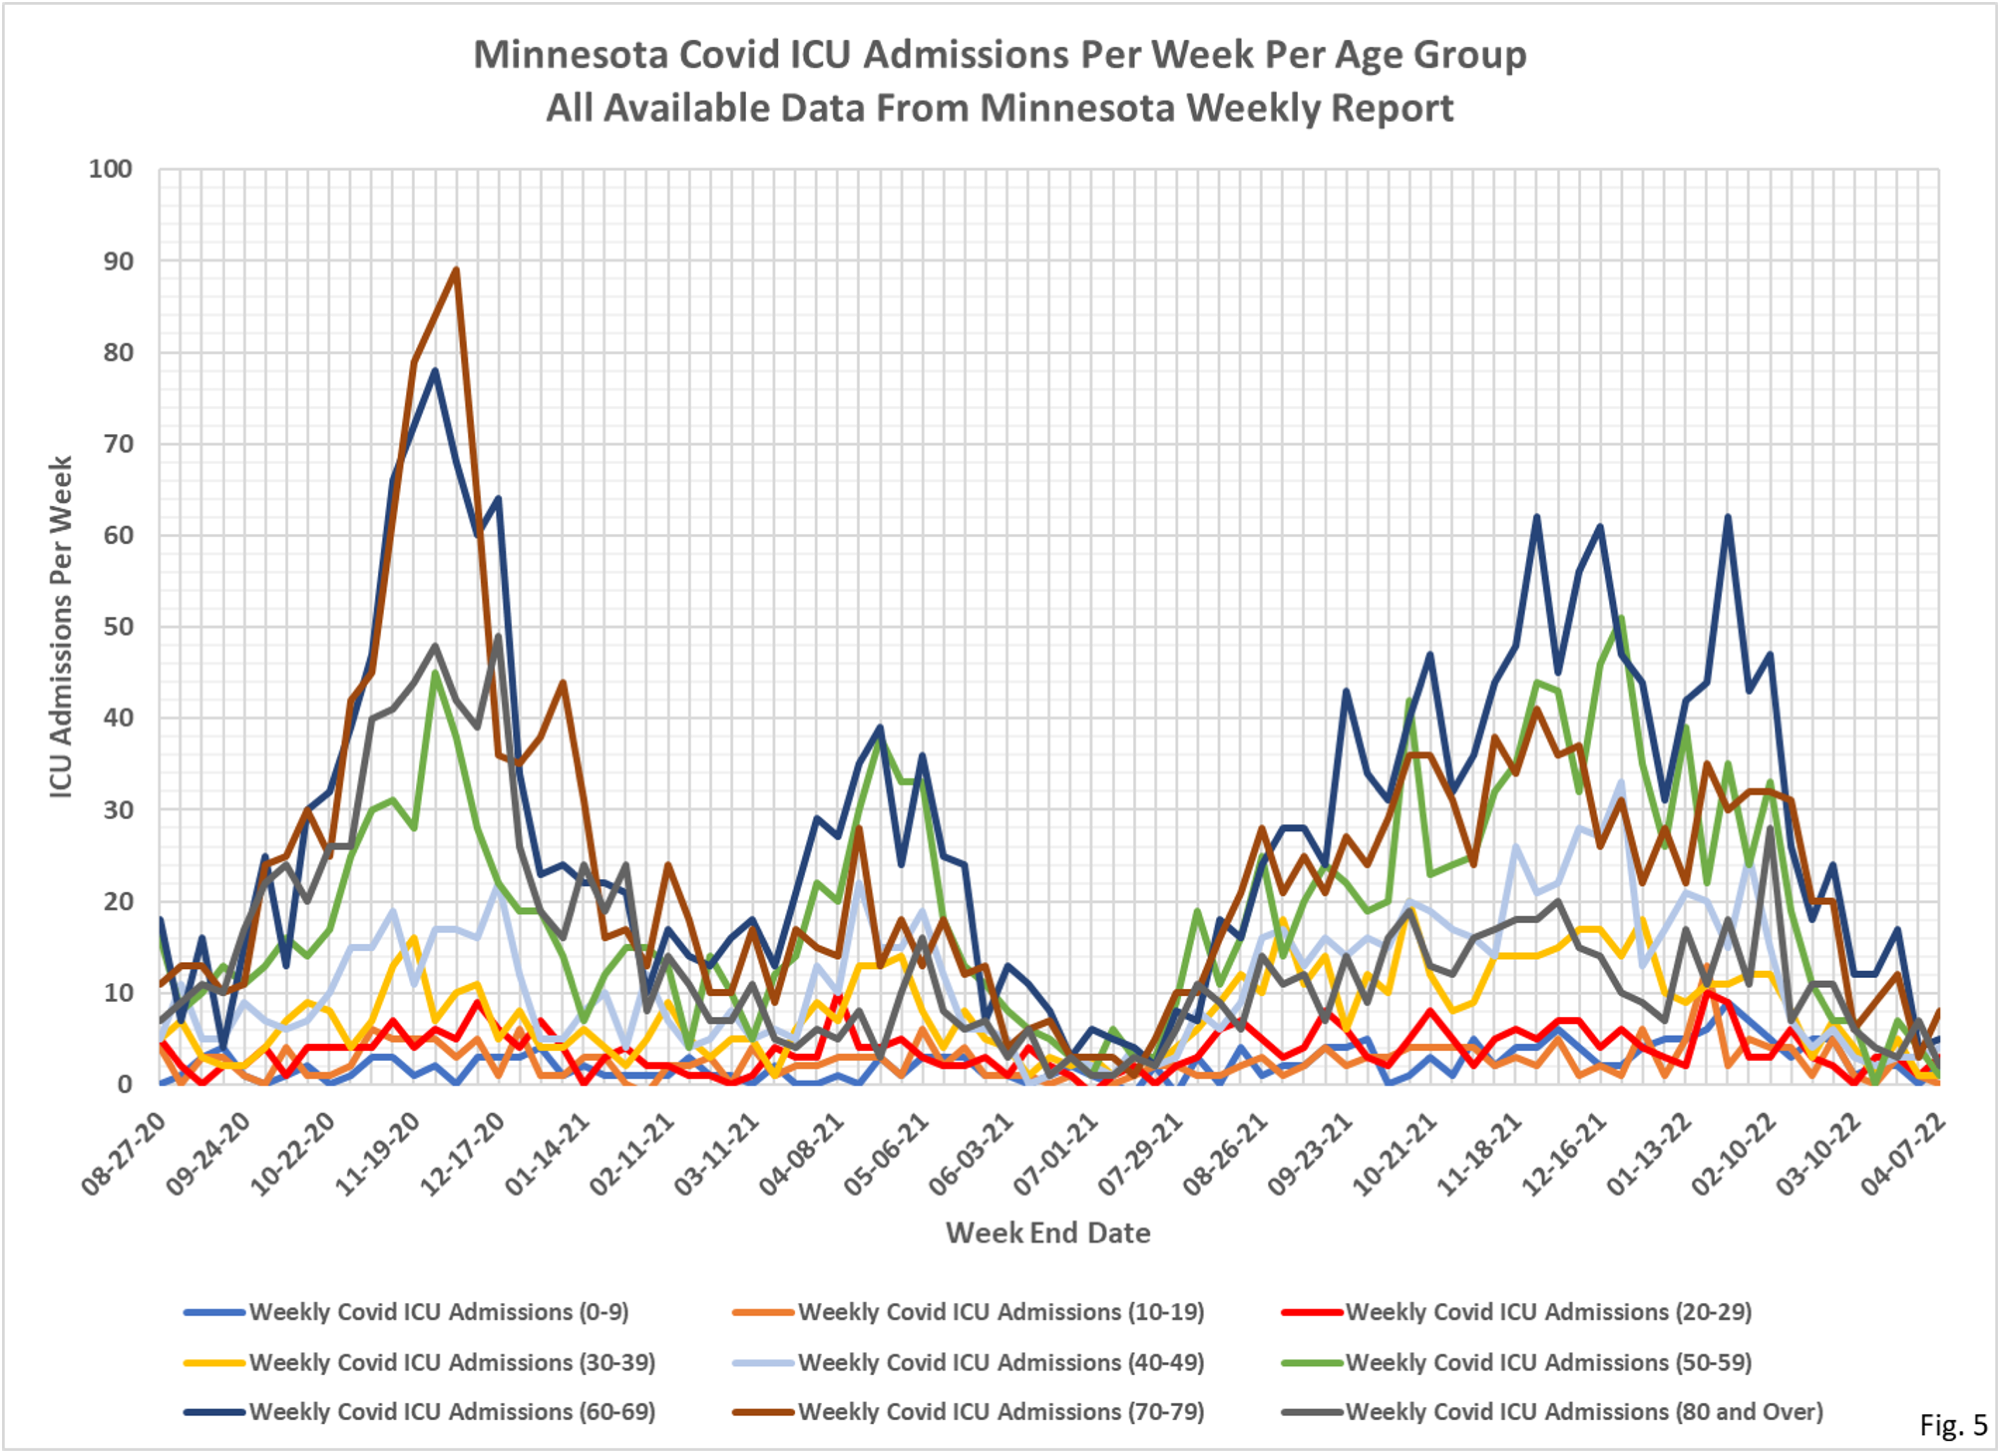
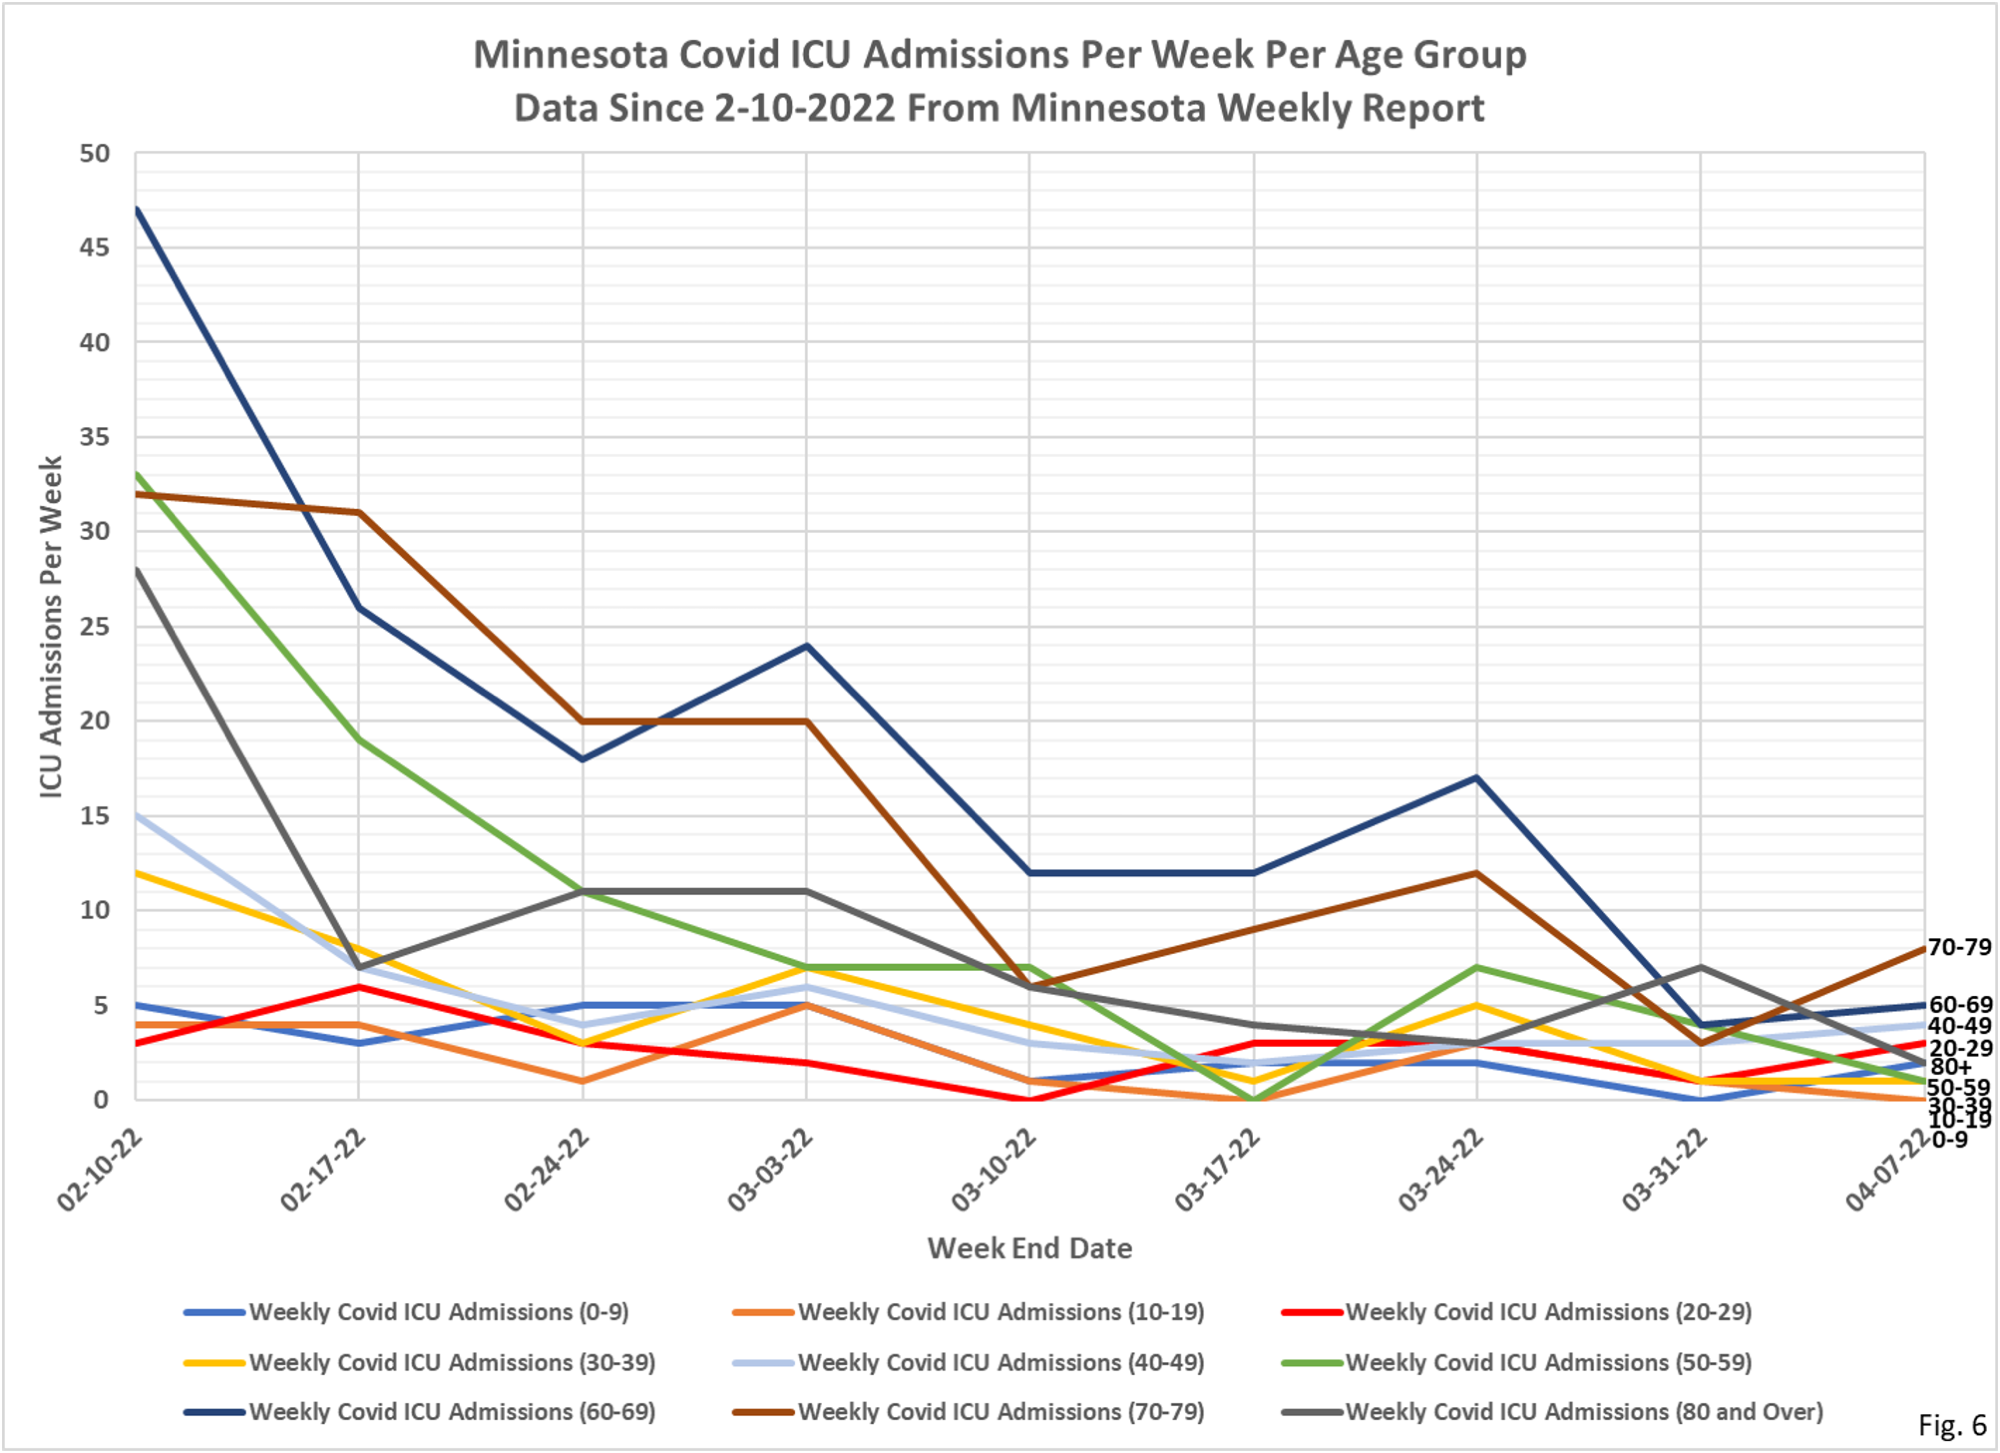
- Fig. 5 and 6: ICU Covid Admissions Per Week. Reported total ICU admissions for the week were 26, an increase of 2 over the prior week.
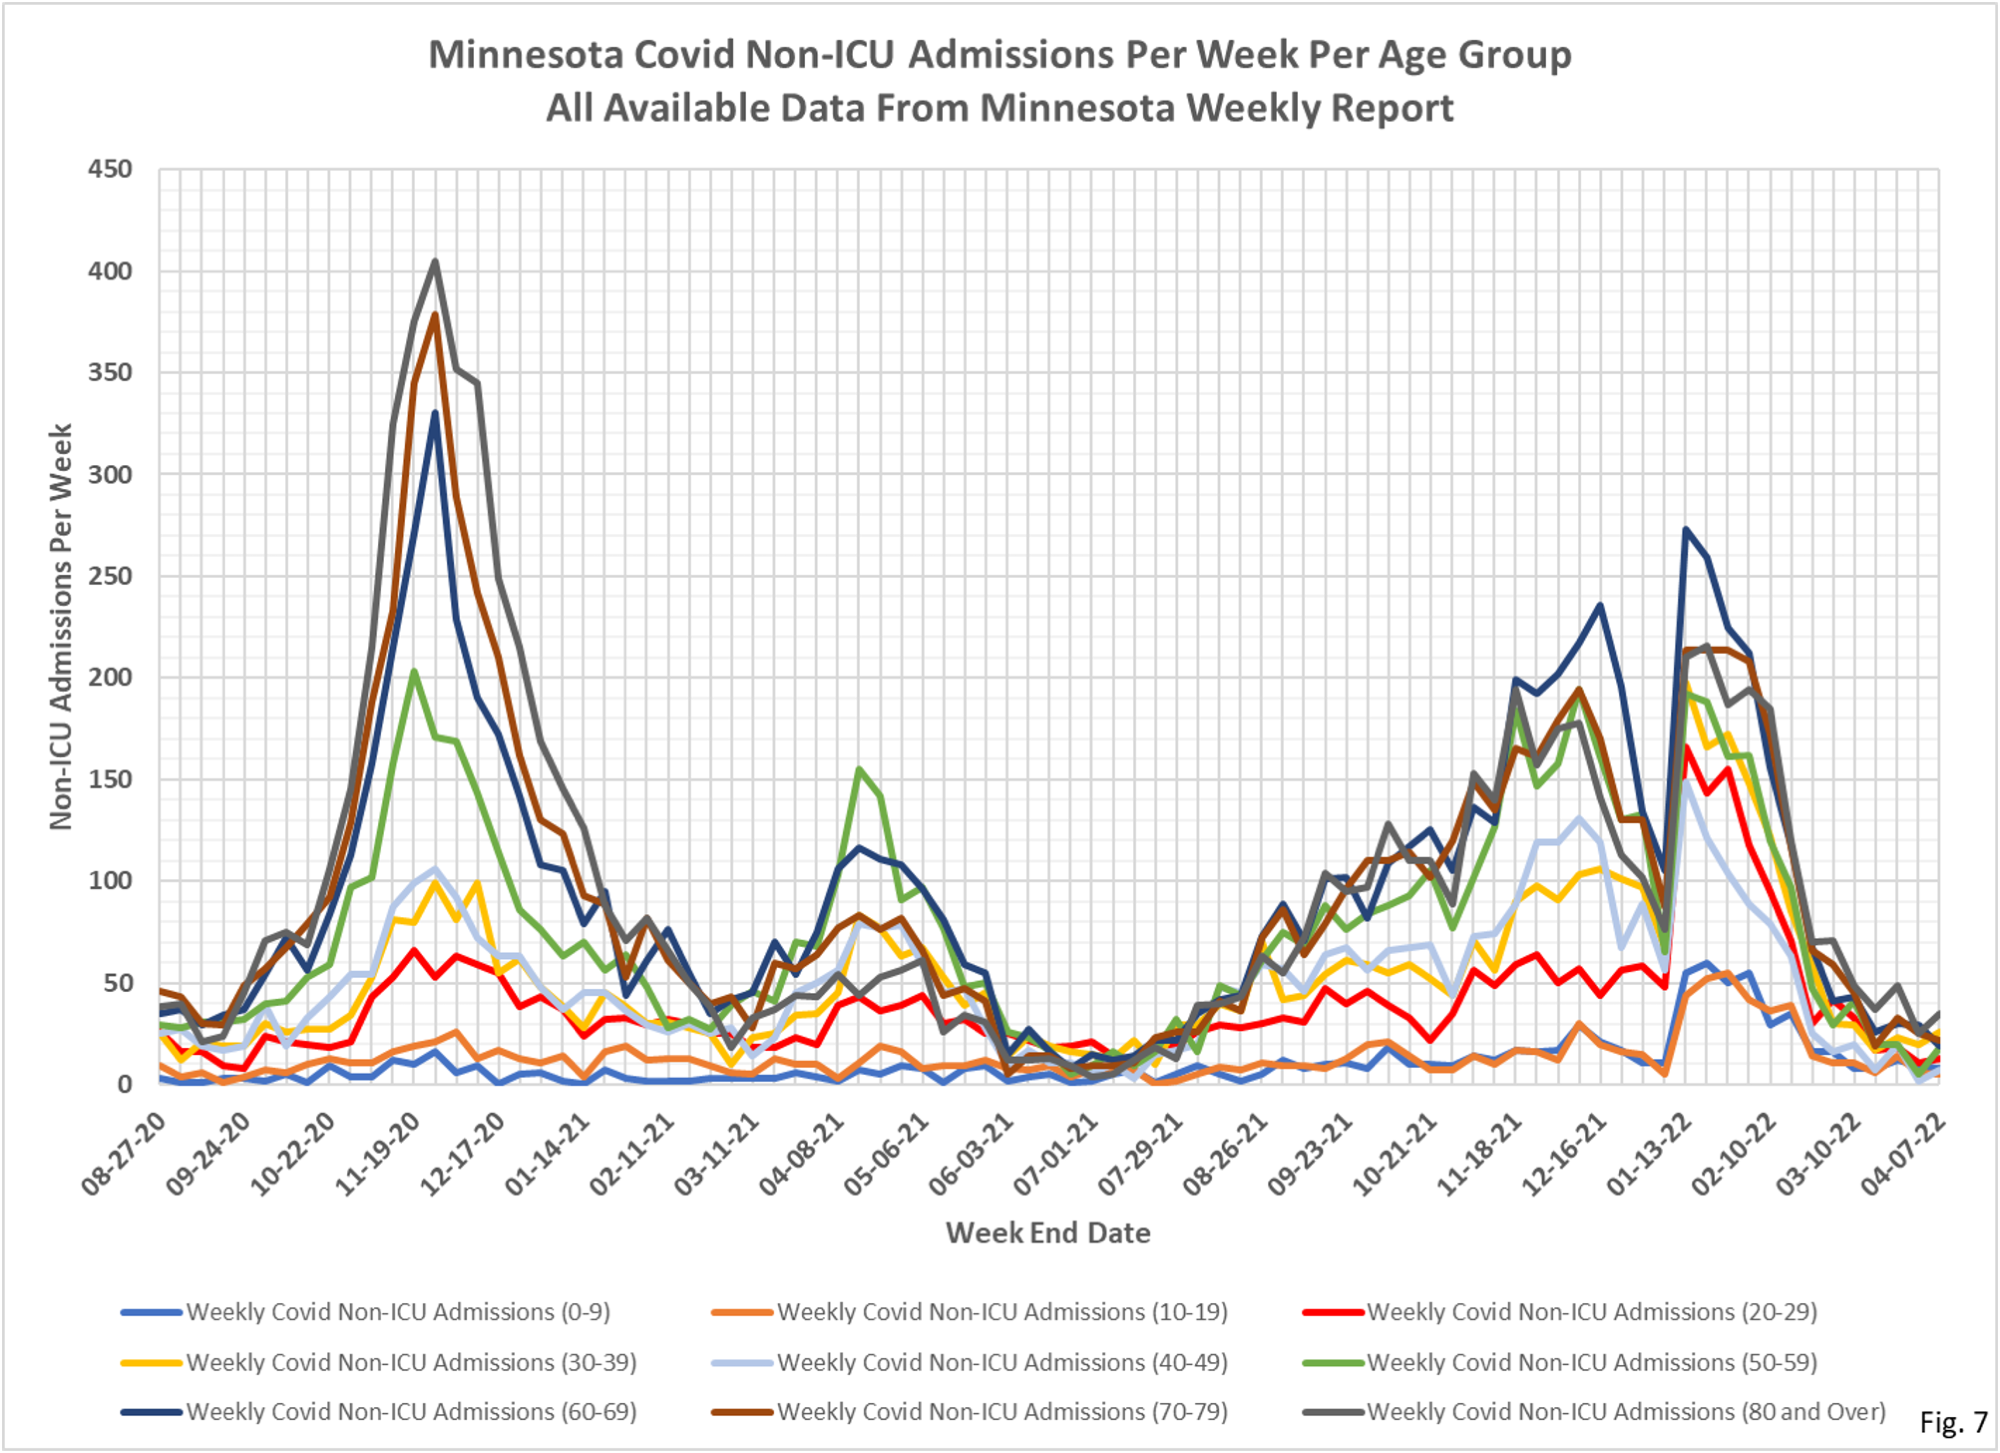
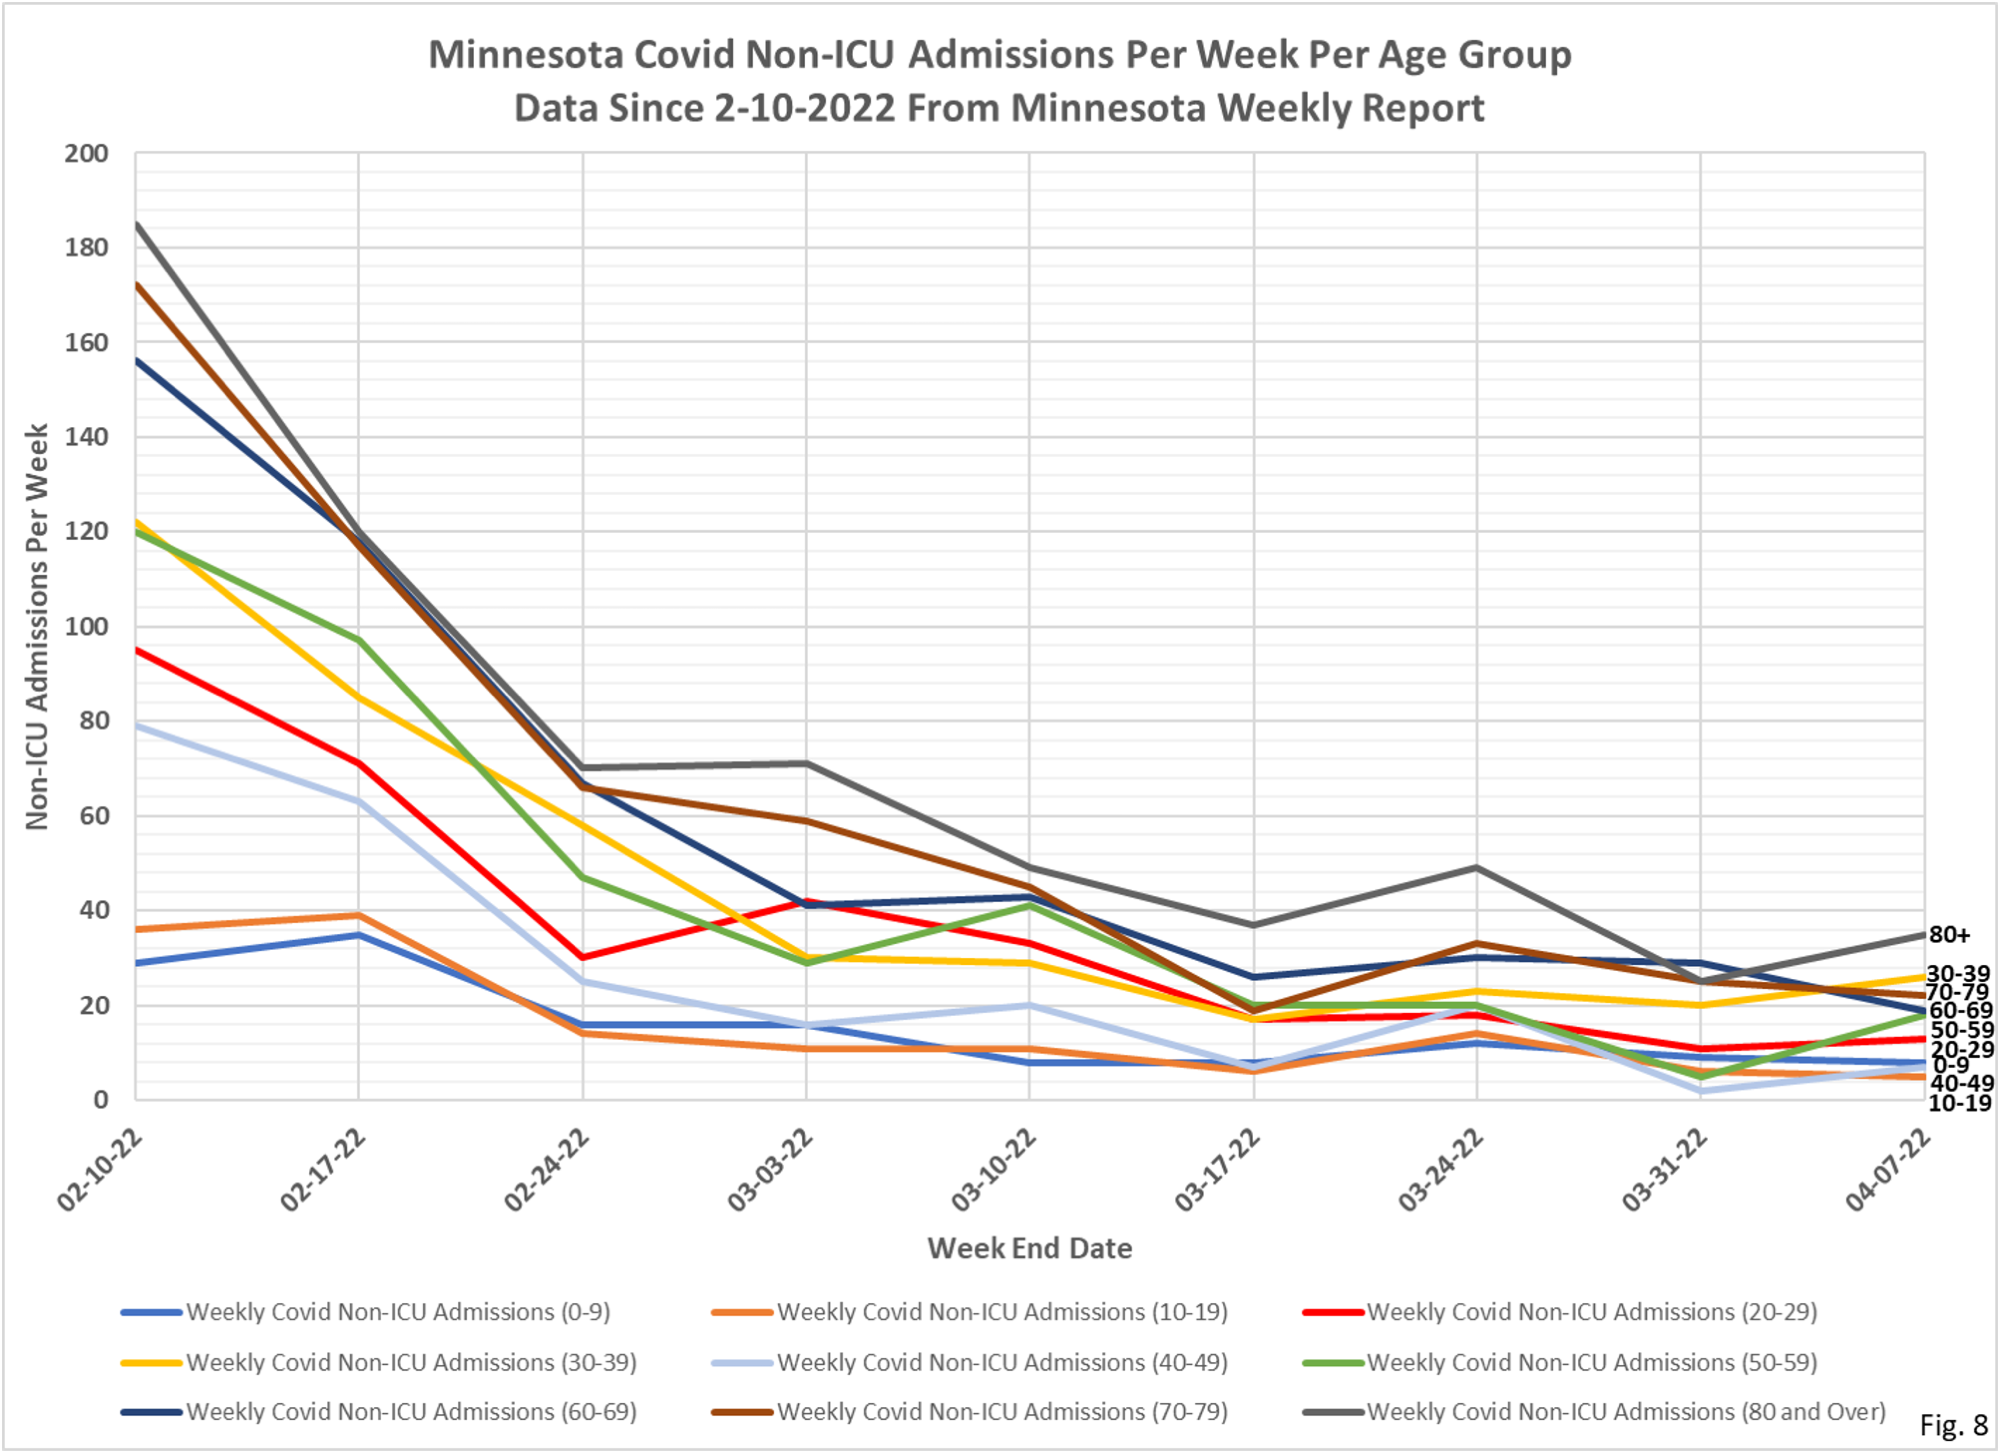
- Fig. 7 and 8: Non-ICU Covid Admissions Per Week. Reported Non-ICU Covid admissions were somewhat higher this week. Total Reported Non-ICU Covid admissions for the week were 153, an increase of 21 admissions from the prior week’s total of 132, but lower than the 219 admissions 2 weeks ago.
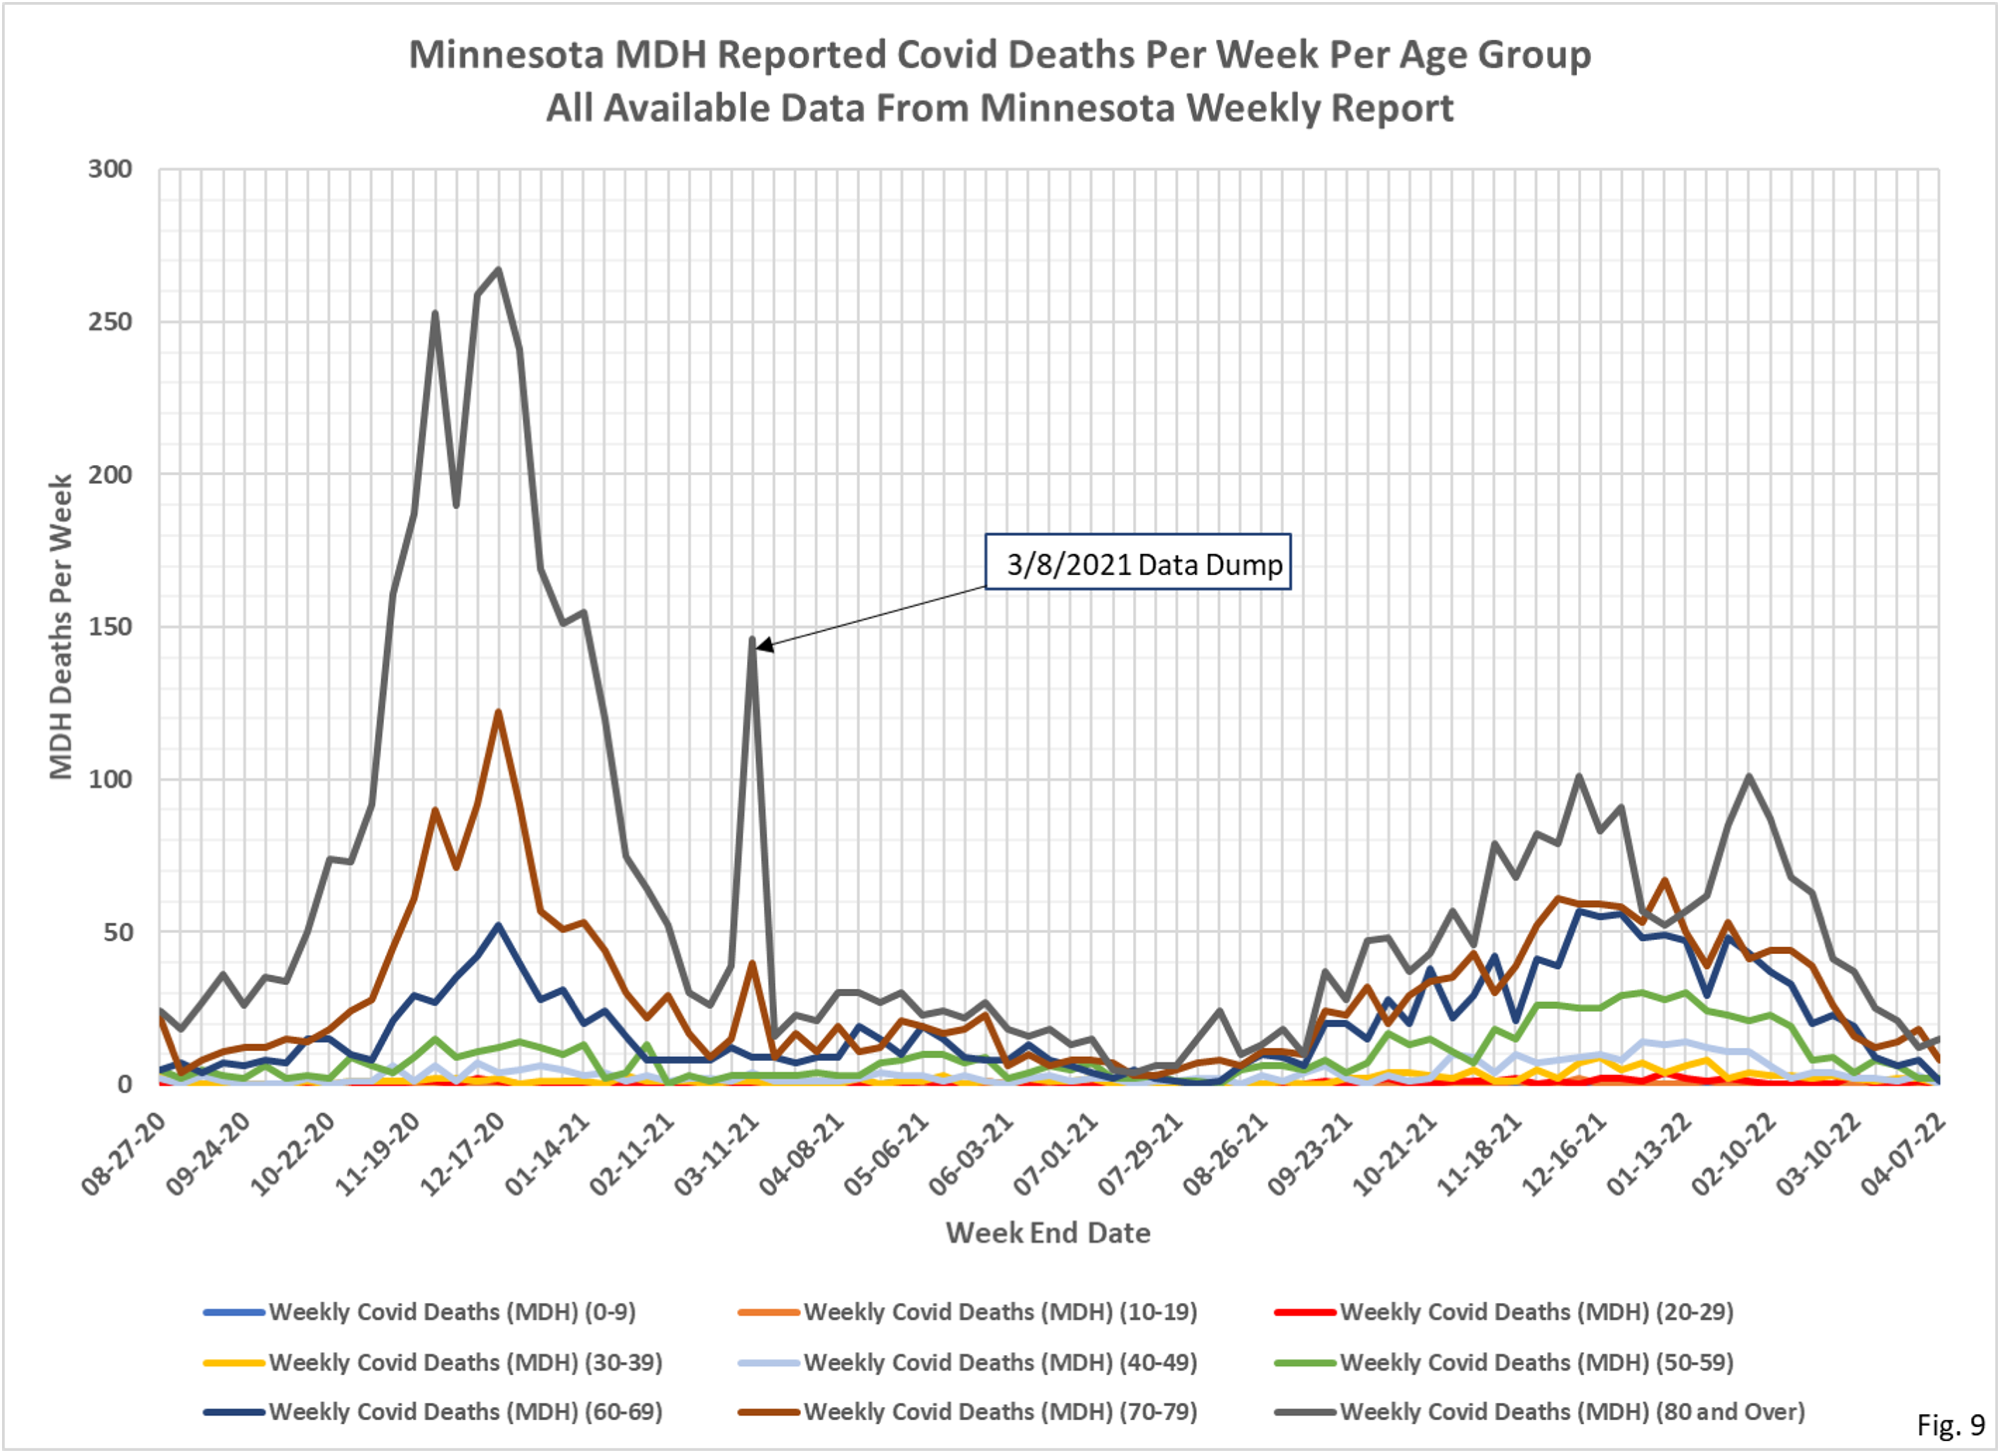
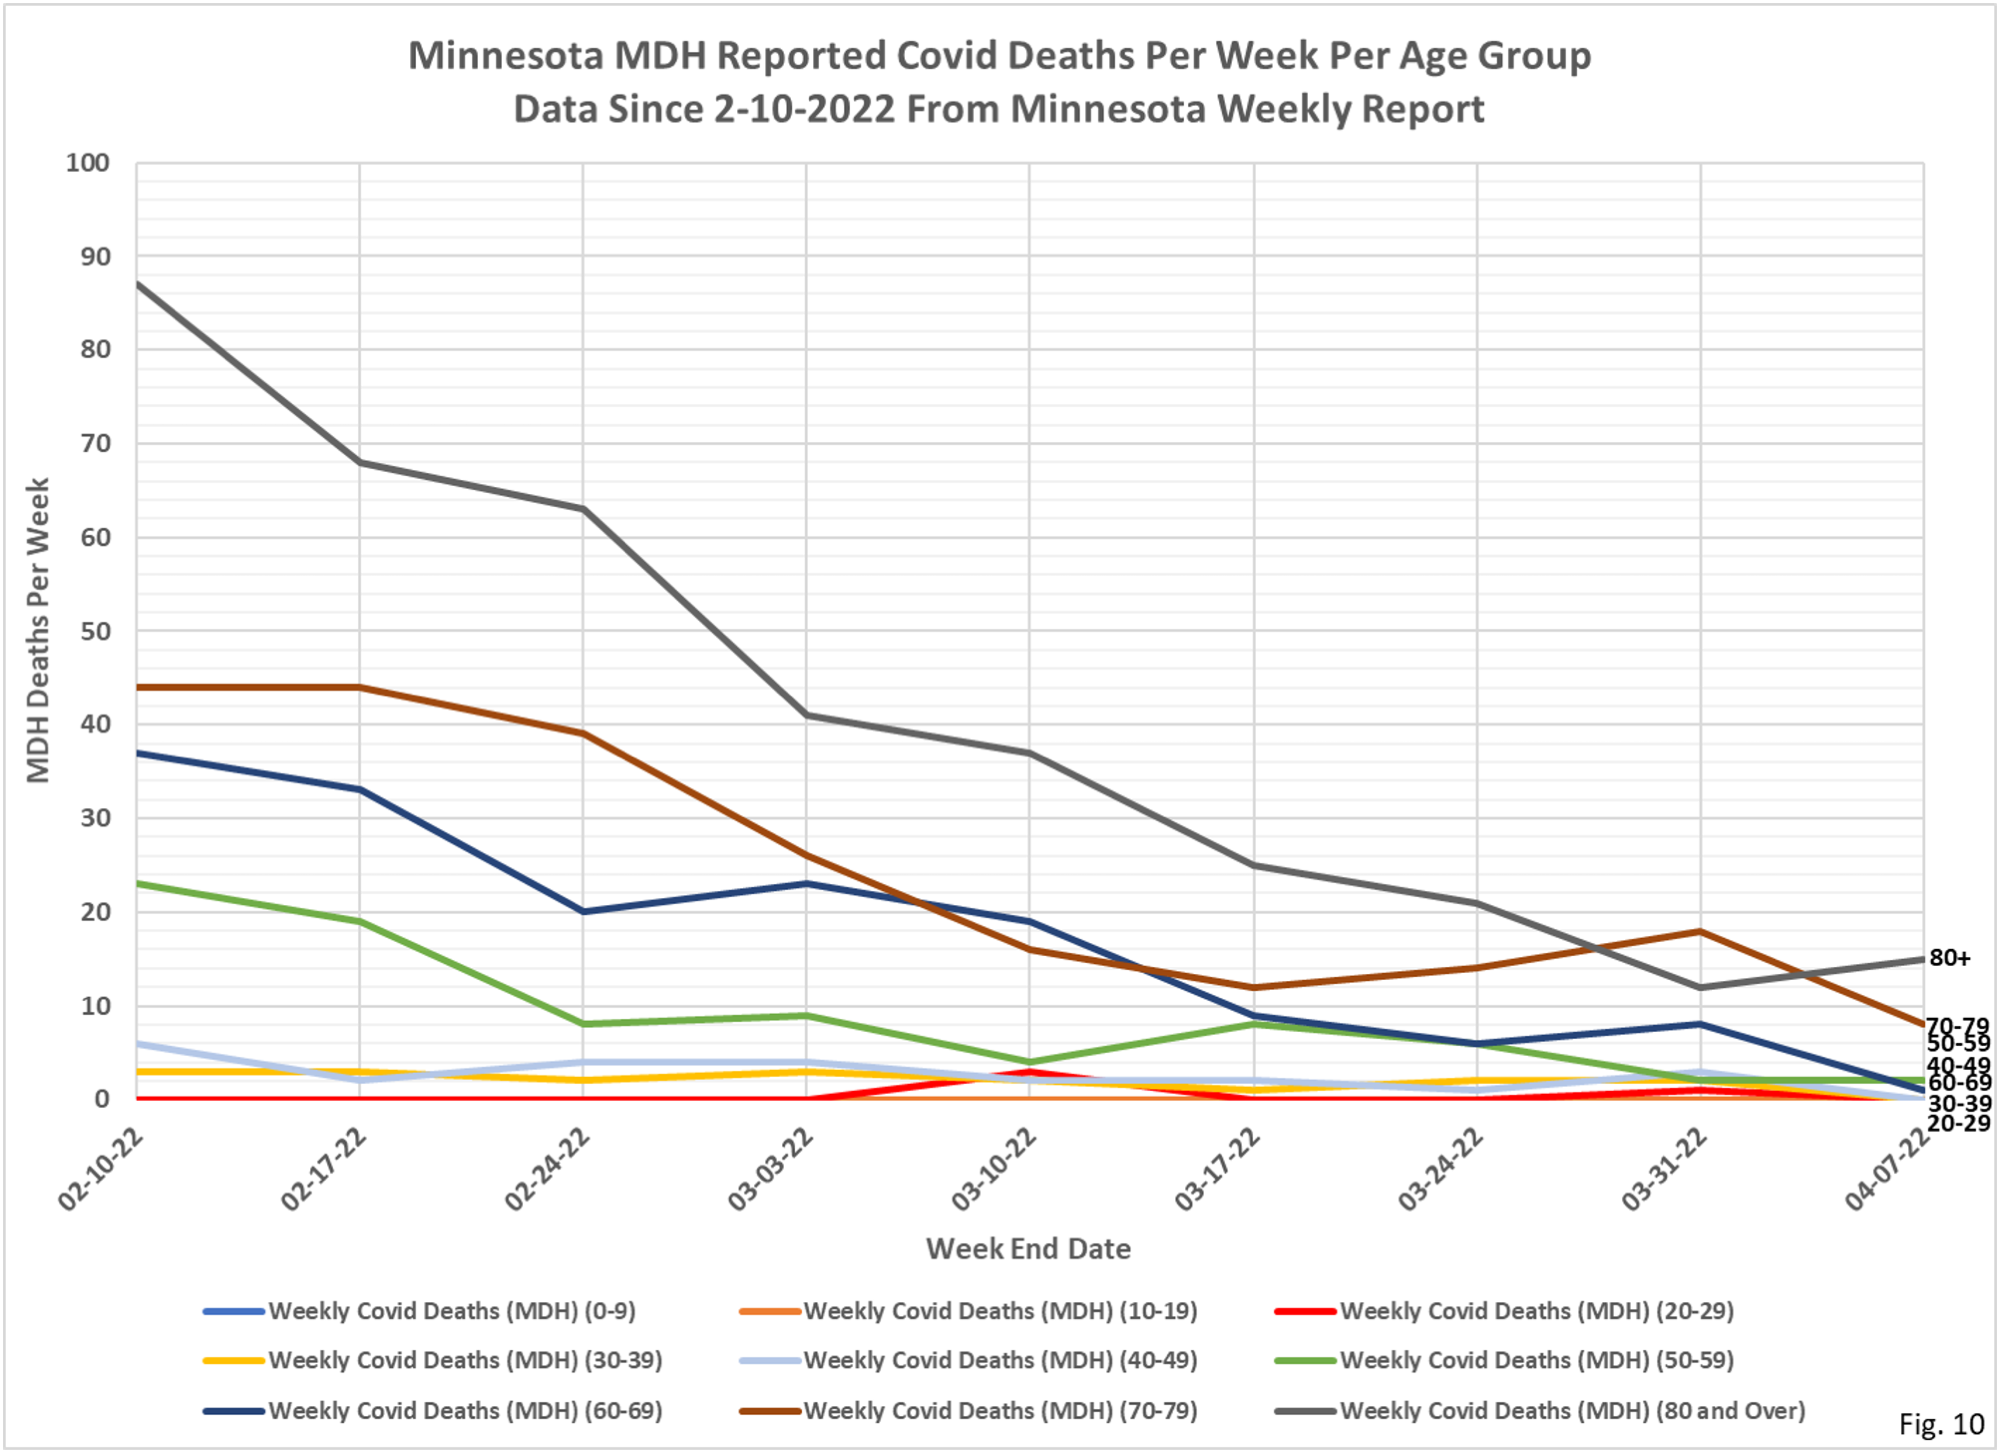
- Fig. 9 and 10: Covid Deaths Per Week. Total reported Covid deaths for the week were 26 a decrease of 20 from the 46 reported deaths last week
Data Sources:
1. The data for the charts on testing, hospital admissions, and deaths comes from the Minnesota Weekly Report (available here: https://www.health.state.mn.us/diseases/coronavirus/stats/index.html). The data in the Weekly Report is presented as cumulative totals for each data type each week. I am taking weekly differences and assembling the data into charts. This data is by date of report, meaning the charts are documenting new events reported this week, even though the underlying event occurred sometime in the past. The data is provided for 5 year age groups, and I am assembling into 10 year age groups to make the charts more readable.
2. The data for the Covid cases per week come from a data file published along with the Minnesota Weekly Report, here: https://www.health.state.mn.us/diseases/coronavirus/stats/index.html#wagscd1 This data is published by date of specimen collection, rather than by date of report as the other data is. The data is provided as cases per week in 5 year age groups. I am compiling the data into 10 year age groups in order for the charts to be more readable. This data is updated by date of specimen collection, so it is possible that past week’s data will be updated.
