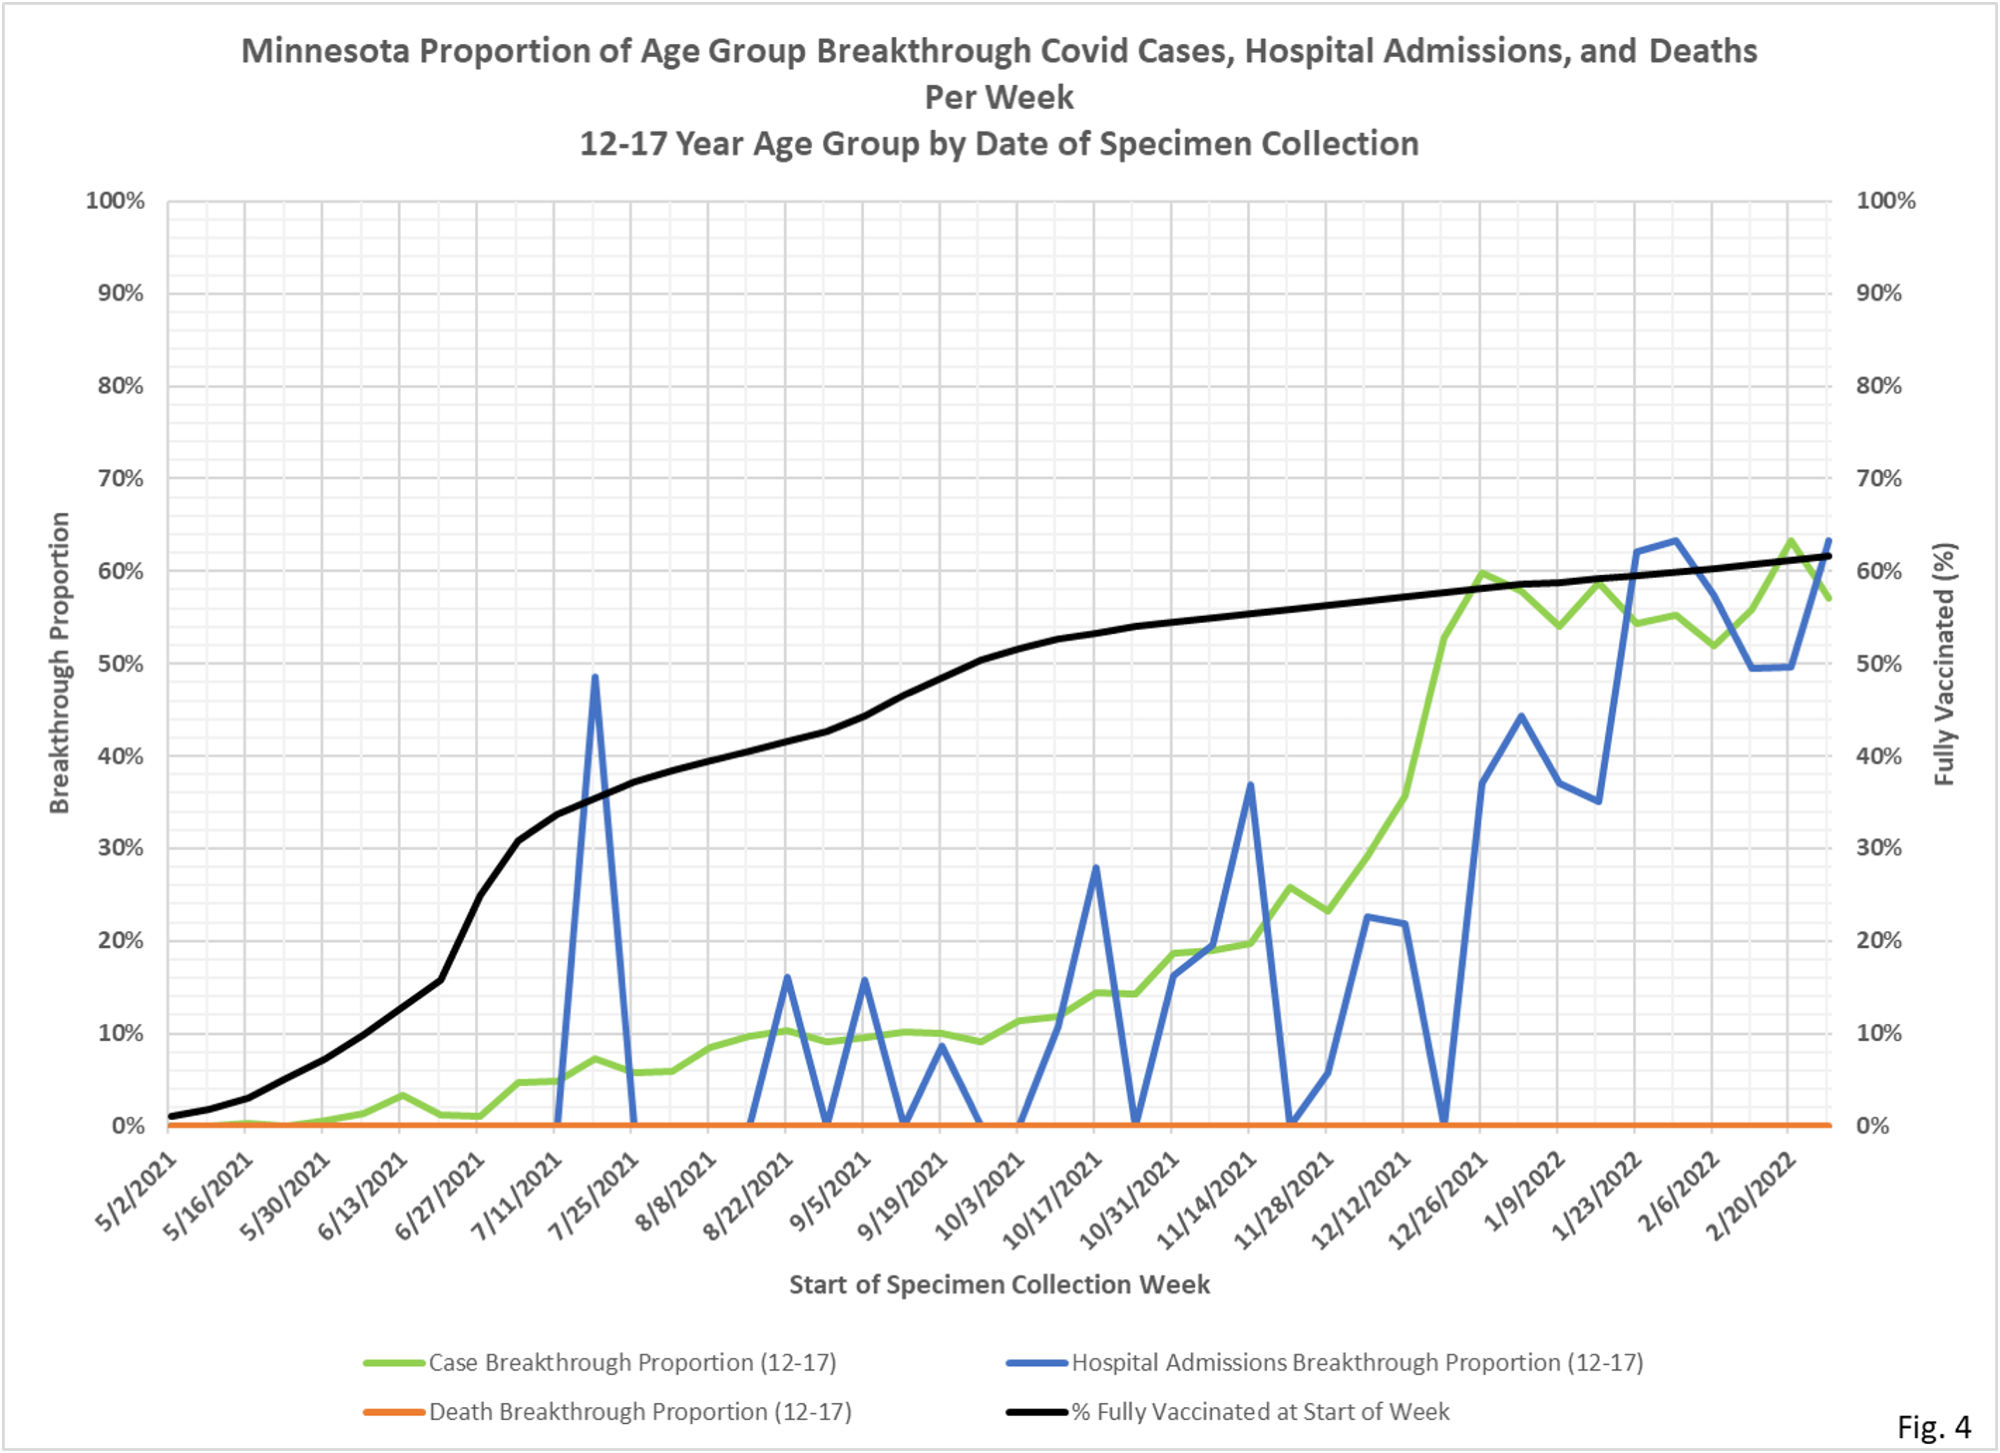
An innovation this week is to show you percent fully vaxed, although this does not yet include boosters, due to DOH data deficiencies. The value of that is to show the closeness of the proportion lines and the percent boosted. If those lines are far away, it suggest greater vaccine effectiveness. If they are closer together, it suggests lesser vaccine effectiveness. Look at the 12-17 age group, very low vaccine effectiveness now against cases or hosps. But there are a large number of incidental hosps in this age group. In the 18 to 49 group, we see again the very limited effectiveness against cases, but some effectiveness in regard to hosps and strong protection against death. In the 50-64 group, which is highly vaxed, there is also very limited effectiveness frankly against anything. And in the over 65 group, which is very highly vaxed and boosted, there is also very limited evidence for protection even against serious disease.
 Dave’s notes:
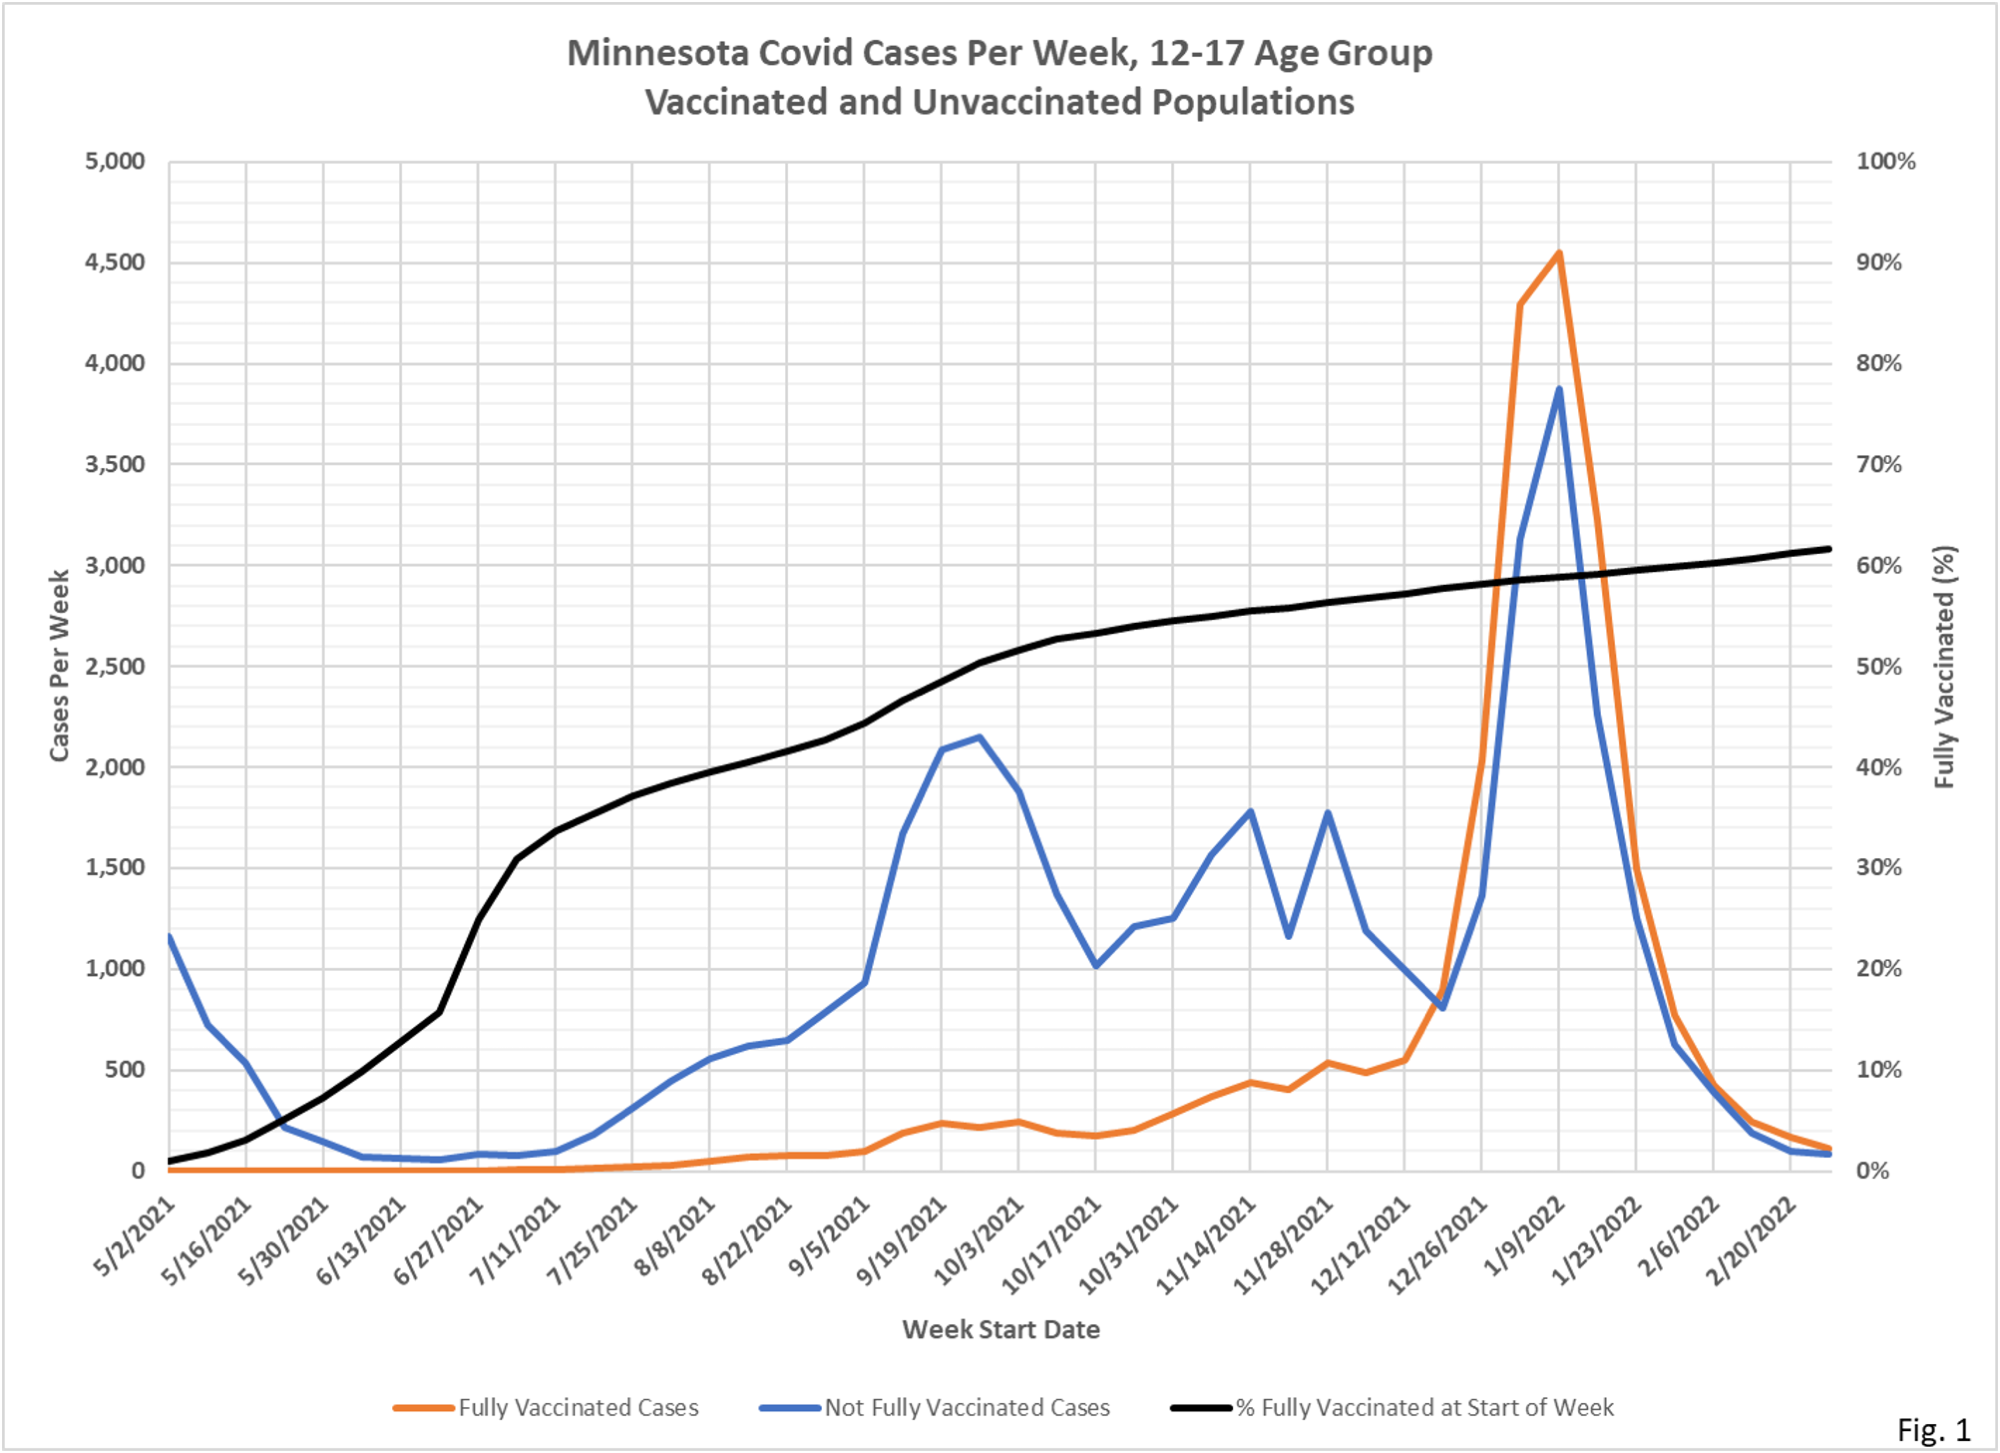
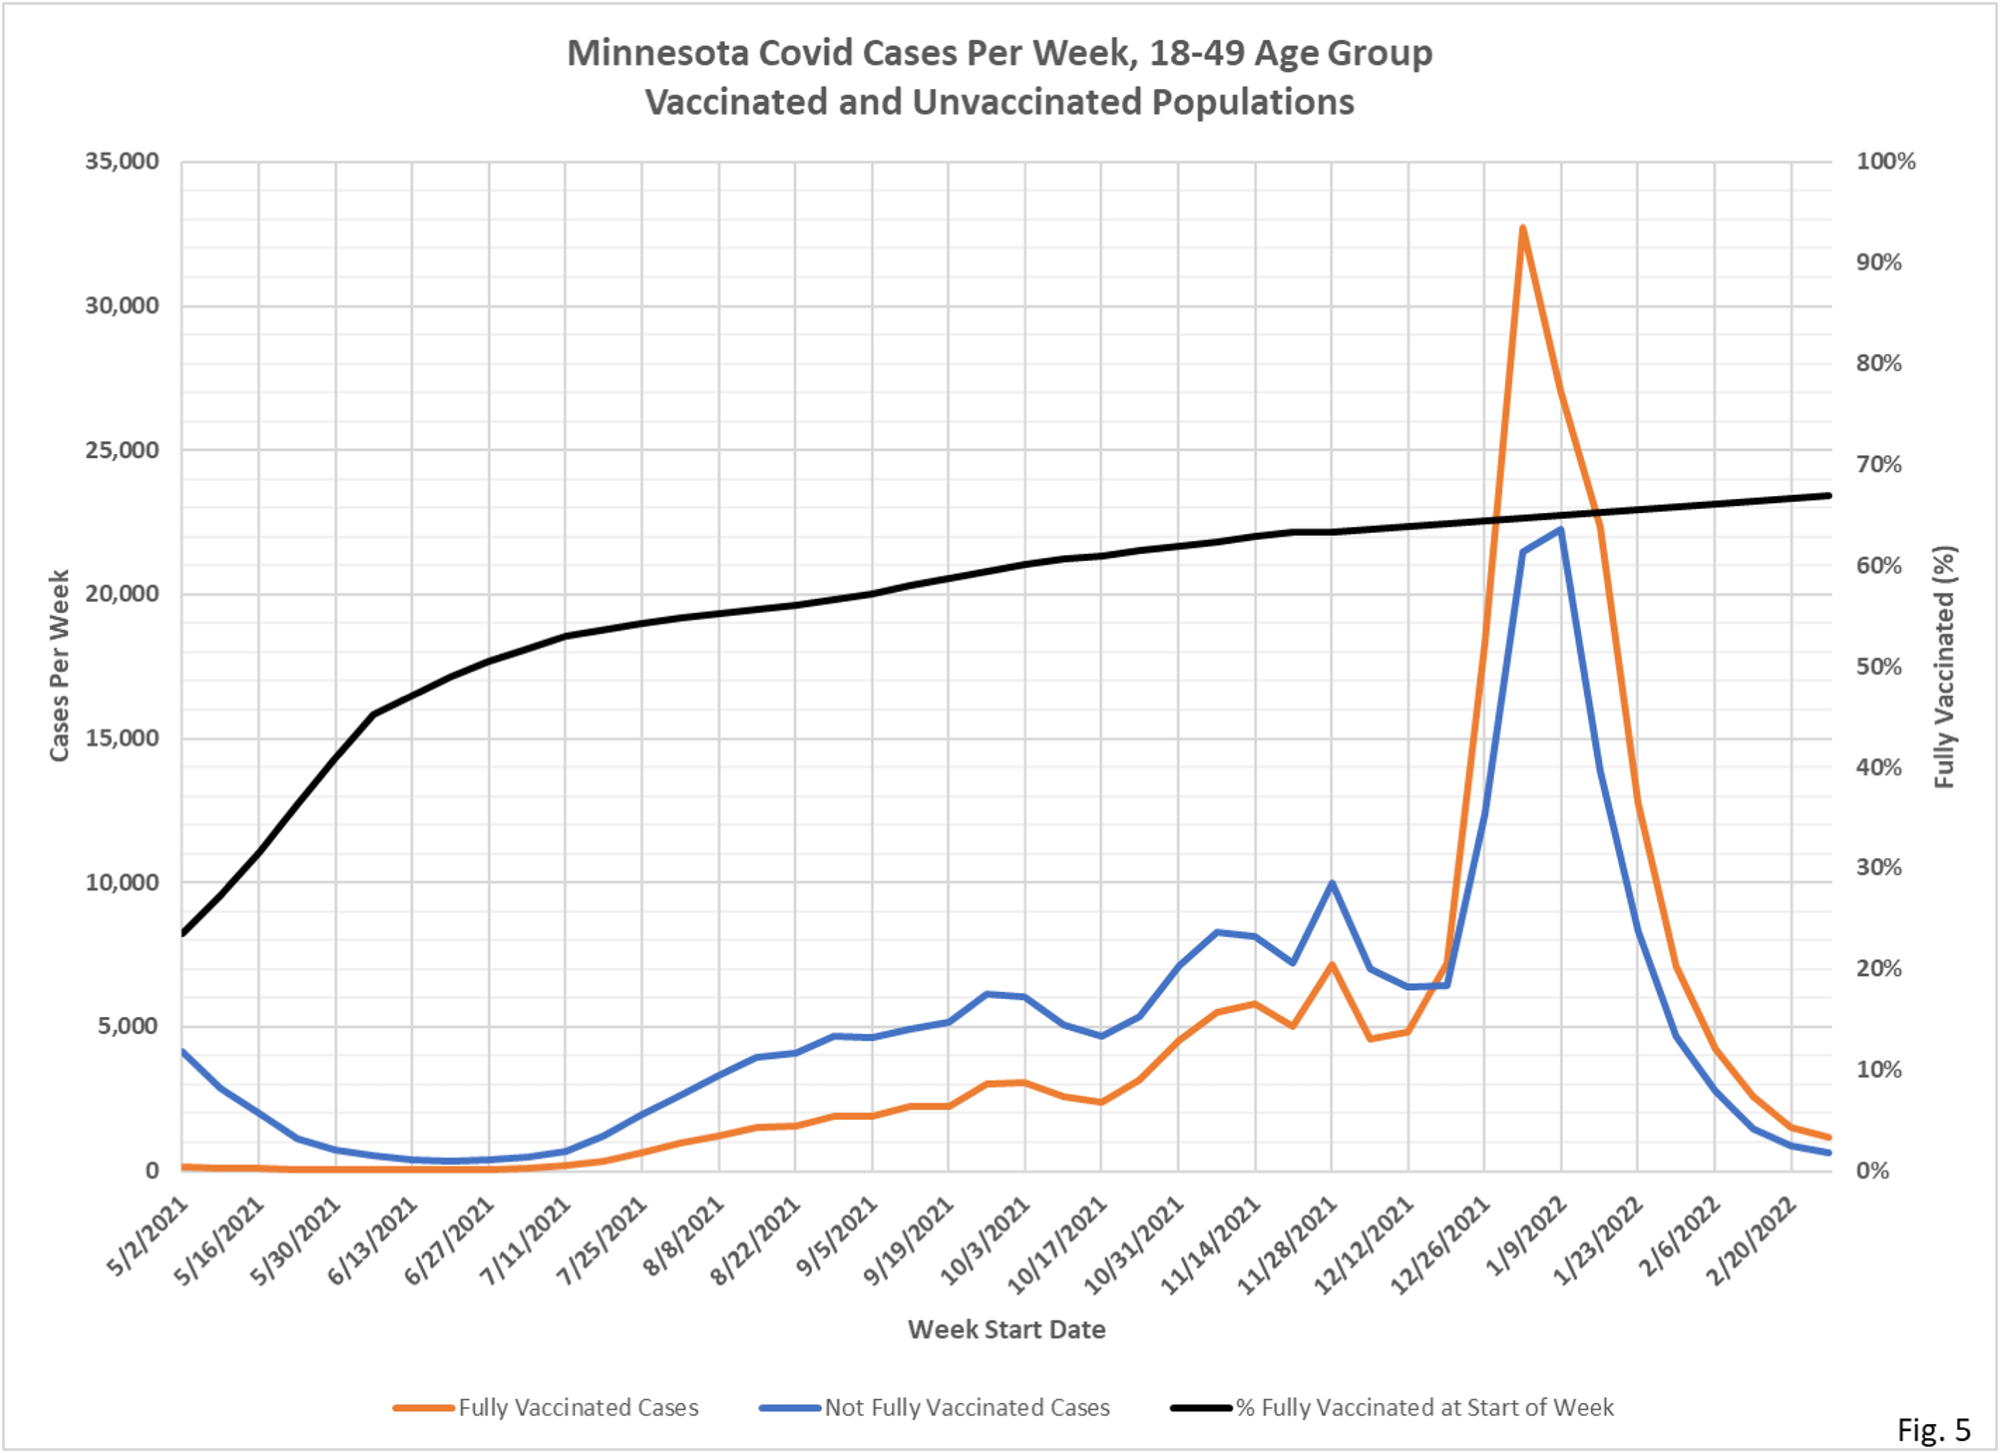
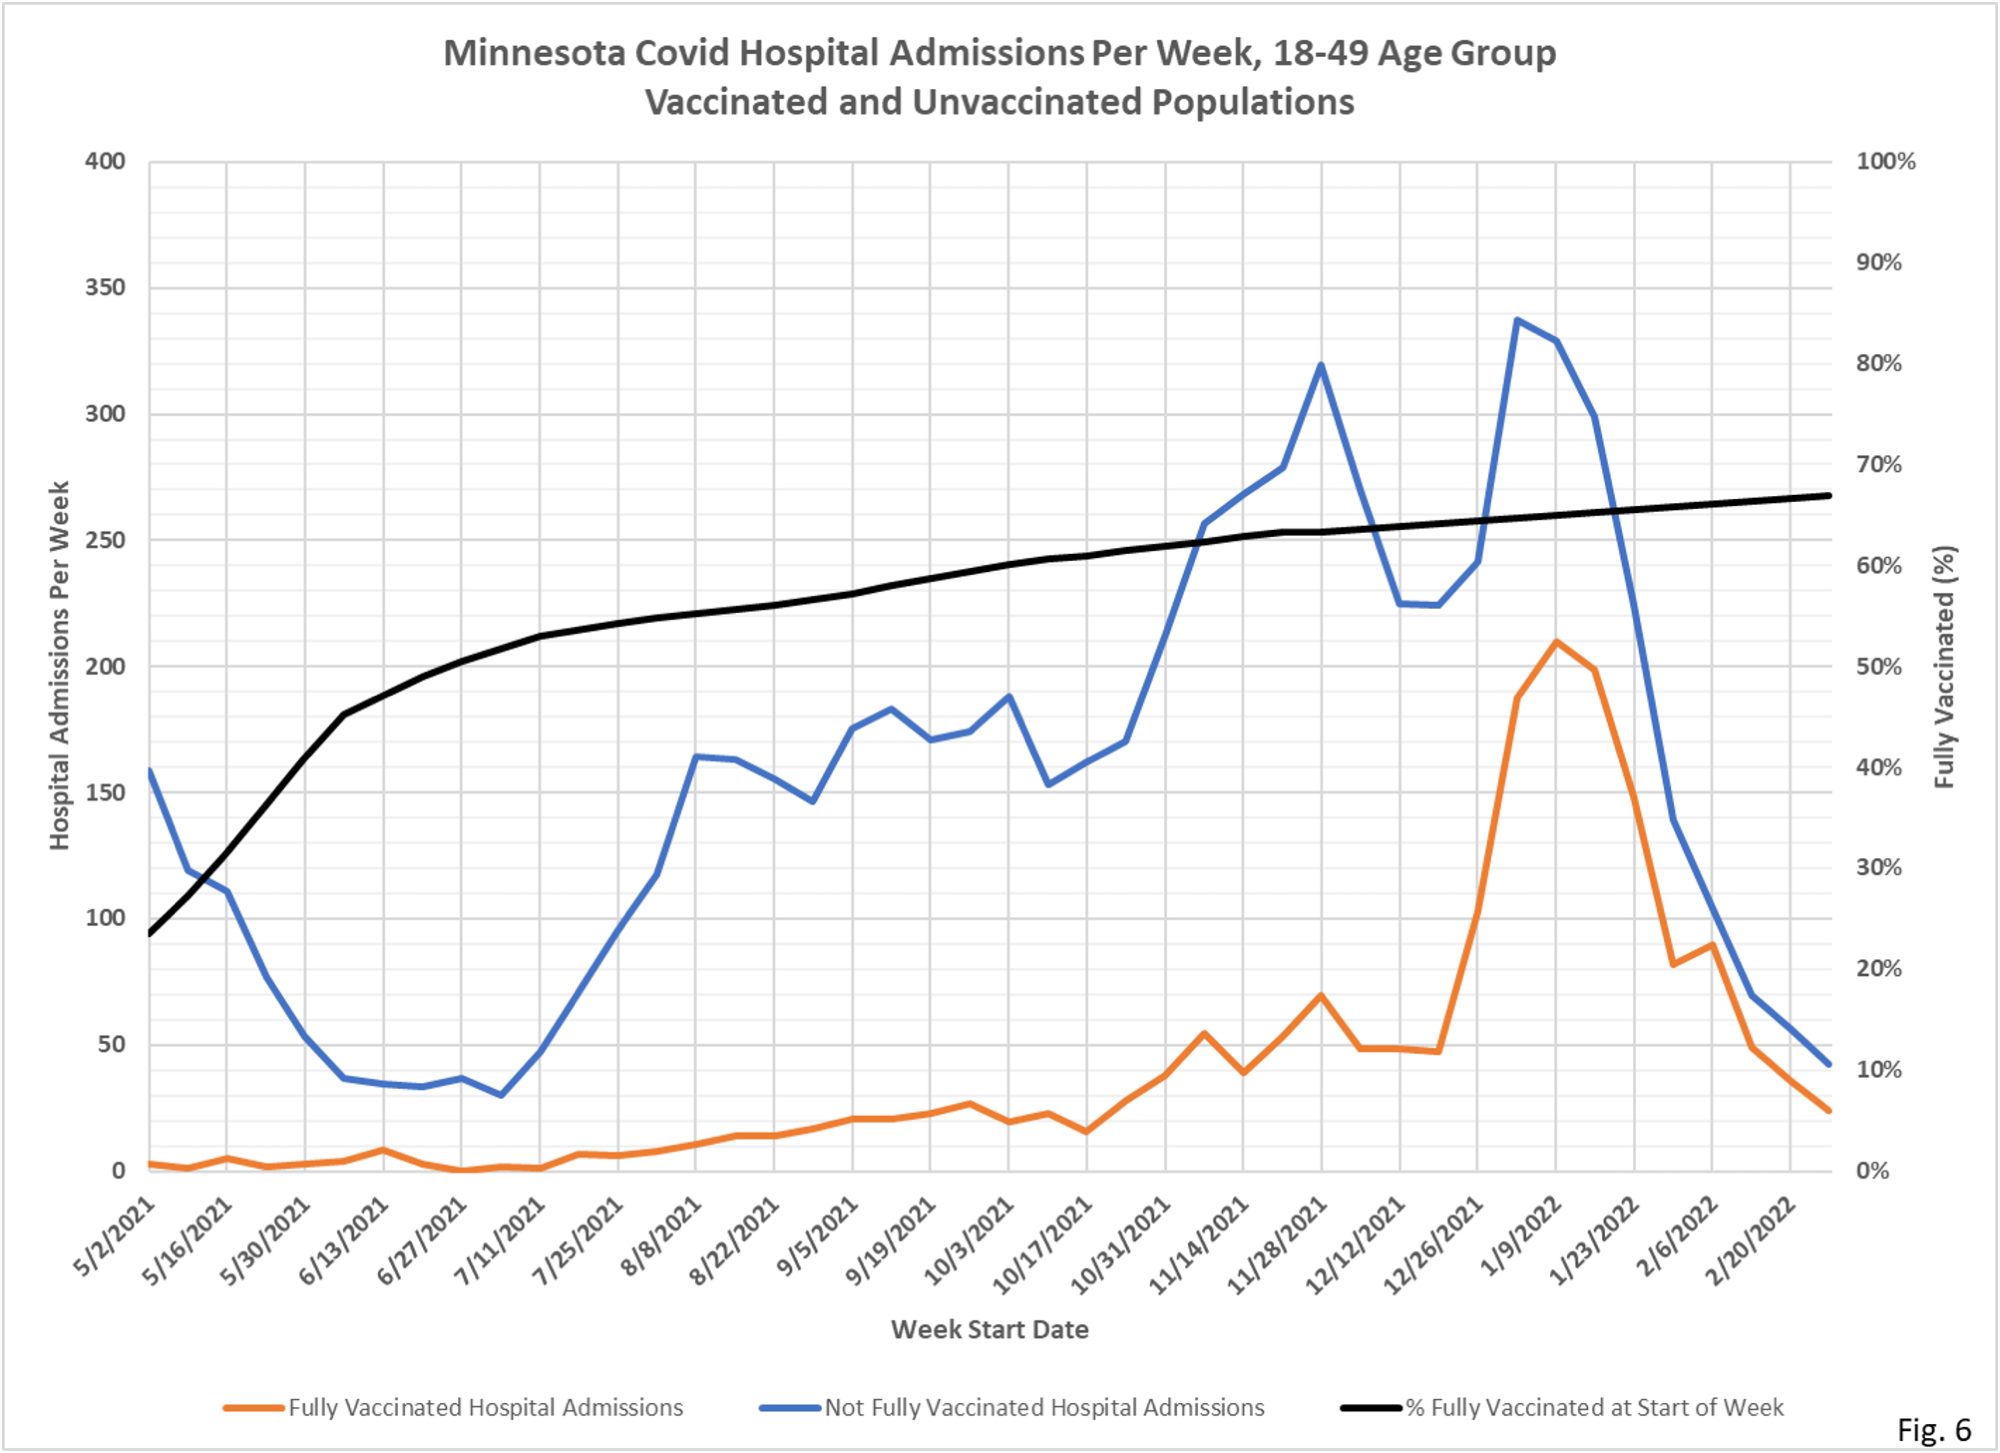
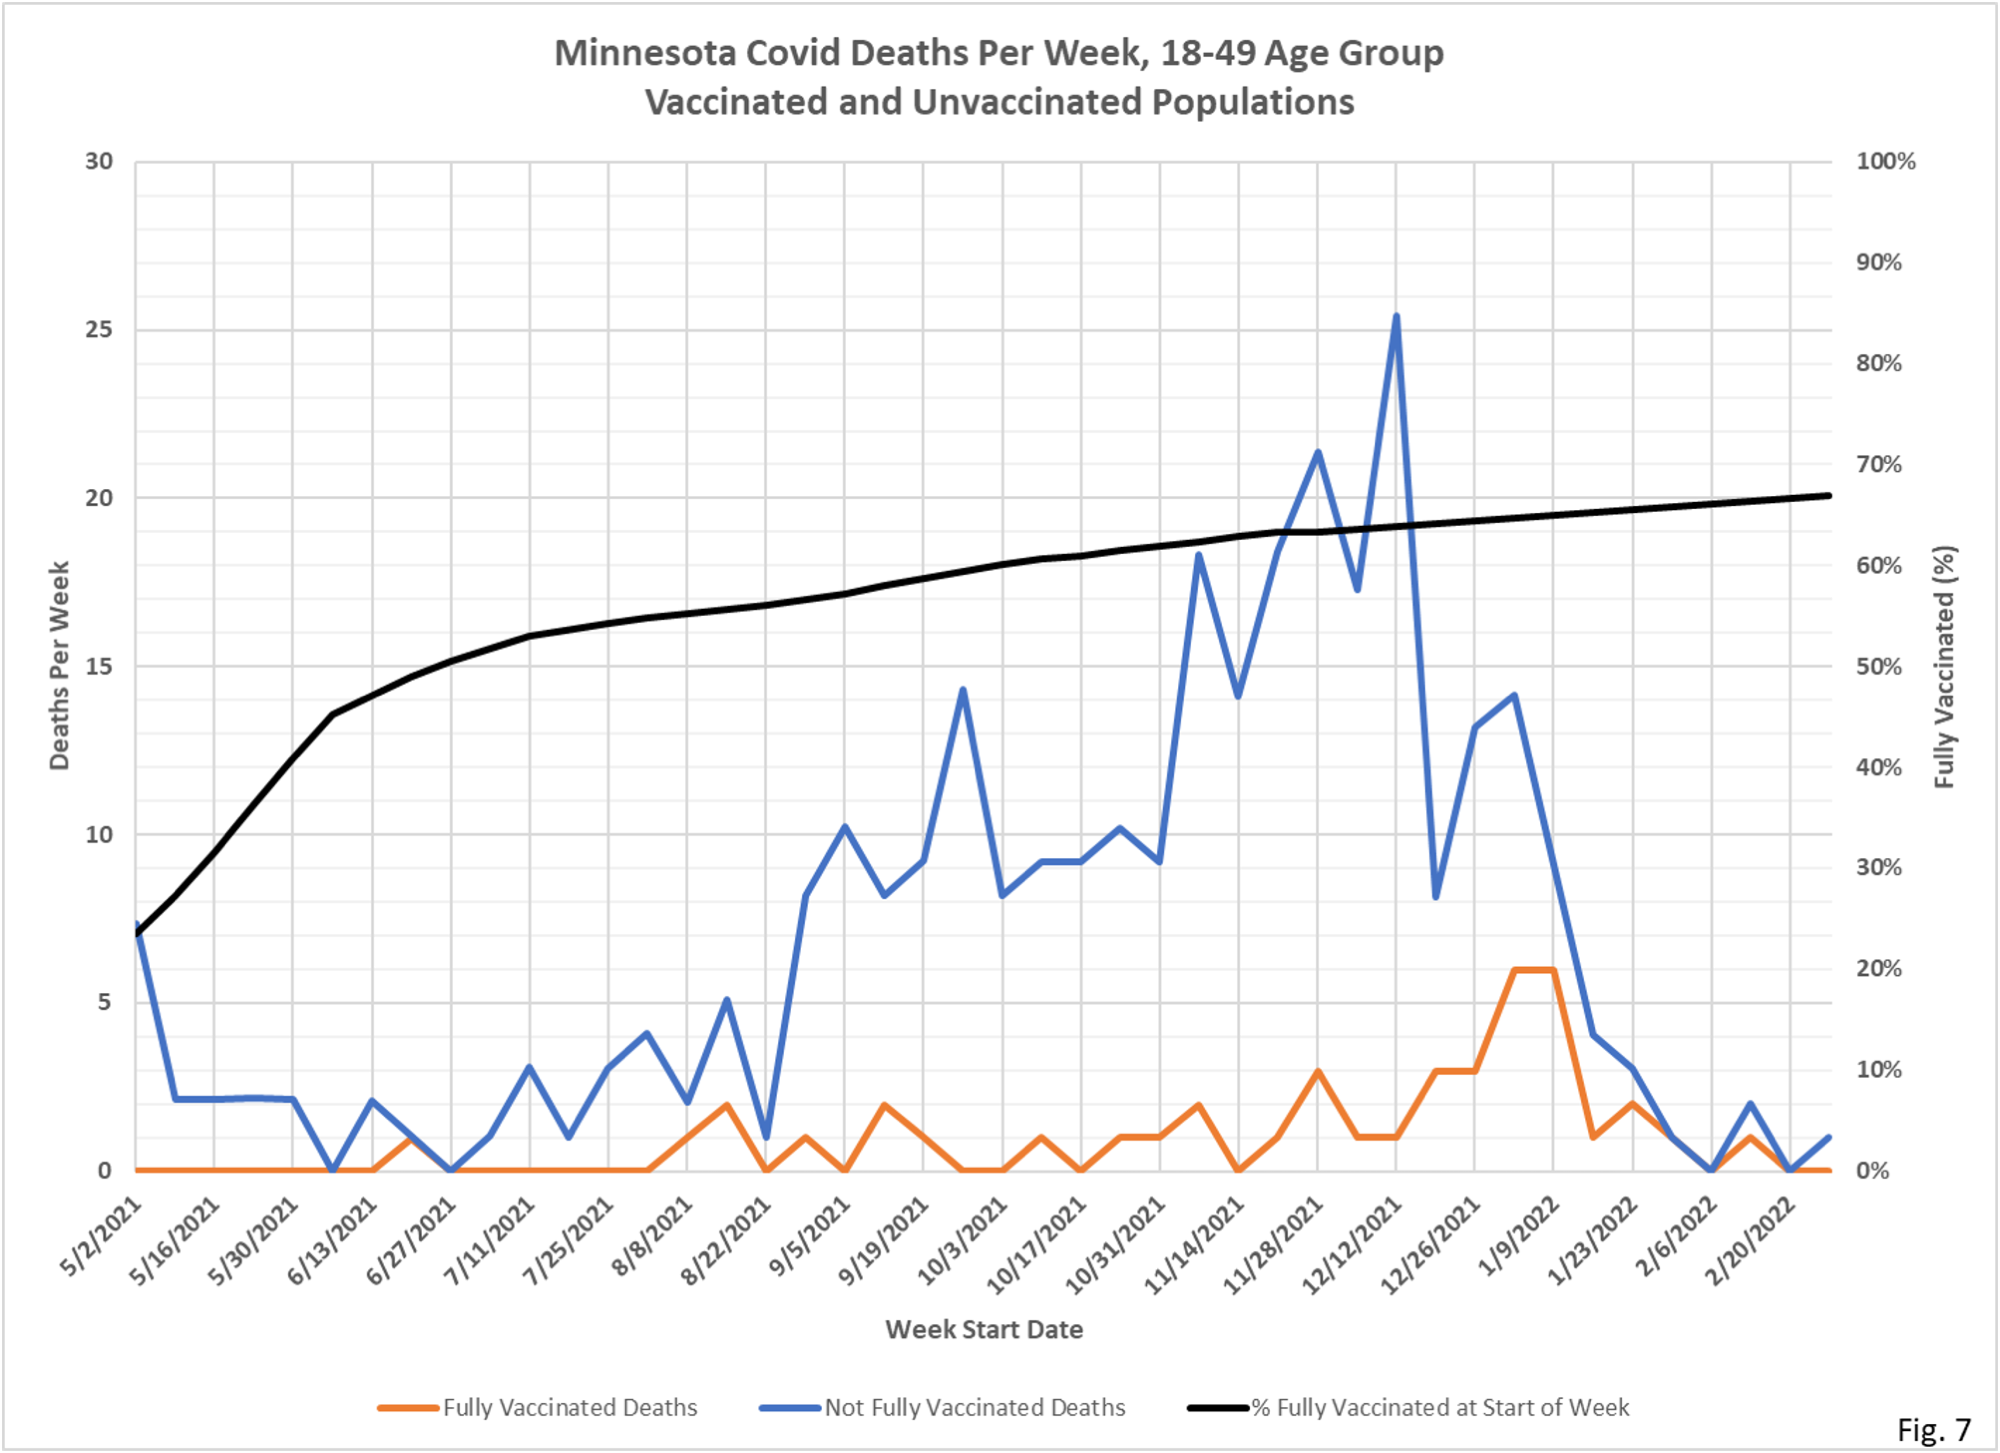
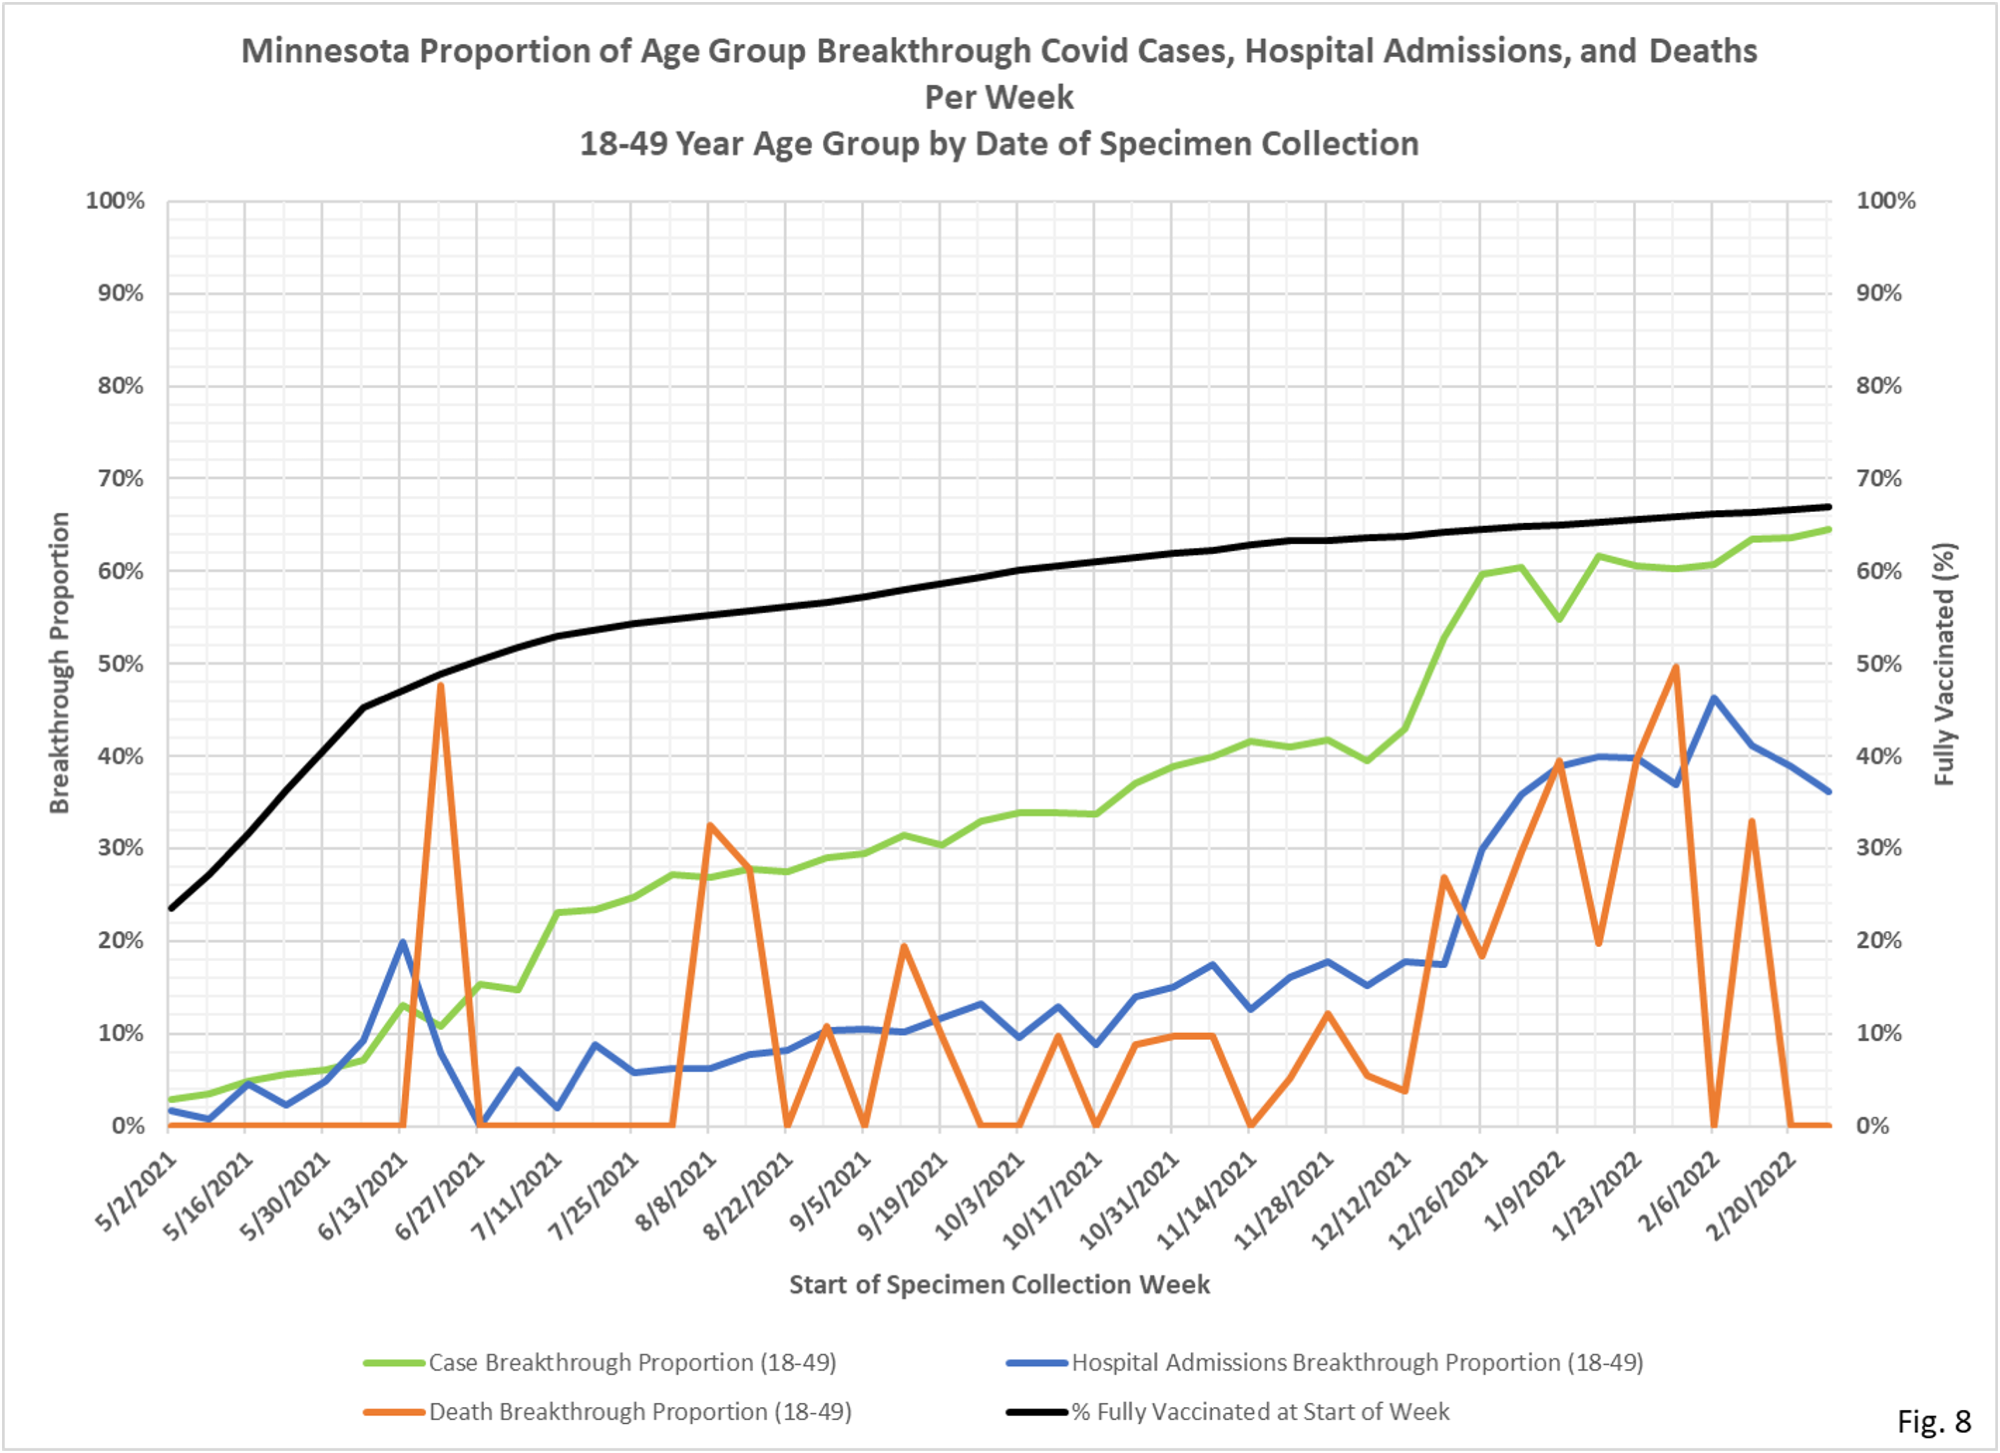
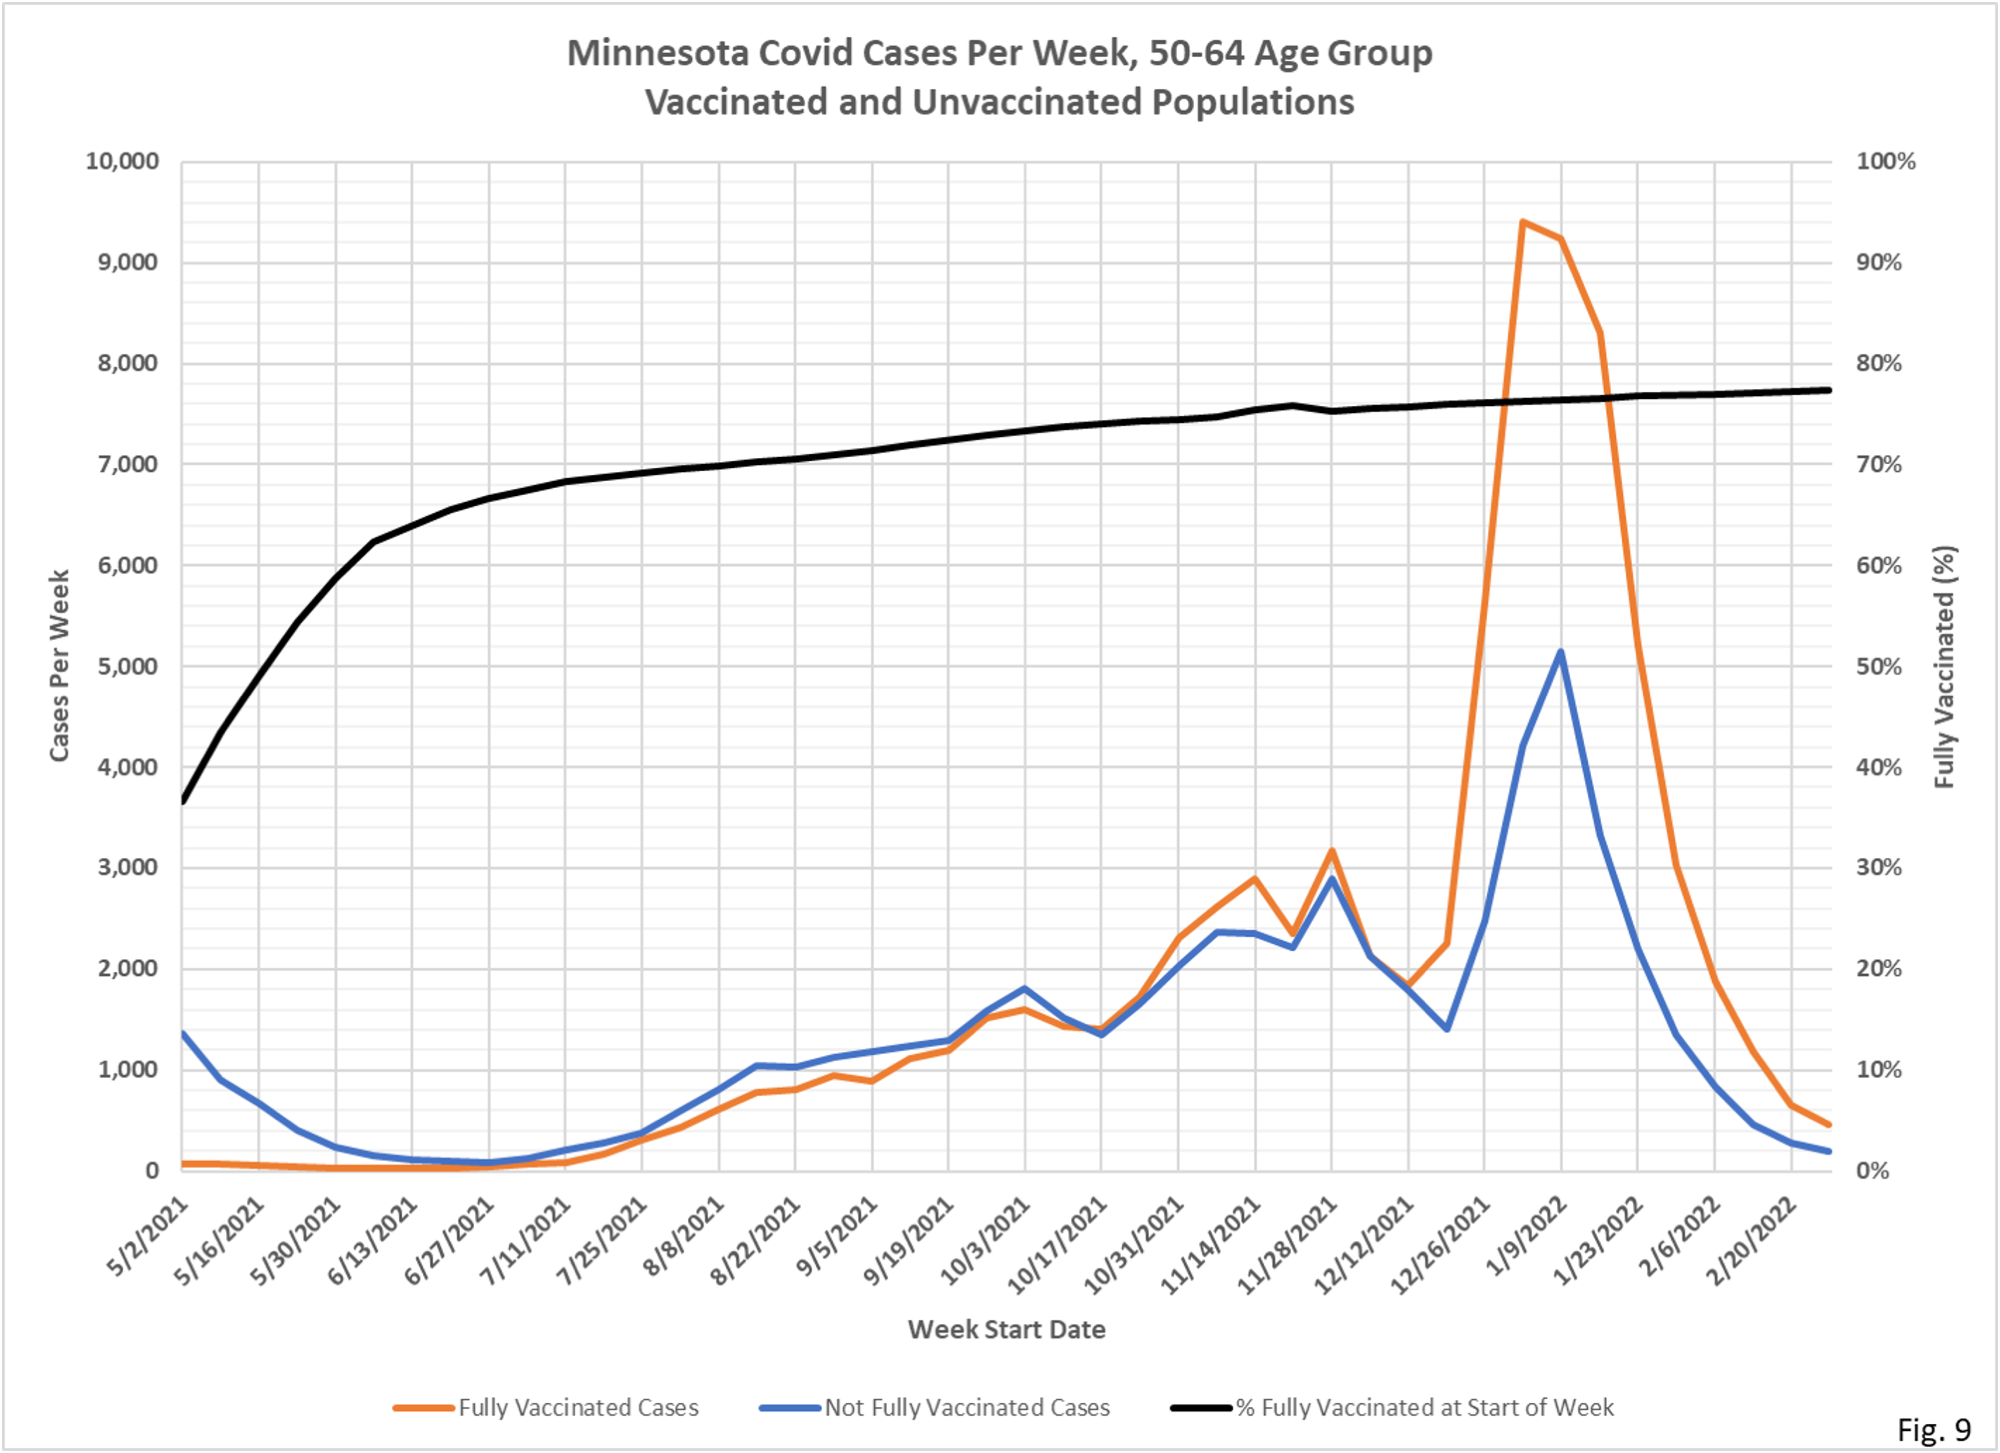
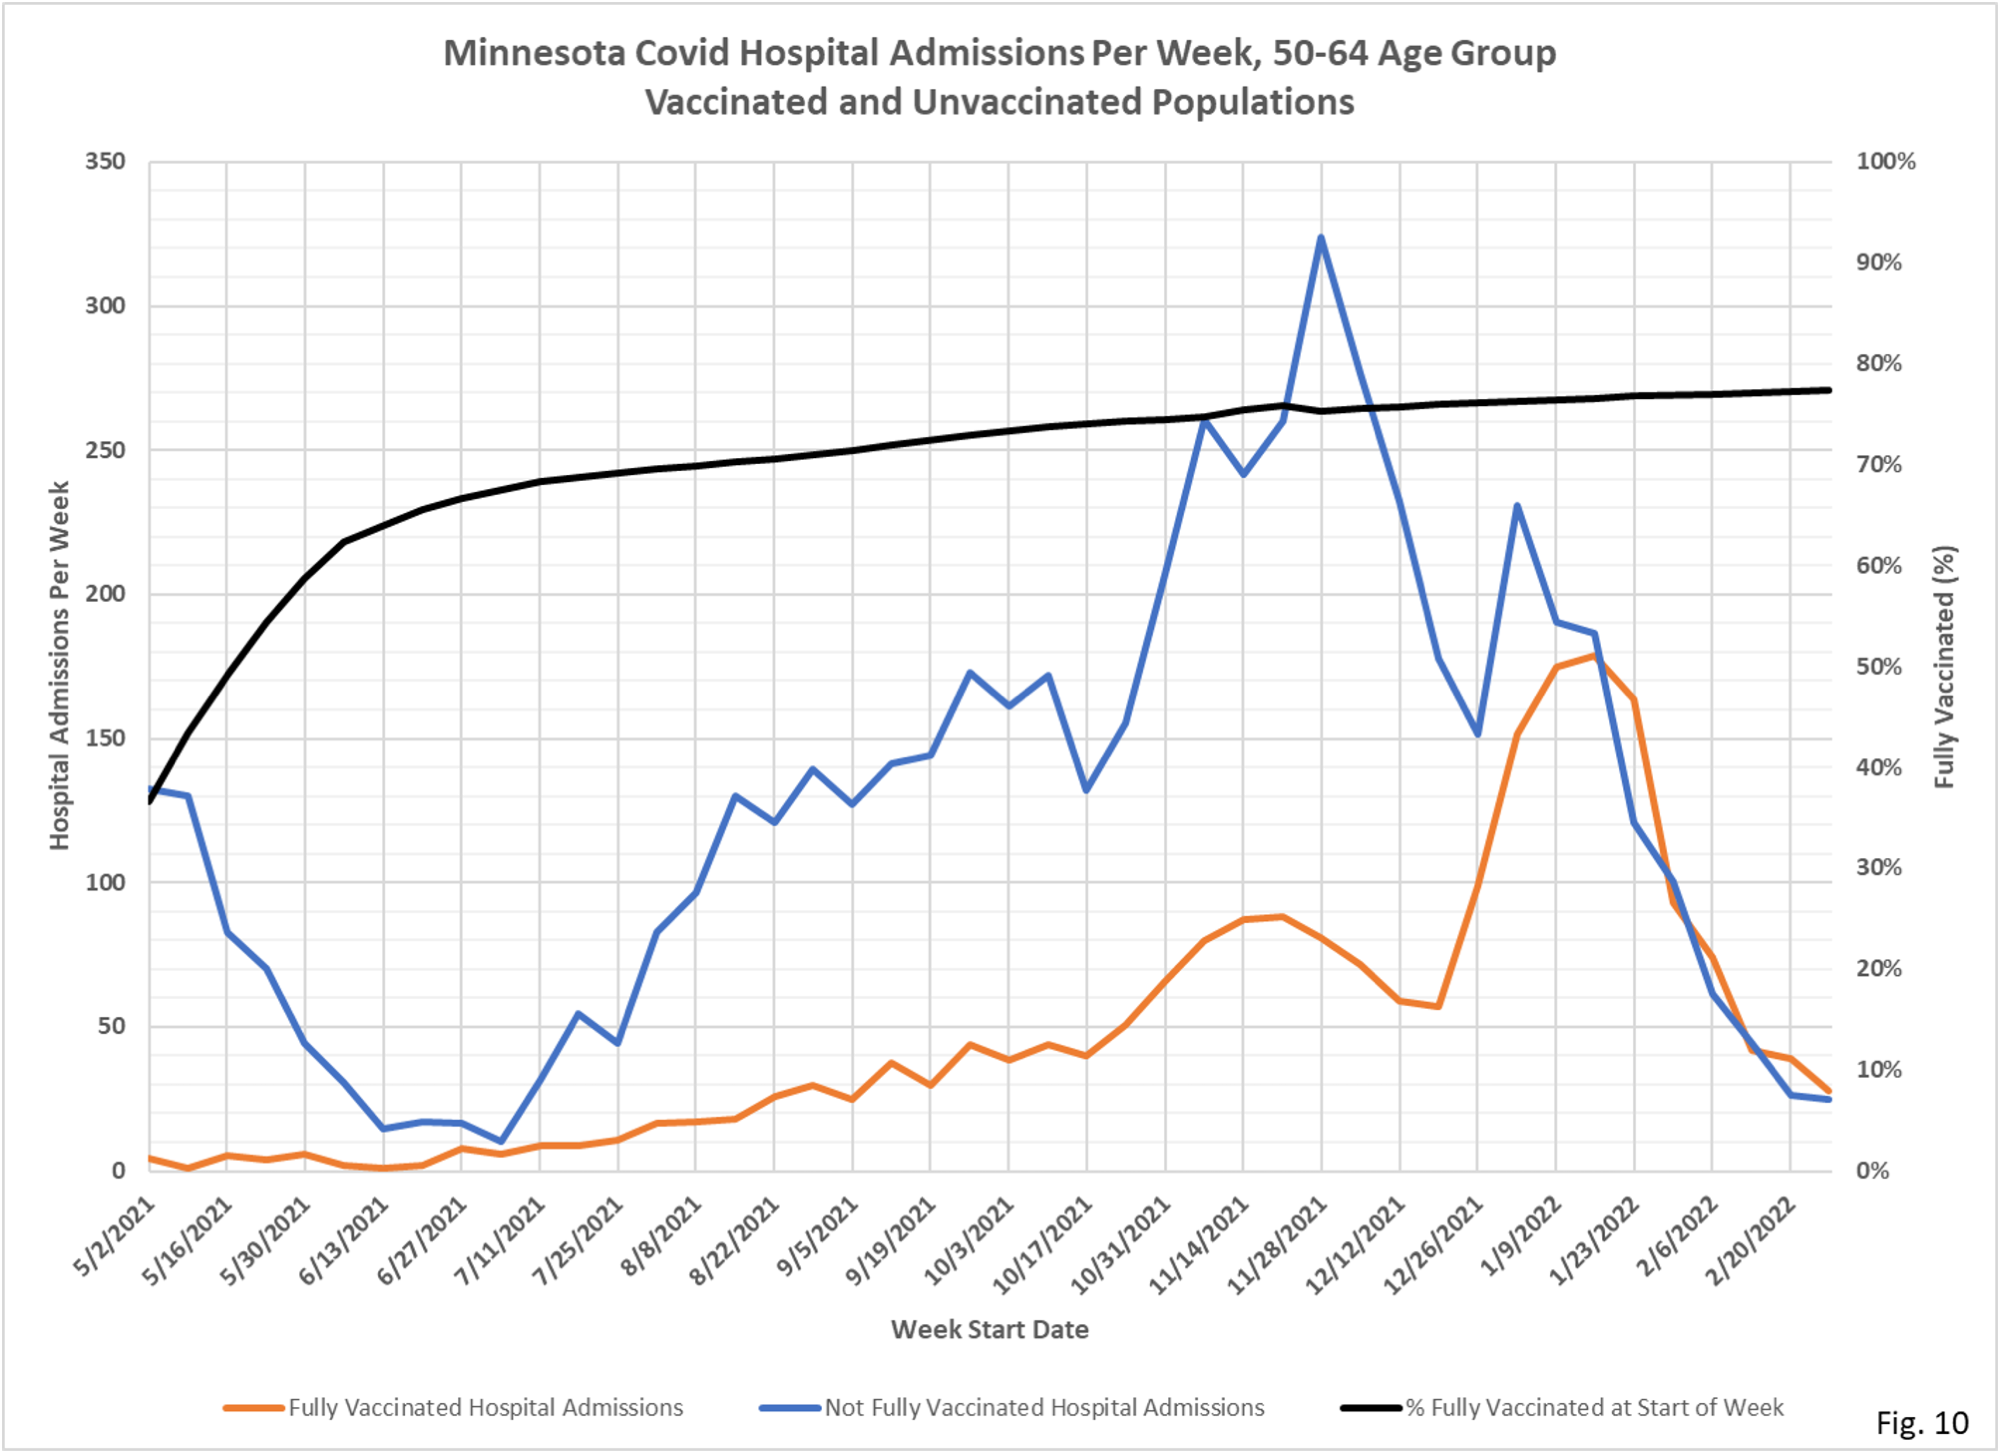
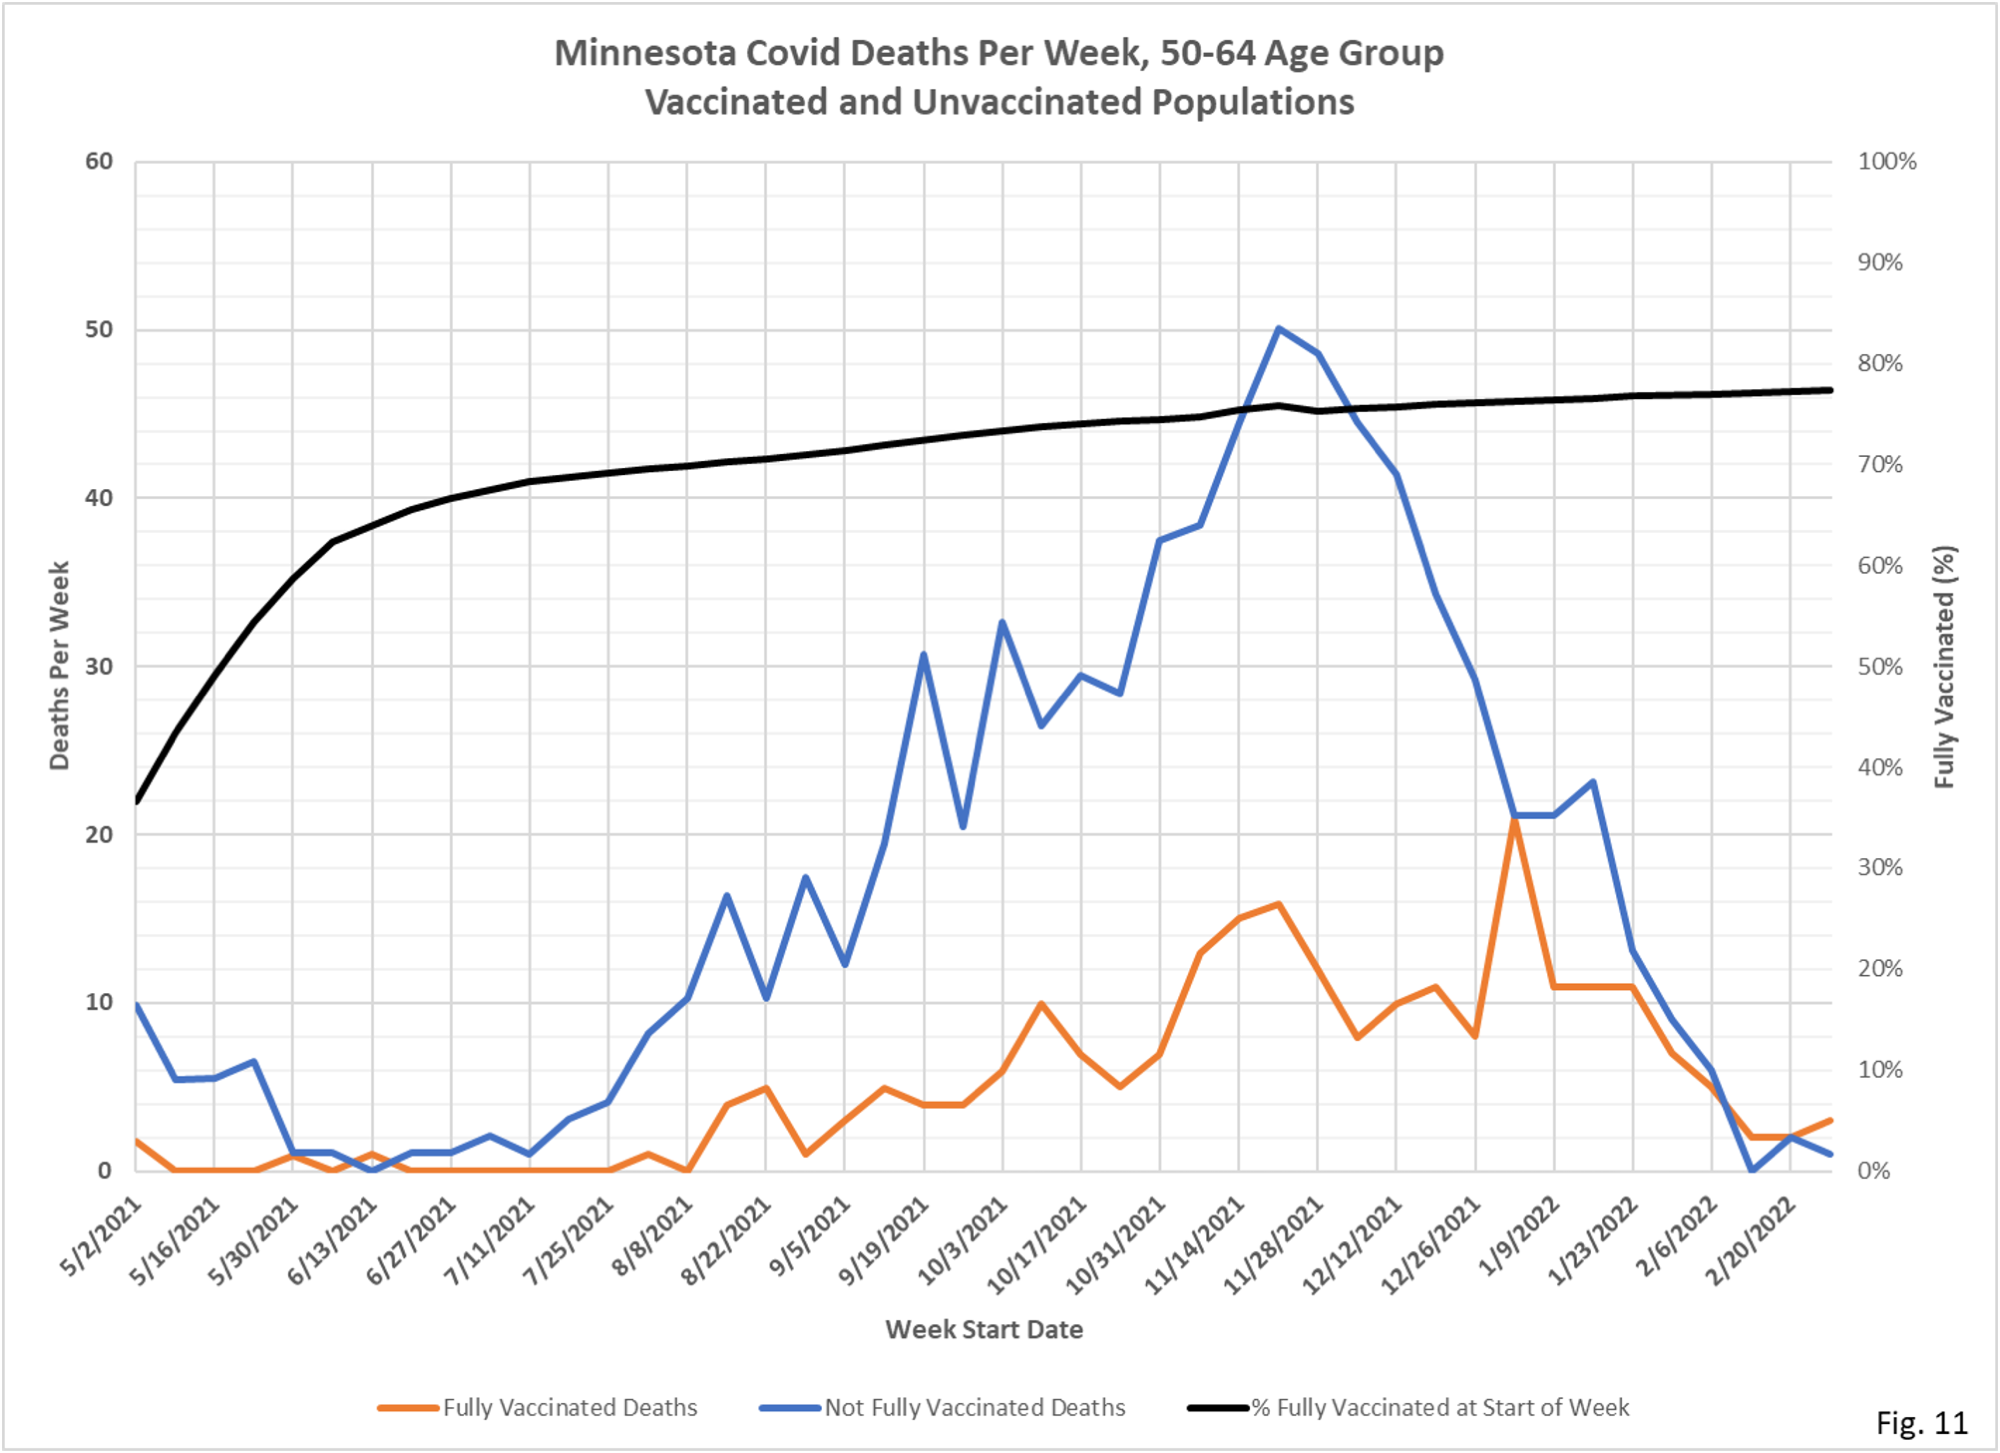
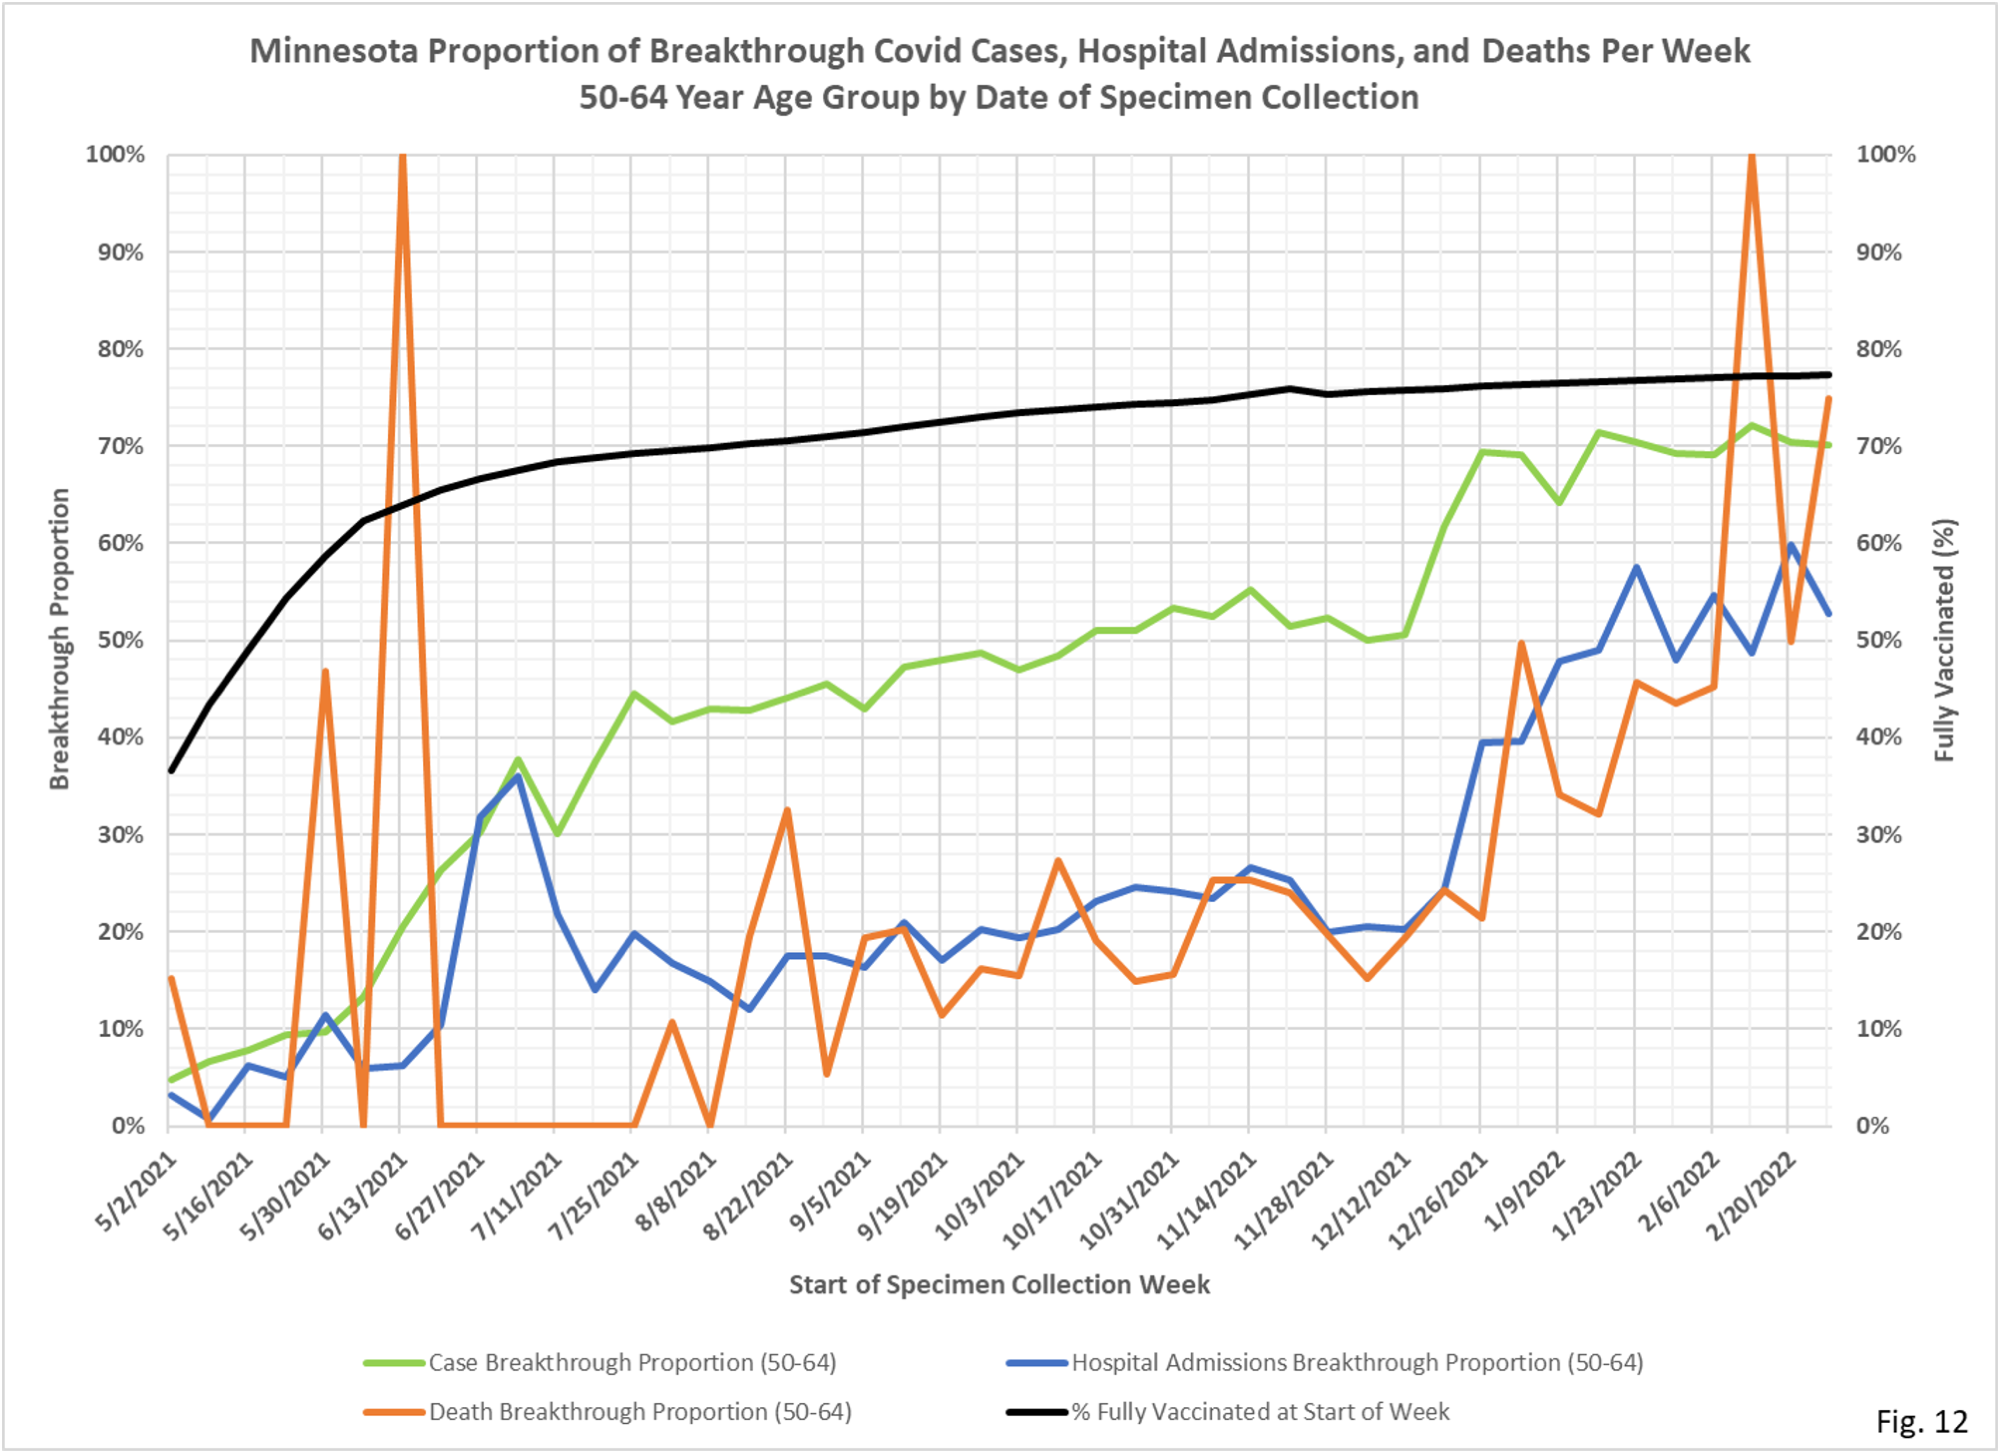
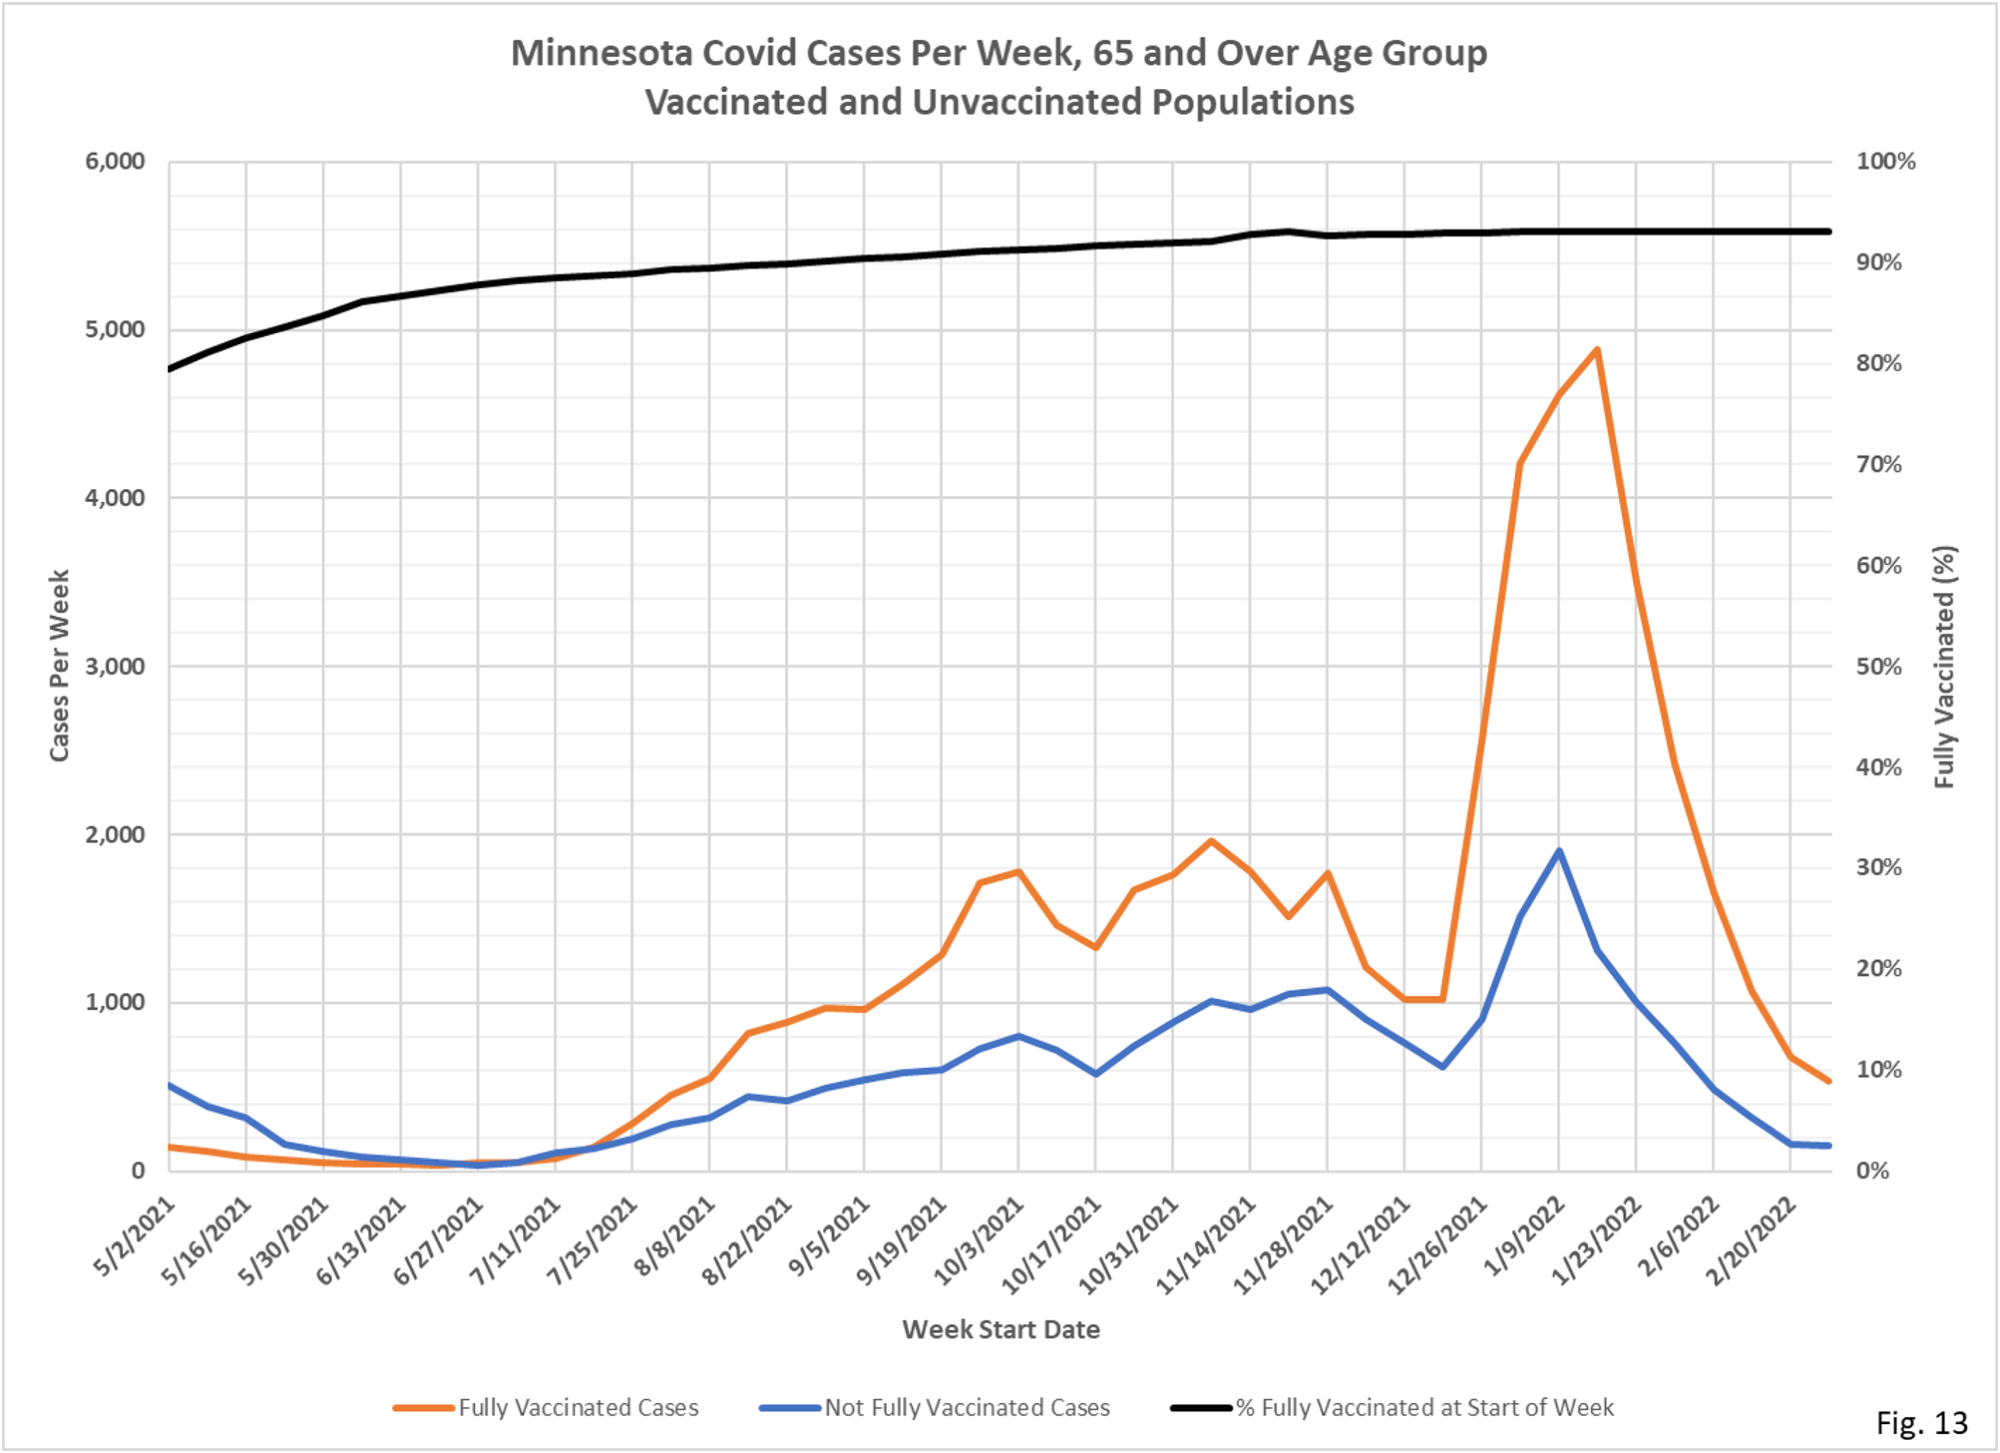
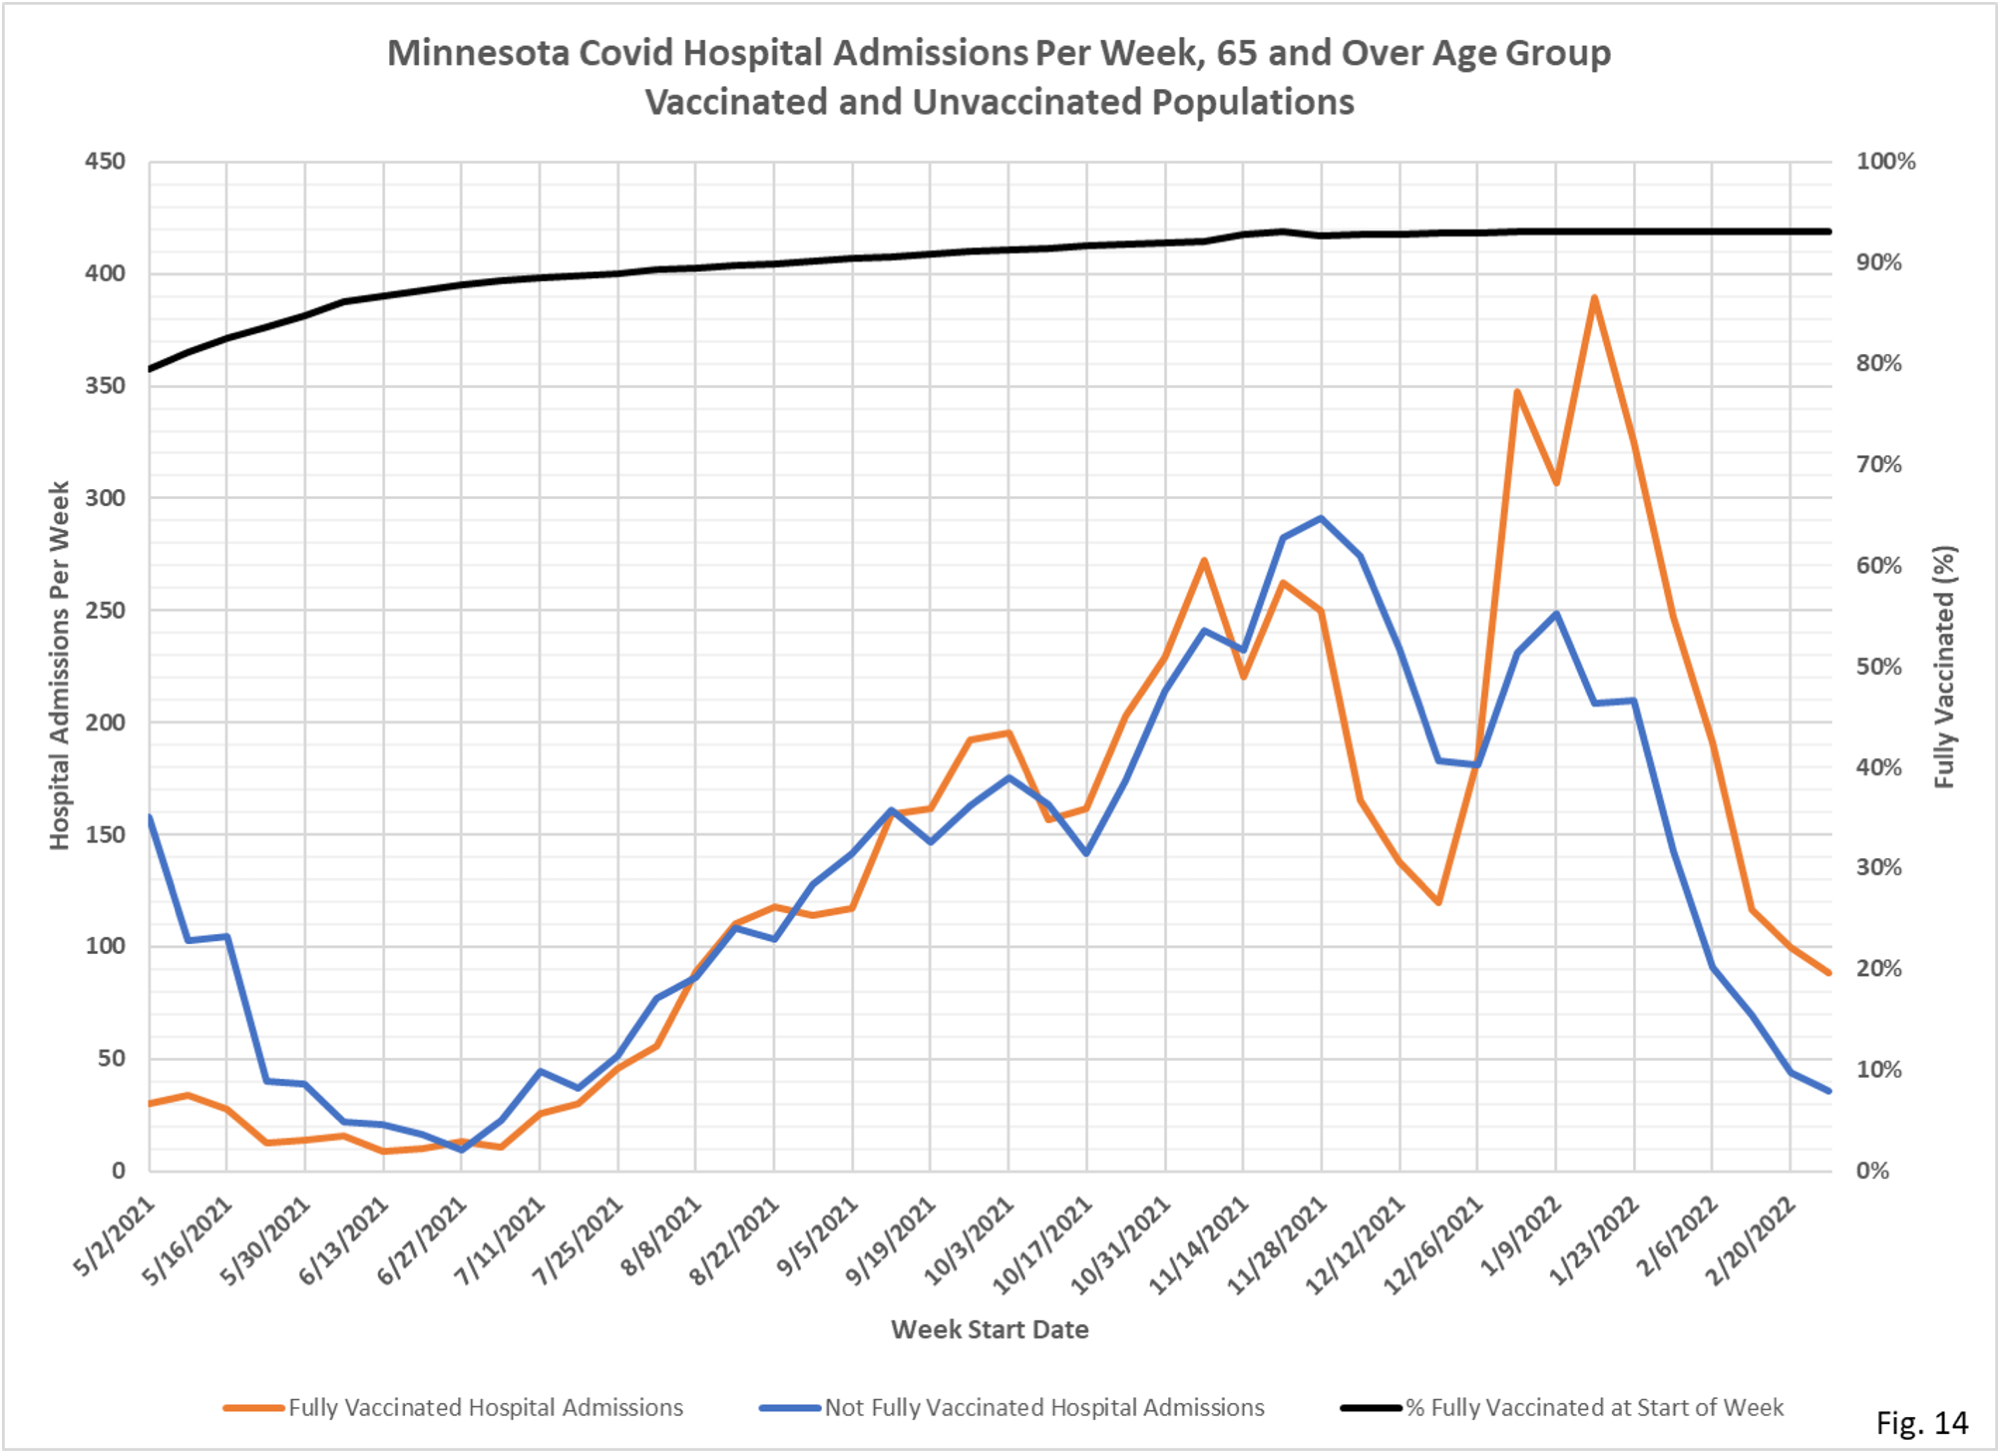
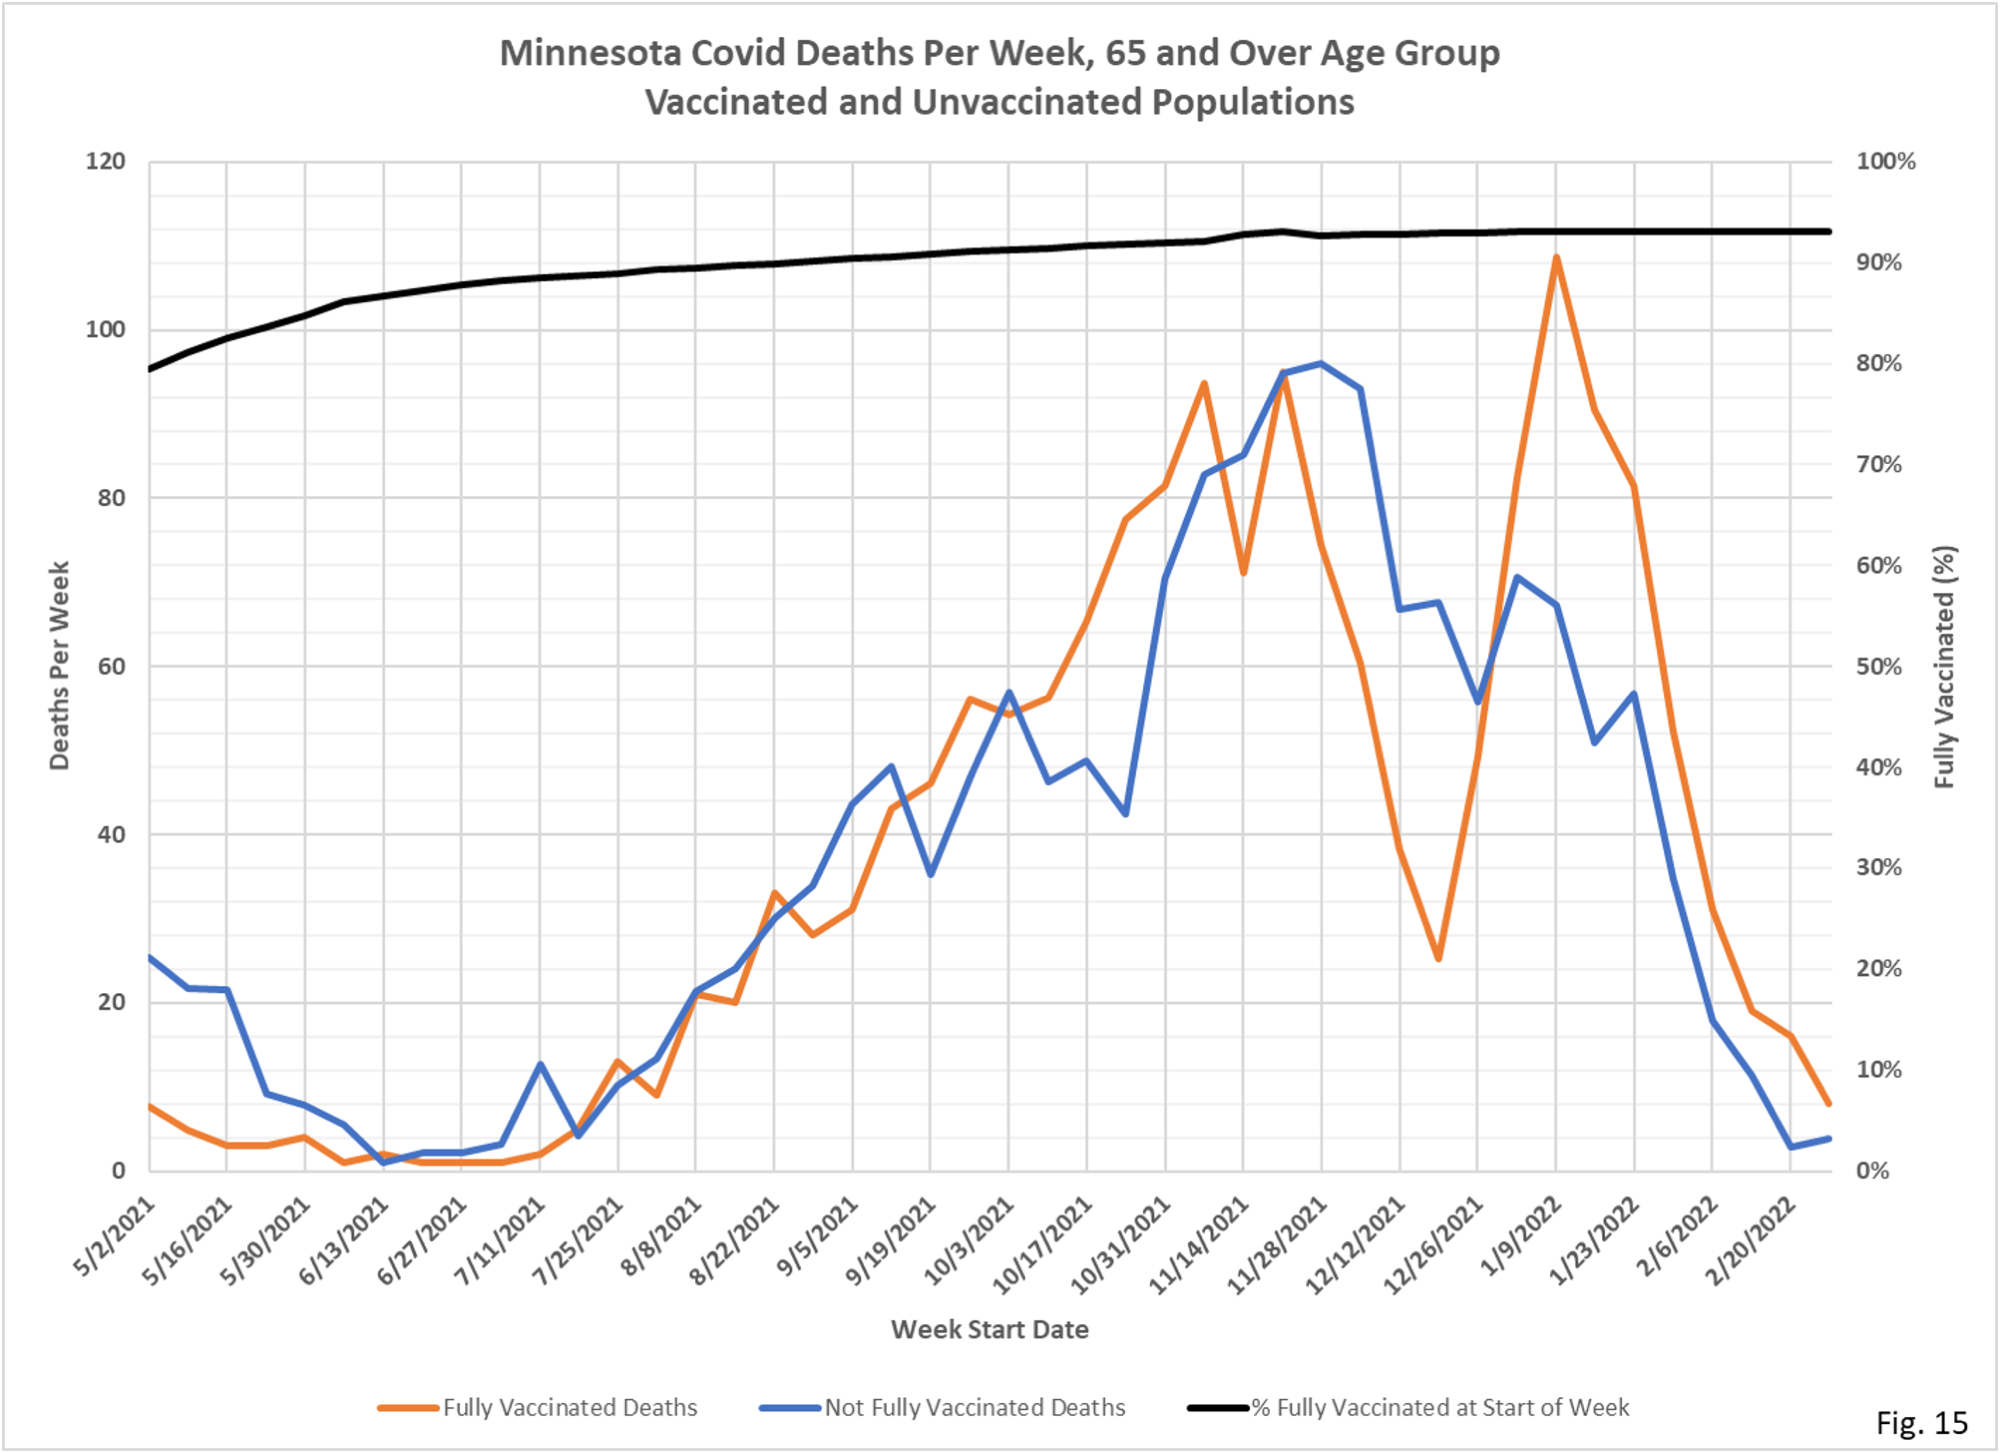
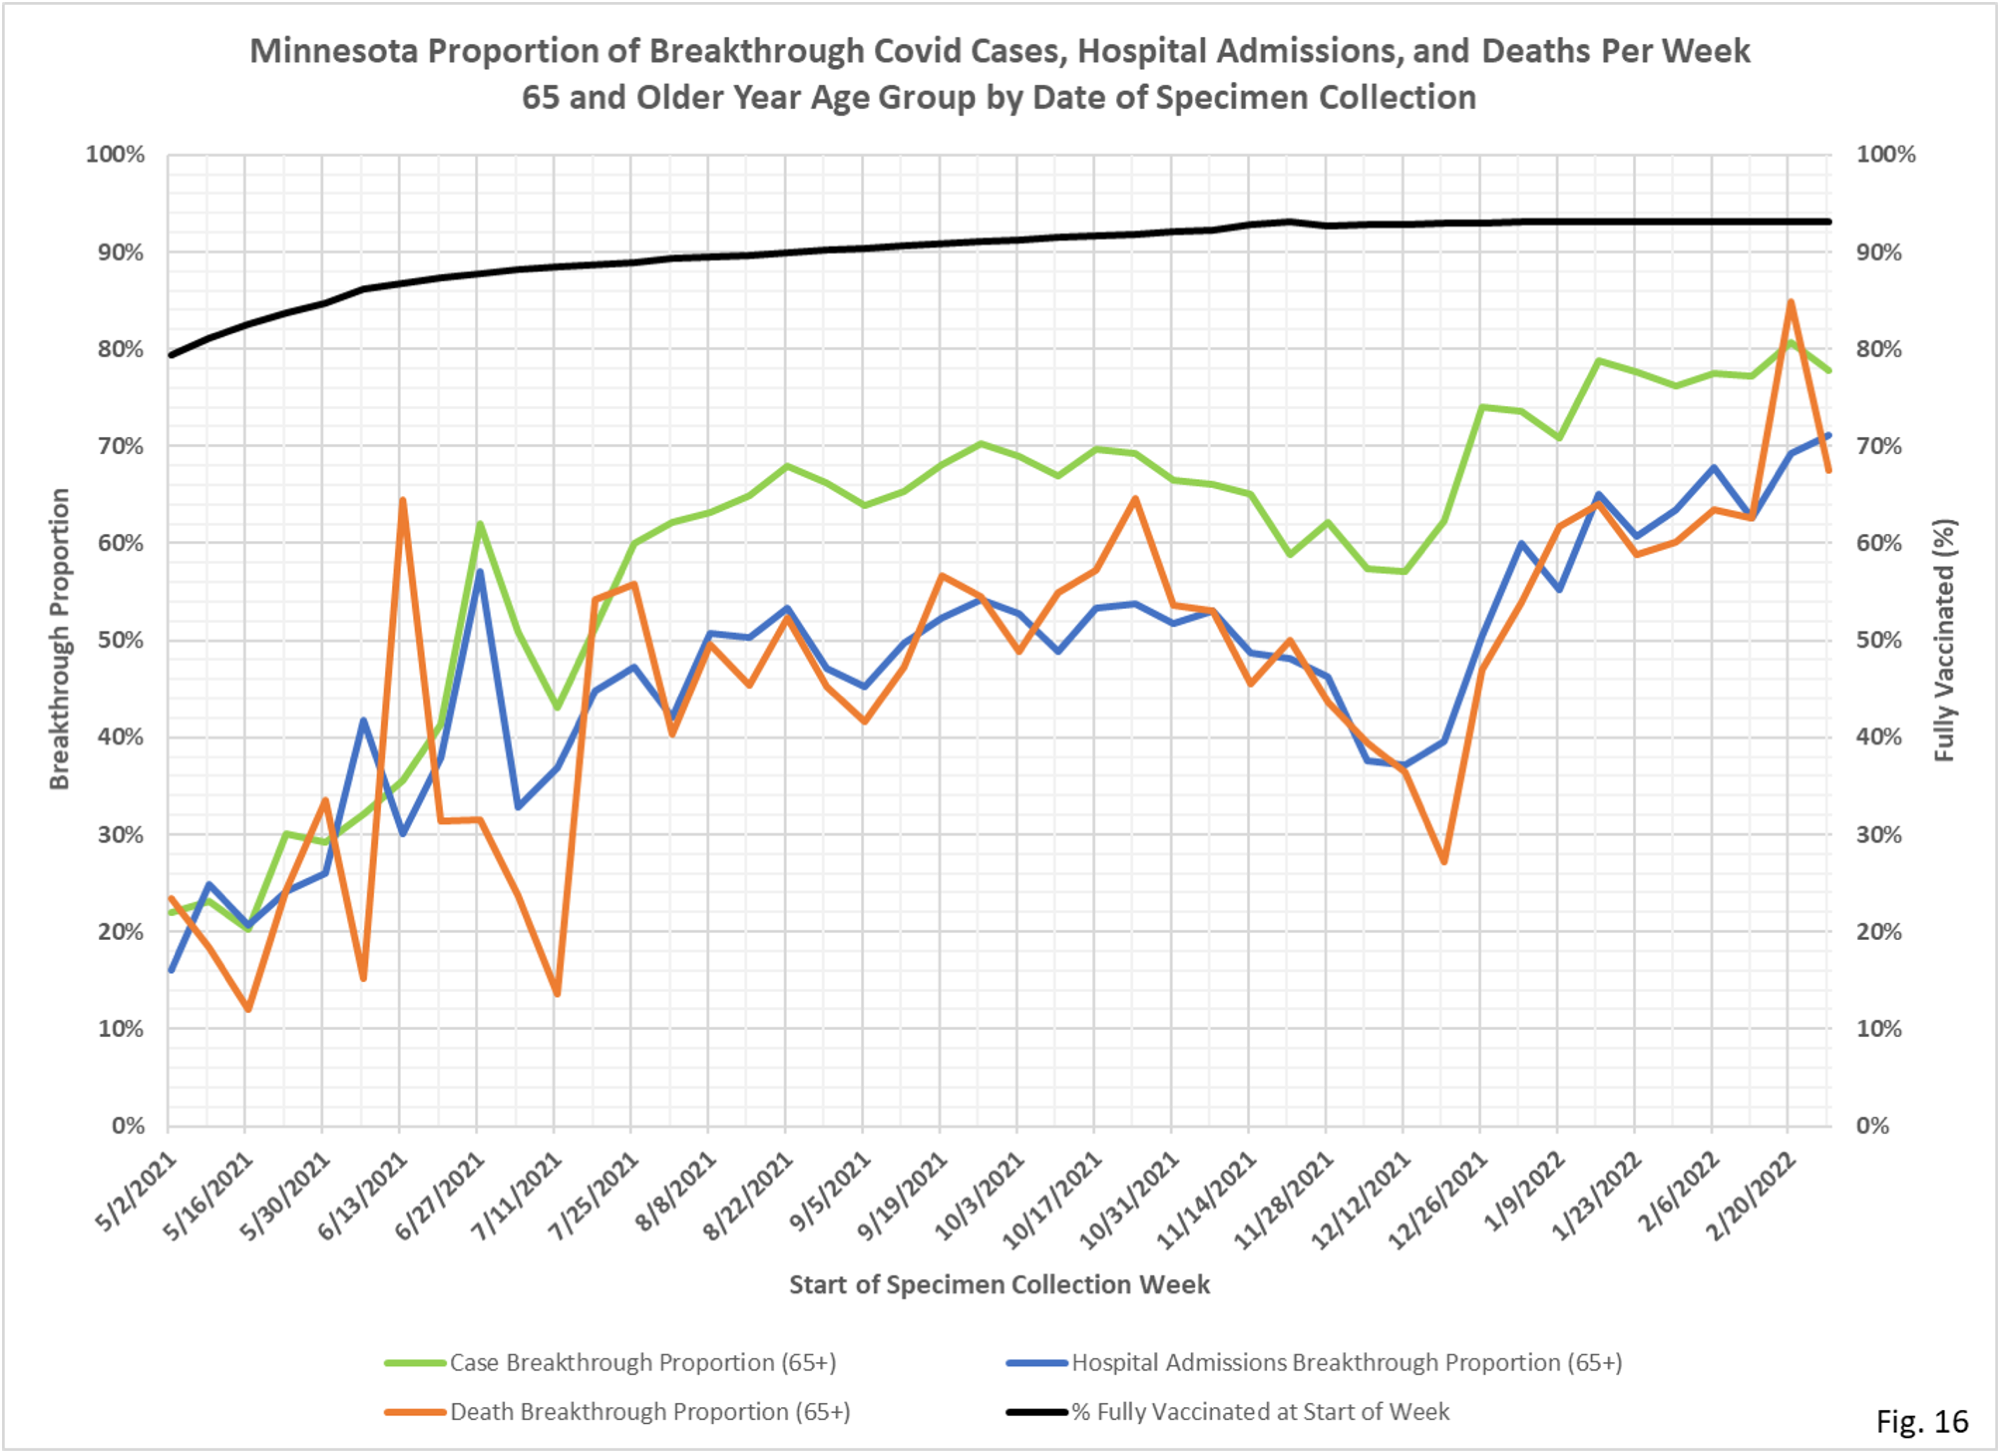
- In the charts that follow there are 4 slides for each age group; cases, hospital admissions, and deaths for the vaccinated and unvaccinated populations each week, and a single chart showing the breakthrough proportions each week.
- New this week is the addition of a curve on each chart showing the per cent of each age group that is fully vaccinated at the start of each week. Fully vaccinated is defined as completing their vaccination shots at least 14 days prior to the start of the week, but booster shots are not considered.
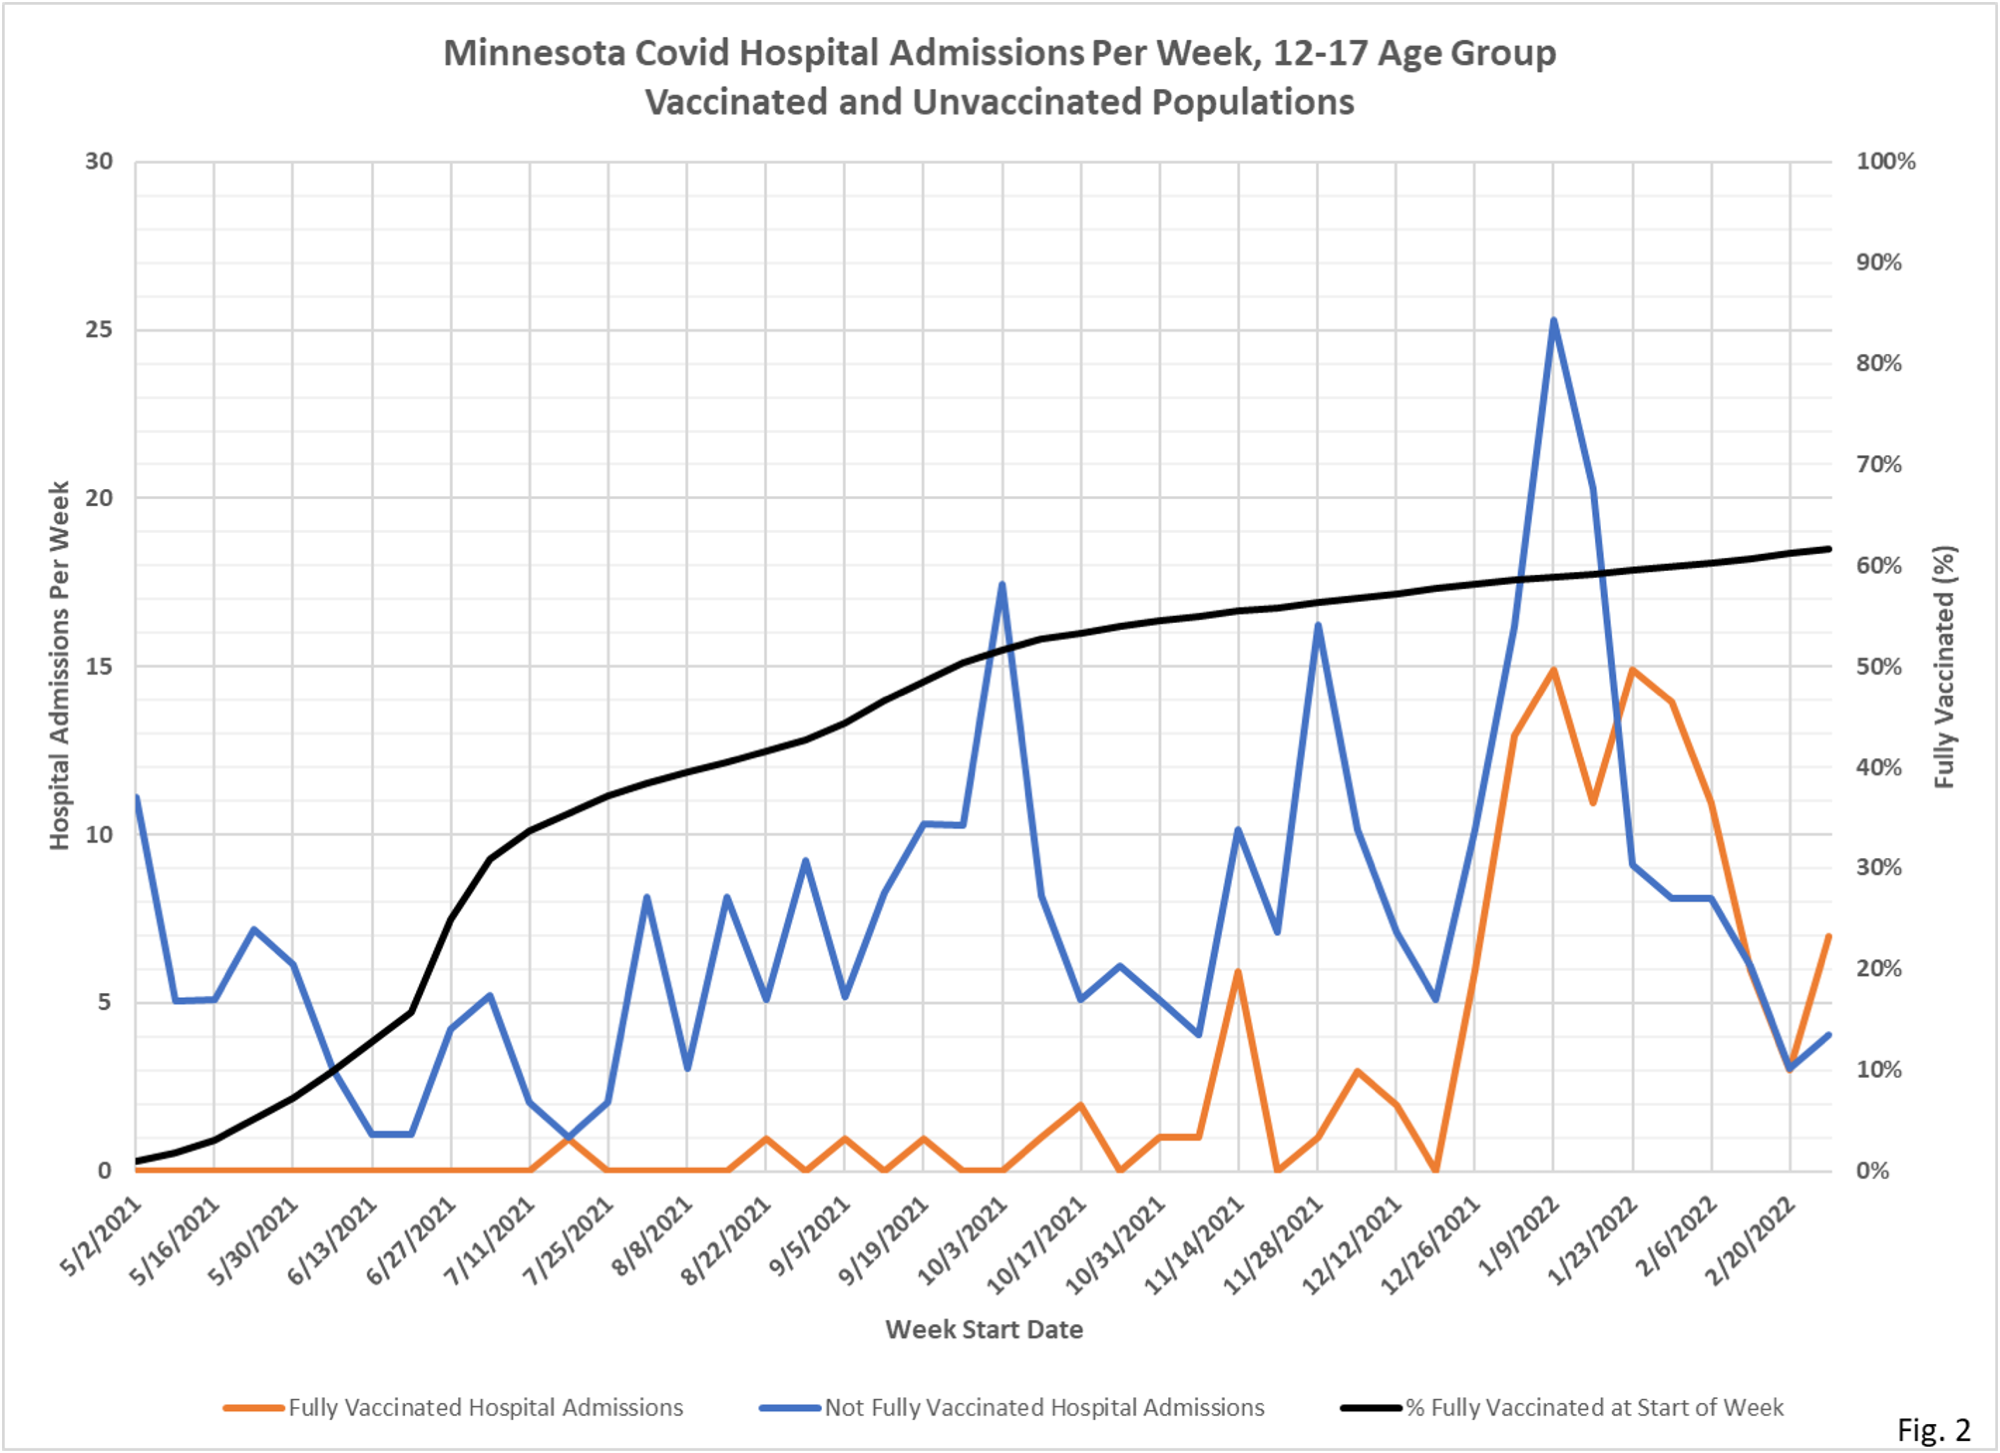
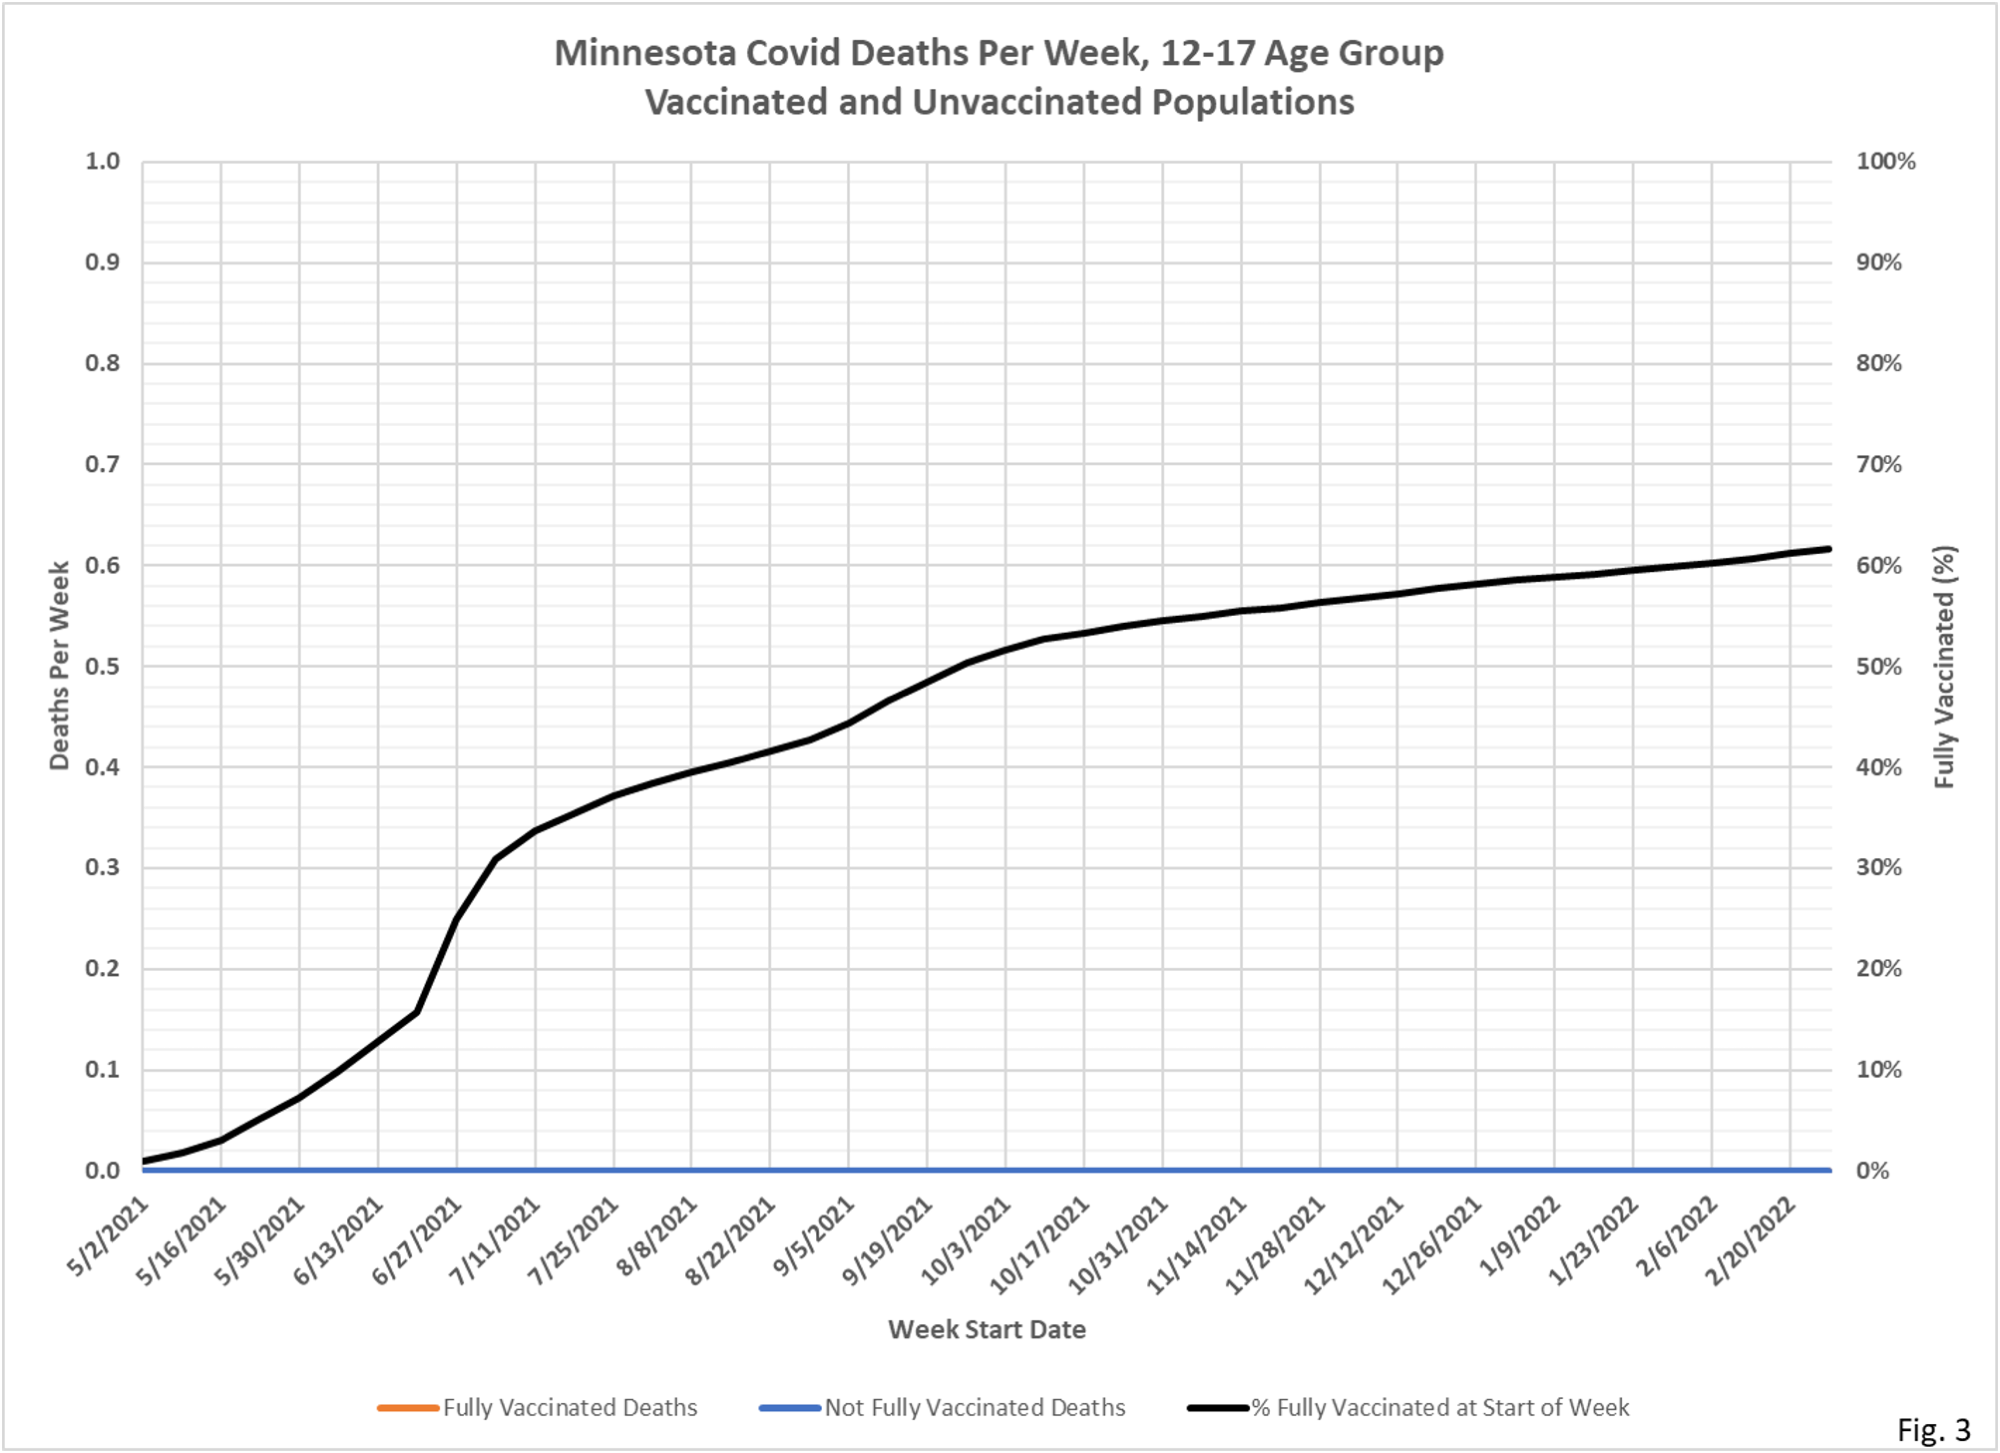
- Fig. 1 thru 4, 12-17 Age Group: Vaccinated cases exceed unvaccinated since 12/19/2021. The case chart (Fig. 1) helps illustrate that the vaccinated 12-17 population was susceptible to Omicron, beginning in early December 2021, but seemed to have protection against Delta in the several months prior. The admissions chart (Fig. 2) shows a similar pattern.
- Fig. 5 thru 8, 18-49 Age Group: The 18-49 age group has roughly a 10% higher vaccination rates than the 12-17% age group, but without fully evaluating the timing of vaccination vs positive test it is difficult to draw too many conclusions. We have requested date of vaccination for all breakthrough cases from MDH but so far this data has been refused.
- Fig. 9 thru 12, 50-64 Age Group: The 50-64 age group charts appear quite similar to the 18-49 age group charts, vaccinated cases exceed unvaccinated by a large margin throughout the Omicron surge stating in late 2021, and vaccinated admissions and deaths roughly equal unvaccinated admissions and deaths only starting on the tail end of Omicron in mid-January 2022. The 50-64 age group has a roughly 10% higher vaccination rate than the 18-49 age group, but timing of vaccination is an issue. The effect of booster shots also needs to be considered, but we have only partial information about boosters.
- Fig. 13 thru 16, 65 and Over Age Group: Vaccinated cases greatly exceed unvaccinated cases since July 2021, partly because the vaccinated population is much larger, and waning vaccine immunity probably contributes as well. In contrast to the other age groups, vaccinated admissions and deaths are roughly equal to unvaccinated admissions of deaths through the entire date range. This age group is highly vaccinated, and also becoming highly boosted.
- The data source for all charts is the data file vbtcirates.xlsx, found on the Minnesota Department of Health (MDH) web page: https://www.health.state.mn.us/diseases/coronavirus/stats/vbtcirates.xlsx . This data file gives the rates per 100k of cases, hospitalizations, and deaths in full vaccinated and not fully vaccinated people, broken out by age group. The rates per 100k in vbtcirates.xlsx are converted into cases, hospitalizations, and deaths by multiplying by the appropriate population. The number of vaccinated people by age group can found on the Vaccine Data page, https://mn.gov/covid19/vaccine/data/index.jsp , in the data file People Vaccinated by Age. The unvaccinated population is found by taking the US Census American Community Survey 5-Year Estimate (Data Table S0101, https://data.census.gov/cedsci/table) and subtracting the vaccinated population. The breakthrough proportion is then found by dividing the breakthrough events by the total of the breakthrough and non-breakthrough weekly events.
- MDH defines a breakthrough event as a Covid case, hospital admission, or death that occurs 14 or more days after completing the vaccination series (not including boosters).

For future charts, could you make all the text color BLACK? Gray on a light background is hell to read for us older people. Bonus if you could bump the font size up if there is room. Thank you. Great charts.
I’m not sure if this is “Yeah” for the failure of rushed, poorly tested, forced mRNA product … “that’ll teach you”. Or, “Holy Crap”, they’re no where near finished experimenting on us! At the end of the day, coronaviruses win, always have and seemingly always will. Take better care of yourself, get sick, get better … the weak will perish. Darwin 101.
This was a huge missed opportunity to leverage the facts regarding disease co-morbidities and use the same ‘fear’ machine to change meaningful behaviors … instead of masking and hiding. Oh, but that might affect the stock prices of Coke, Pepsi, Nabisco, etc. So much for ‘stakeholder capitalism’ … just another perverted leftist slogan with hypocritical results.