Really not much going on, but we have ongoing concerns about the accuracy and timeliness of the breakout data being provided by DOH.
 Dave’s notes:
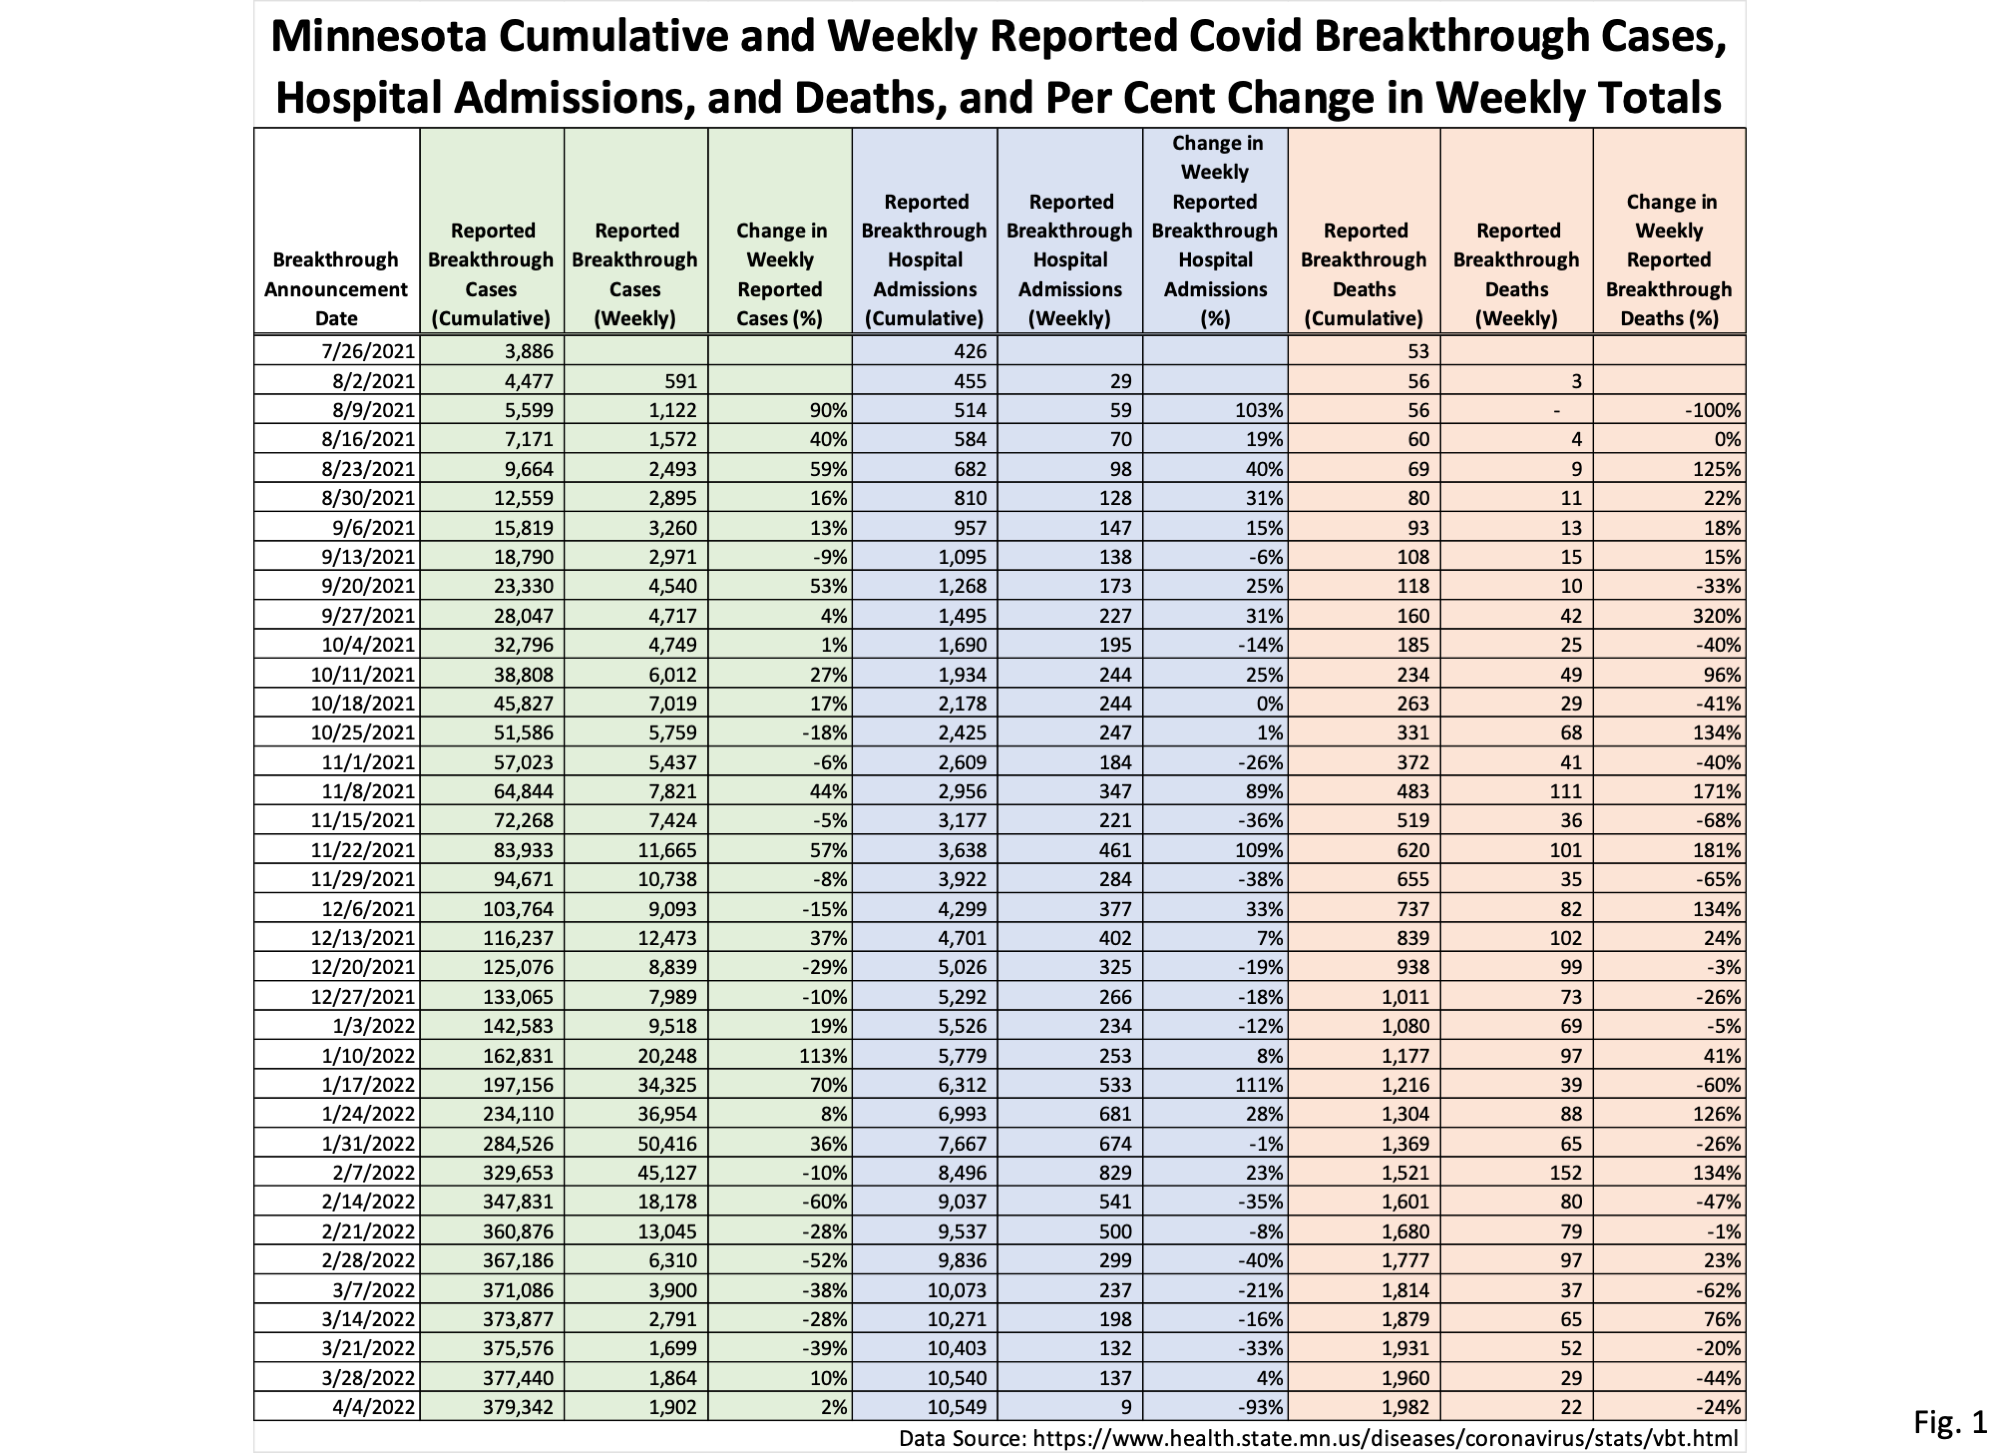
- Fig. 1: This table is the weekly announced cumulative breakthrough cases, hospital admissions, and deaths, as well as the weekly totals, and change in weekly totals, as published on the Vaccine Breakthrough Update web page https://www.health.state.mn.
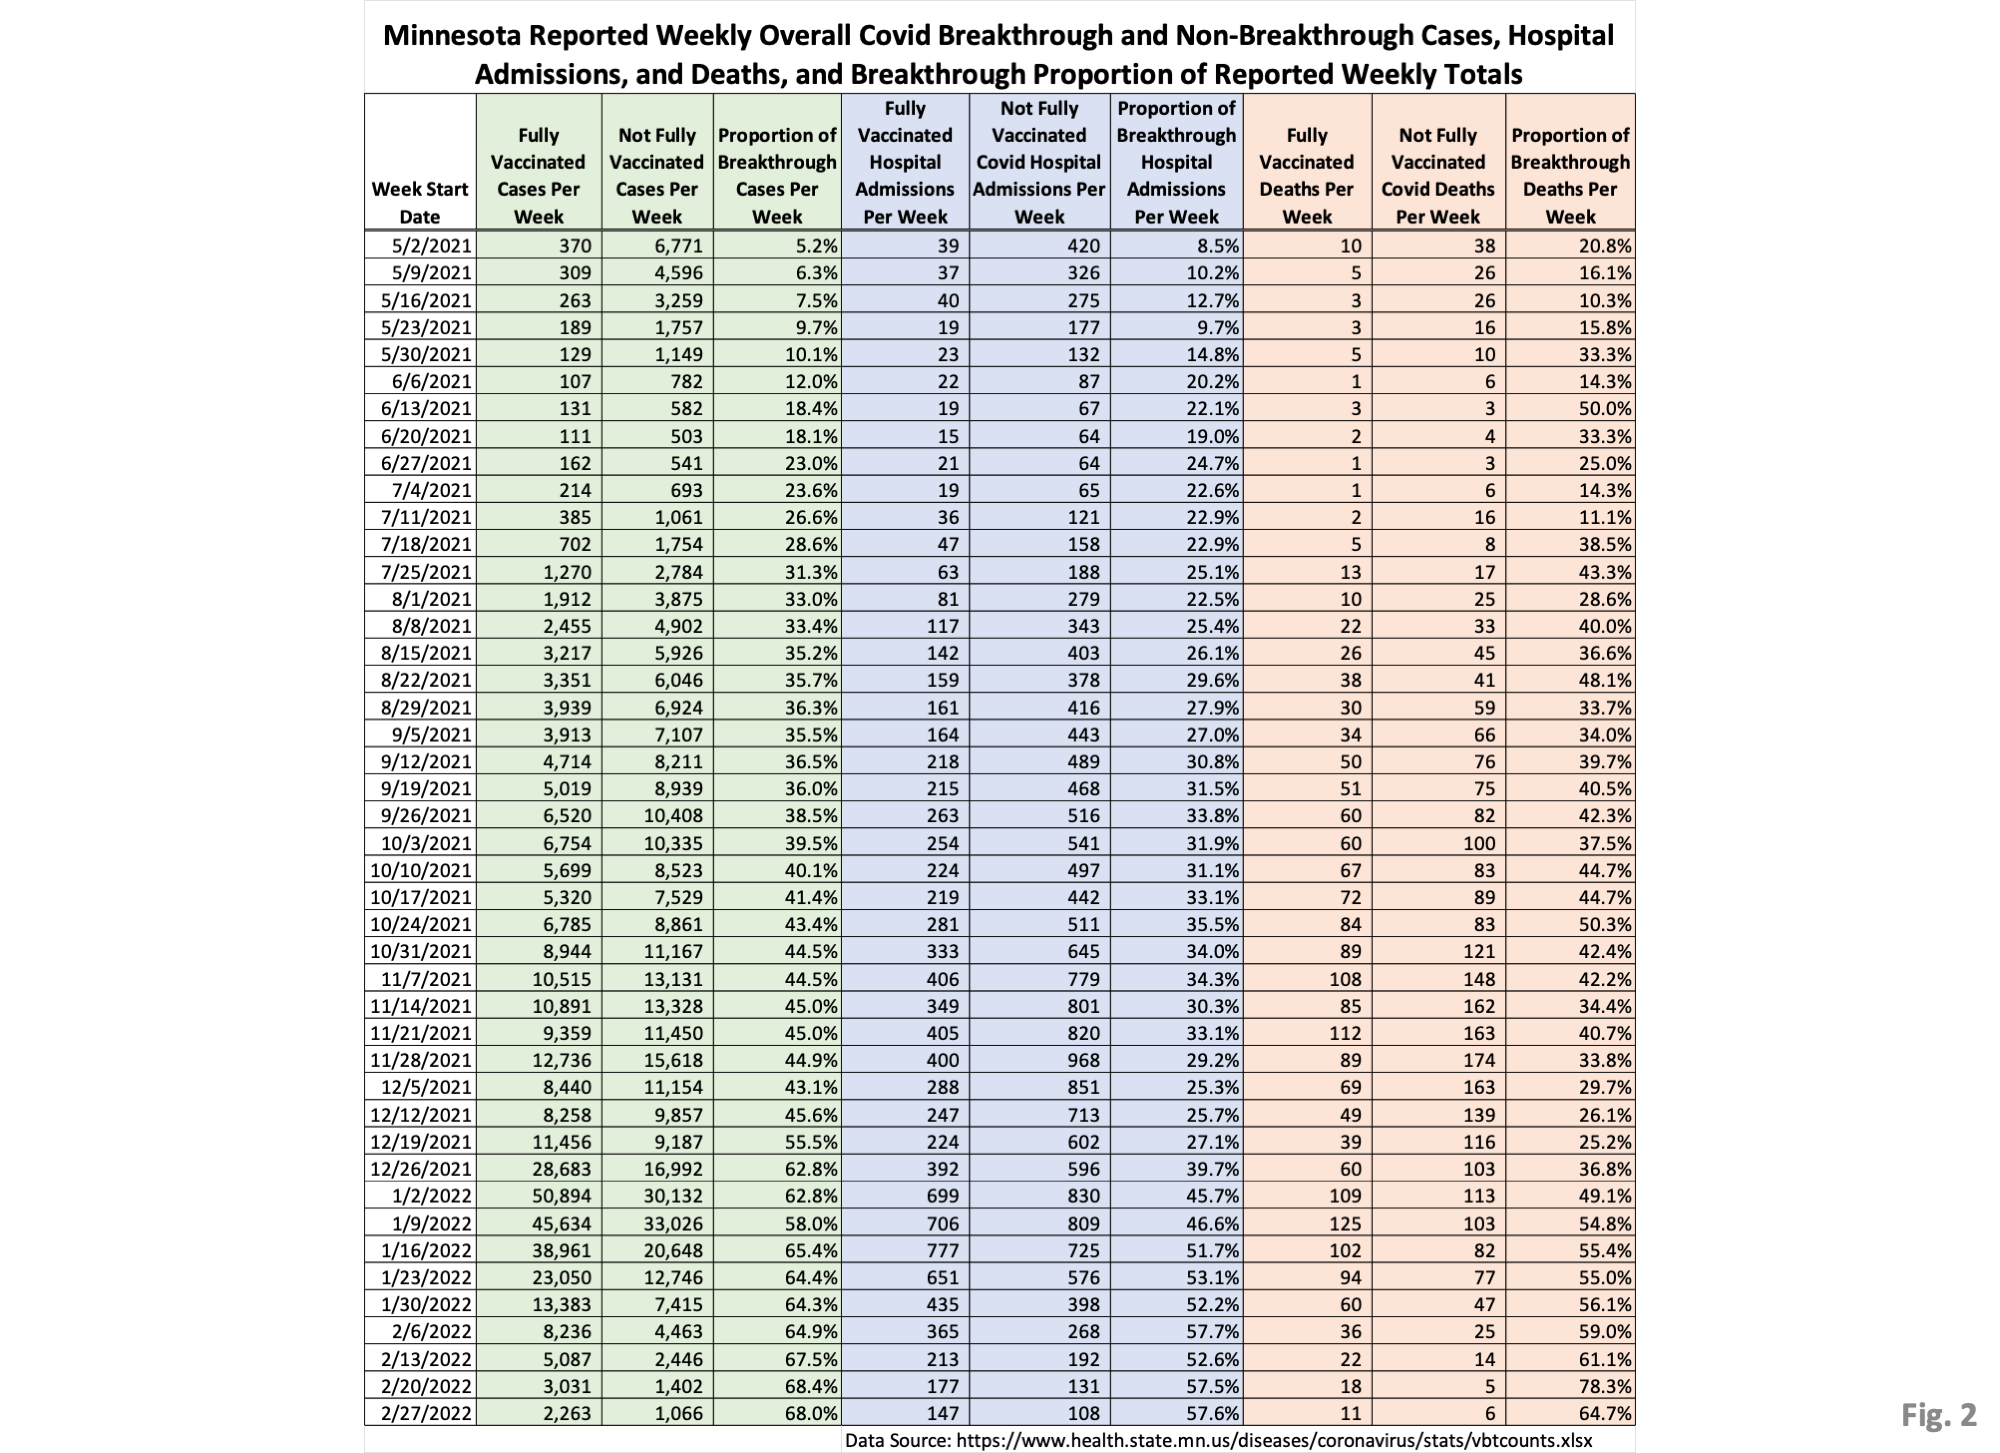
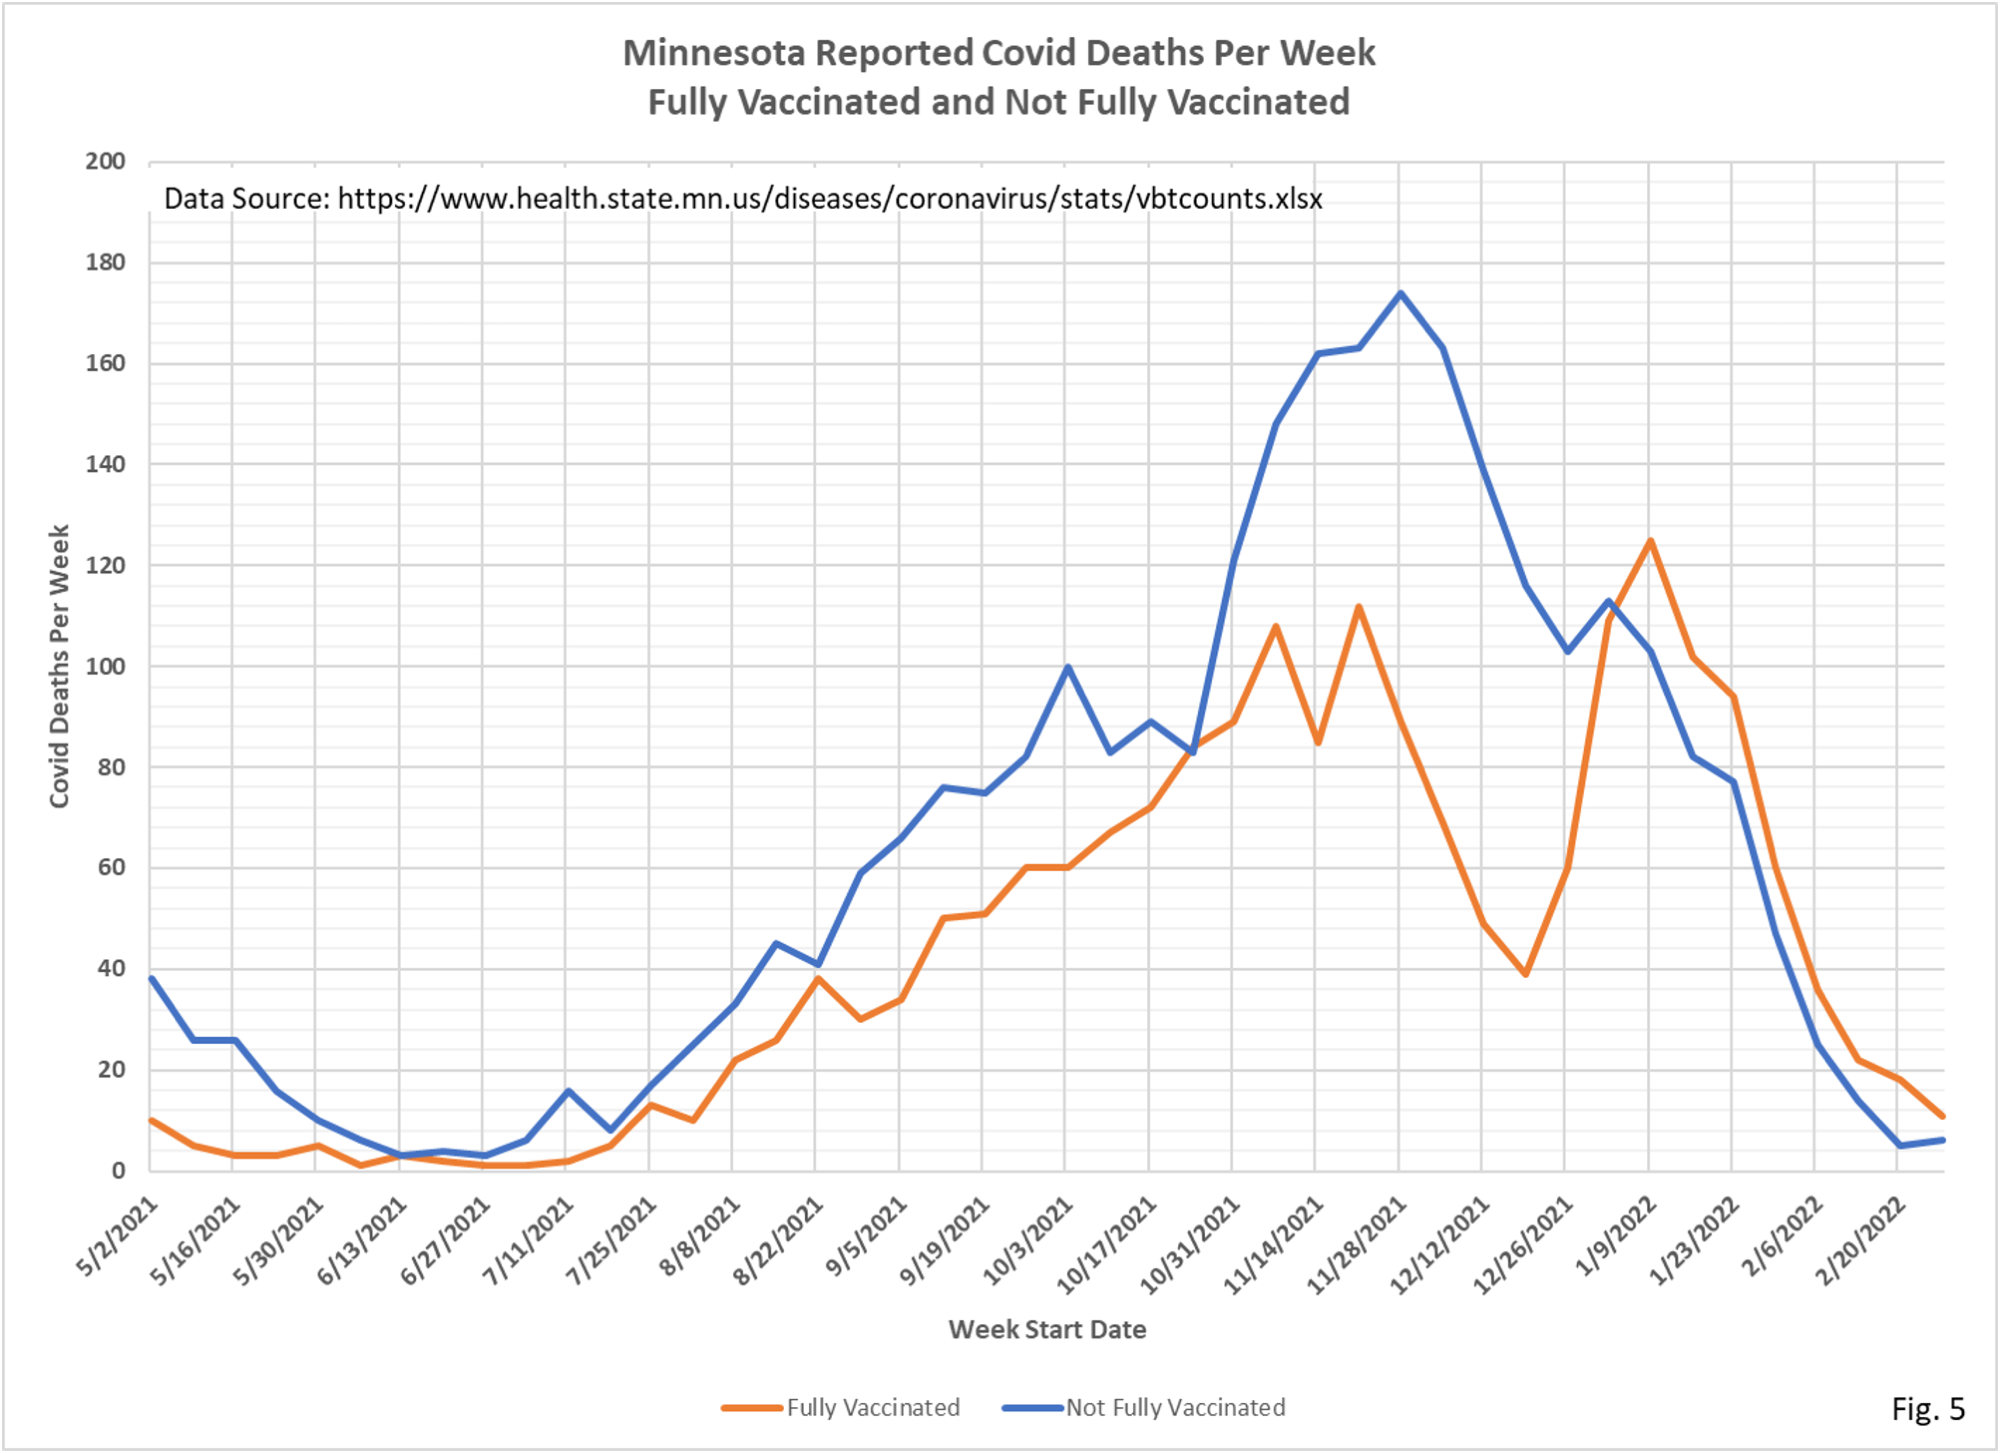
us/diseases/coronavirus/stats/ vbt.html. New breakthrough cases announced on 4/04/2022 total just 1,902 cases, up slightly from 1,864 new breakthrough cases last week. New breakthrough hospital admissions total just 9 for the week, which seems inconsistent with the number of breakthrough cases for the week. New breakthrough deaths totaled 22, which perhaps is consistent with the number of new breakthrough cases. - Fig. 2: This table displays the total cases, hospital admissions, and deaths that occurred each week among the vaccinated and unvaccinated populations. These numbers are taken from the vbtcounts.xlsx data file published by MDH on the Vaccine Breakthrough Update web page. We noted last week that we discovered an apparent discrepancy in MDH’s published data compared to a data we obtained through a Government Data Practices Act request. We still believe that there are missing breakthrough cases, hospital admissions, and deaths that are not reported in this data, but there has no response from MDH about our concerns. Note that cases, hospital admissions, and deaths reported for the week of 2/27/2022, the last row in the table, are much higher among the vaccinated than among the unvaccinated.
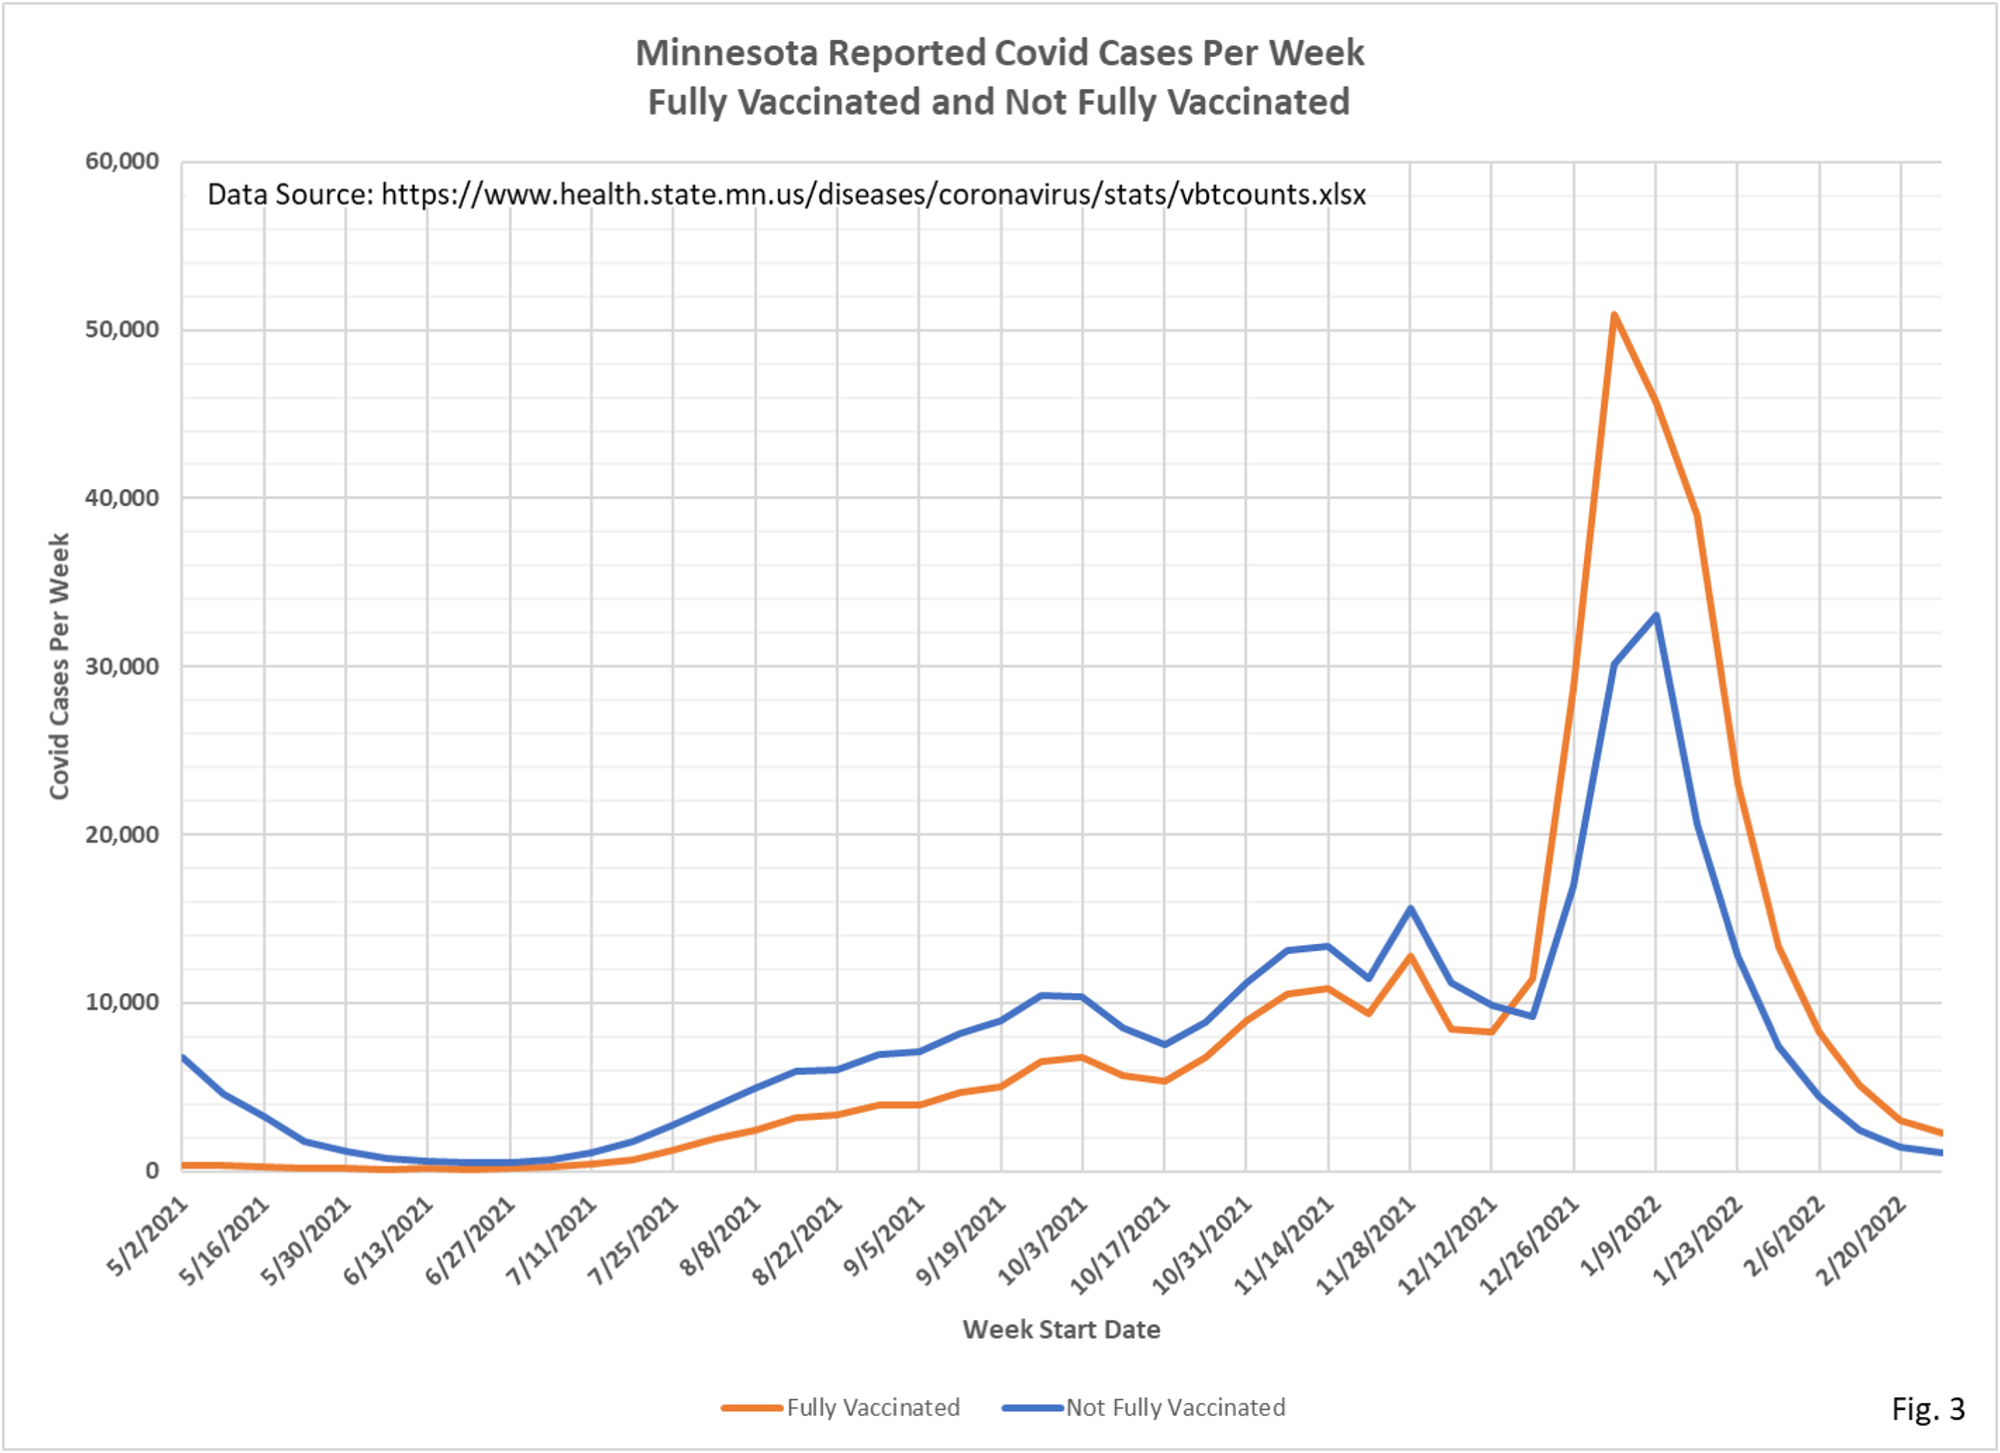
- Fig. 3: This chart simply plots the cases among the vaccinated and unvaccinated populations each week, as found in Fig. 2. Cases can be seen to be levelling off for the week of 2/27/2022, with vaccinated cases higher than unvaccinated cases.
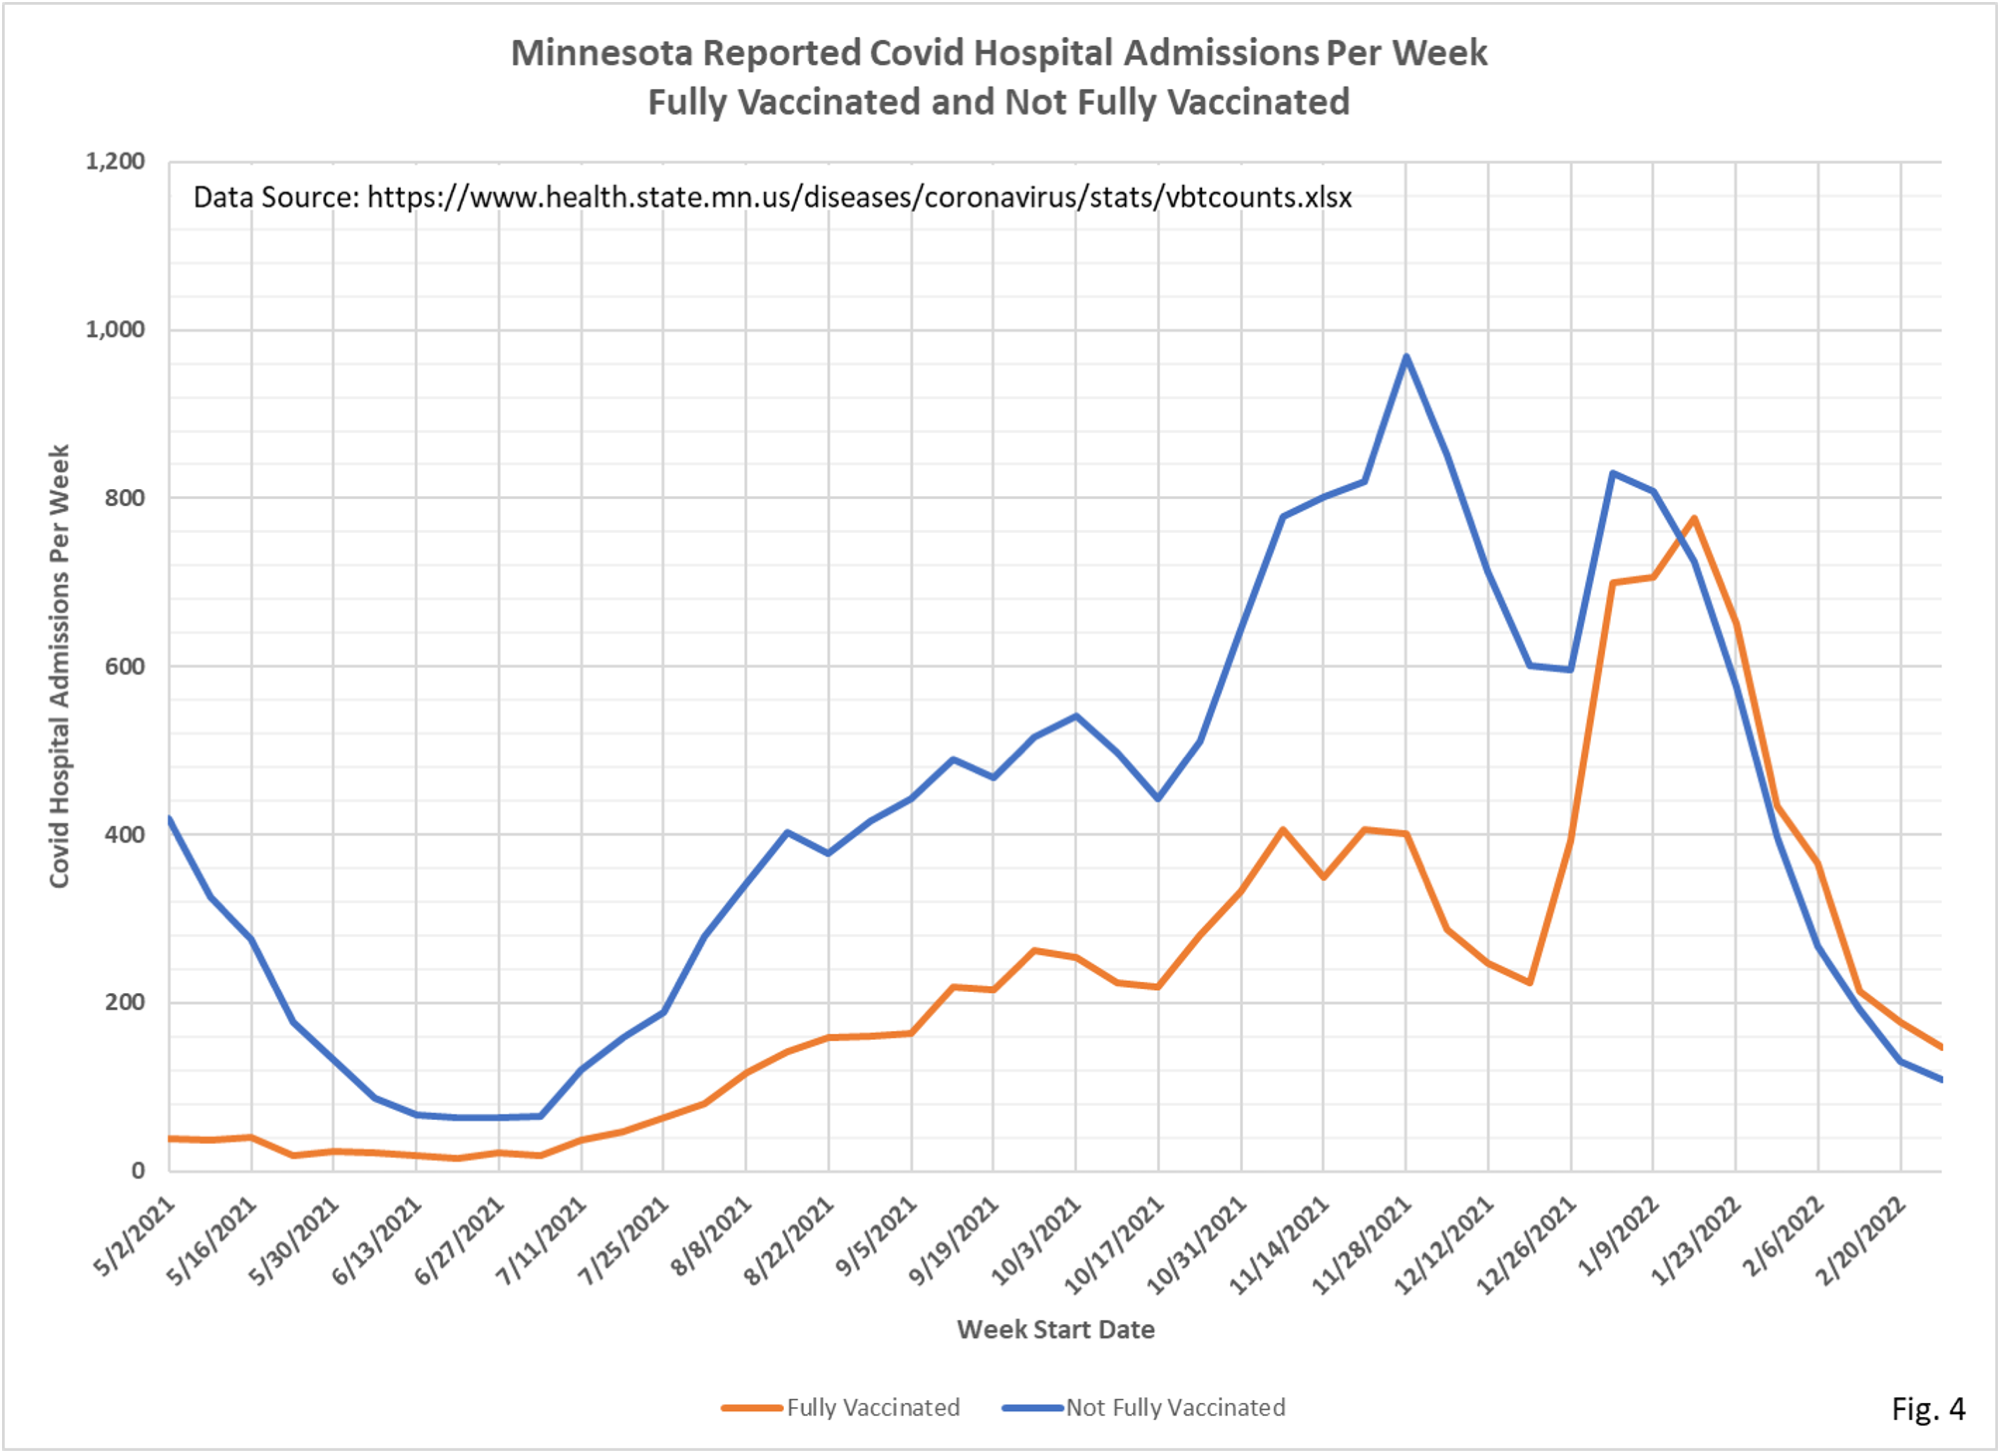
- Fig. 4: This chart displays the hospital admissions among the vaccinated and unvaccinated populations each week from the data in Fig. 2. For the week of 2/27/2022 hospital admissions were still declining, but they have since appeared to level off at a low value. Unanswered by MDH is what proportion of admissions are incidental (people admitted for non-Covid reasons and then testing positive).
- Fig. 5: This chart displays the vaccinated and unvaccinated deaths each week from the data in Fig. 2. Similar to hospital admissions, we do not know the proportion of people who had an incidental positive Covid test prior to death.
- The table and charts are updated for new data released by Minnesota Department of Health (MDH) on 4/04/2022, adding data for the week starting 2/27/2022 and ending 3/05/2022.
- The data source for the data on Fig. 1 is the cumulative breakthrough cases, hospitalizations, and deaths published on the MDH COVID-19 Vaccine Breakthrough Weekly Update https://www.health.state.mn.
us/diseases/coronavirus/stats/ vbt.html - The data source for Fig. 2 is the data file https://www.health.state.mn.
us/diseases/coronavirus/stats/ vbtcounts.xlsx found on MDH web page https://www.health.state.mn. us/diseases/coronavirus/stats/ vbt.html. The data provided in the data file vbtcounts.xlsx is used without modification, other than to sum the weekly events and compute the breakthrough proportion. Vbtcounts.xlsx provides breakthrough and non-breakthrough cases, hospital admissions, and deaths for each week listed. - The charts in Fig. 3 through Fig. 6 are plots of the data in Fig. 2.
- MDH defines a breakthrough event as a Covid case, hospital admission, or death that occurs 14 or more days after completing the vaccination series (not including boosters.
