This set of charts gives the age structure for breakthrough and non-breakthrough events. Note that in the youngest age group, vax rates are not that high, so the proportion may match vax rate, indicating limited effectiveness. And in the oldest, most vulnerable group, similarly all events appear to be heading toward a proportion that is similar to the proportion vaxed.
Dave’s notes:
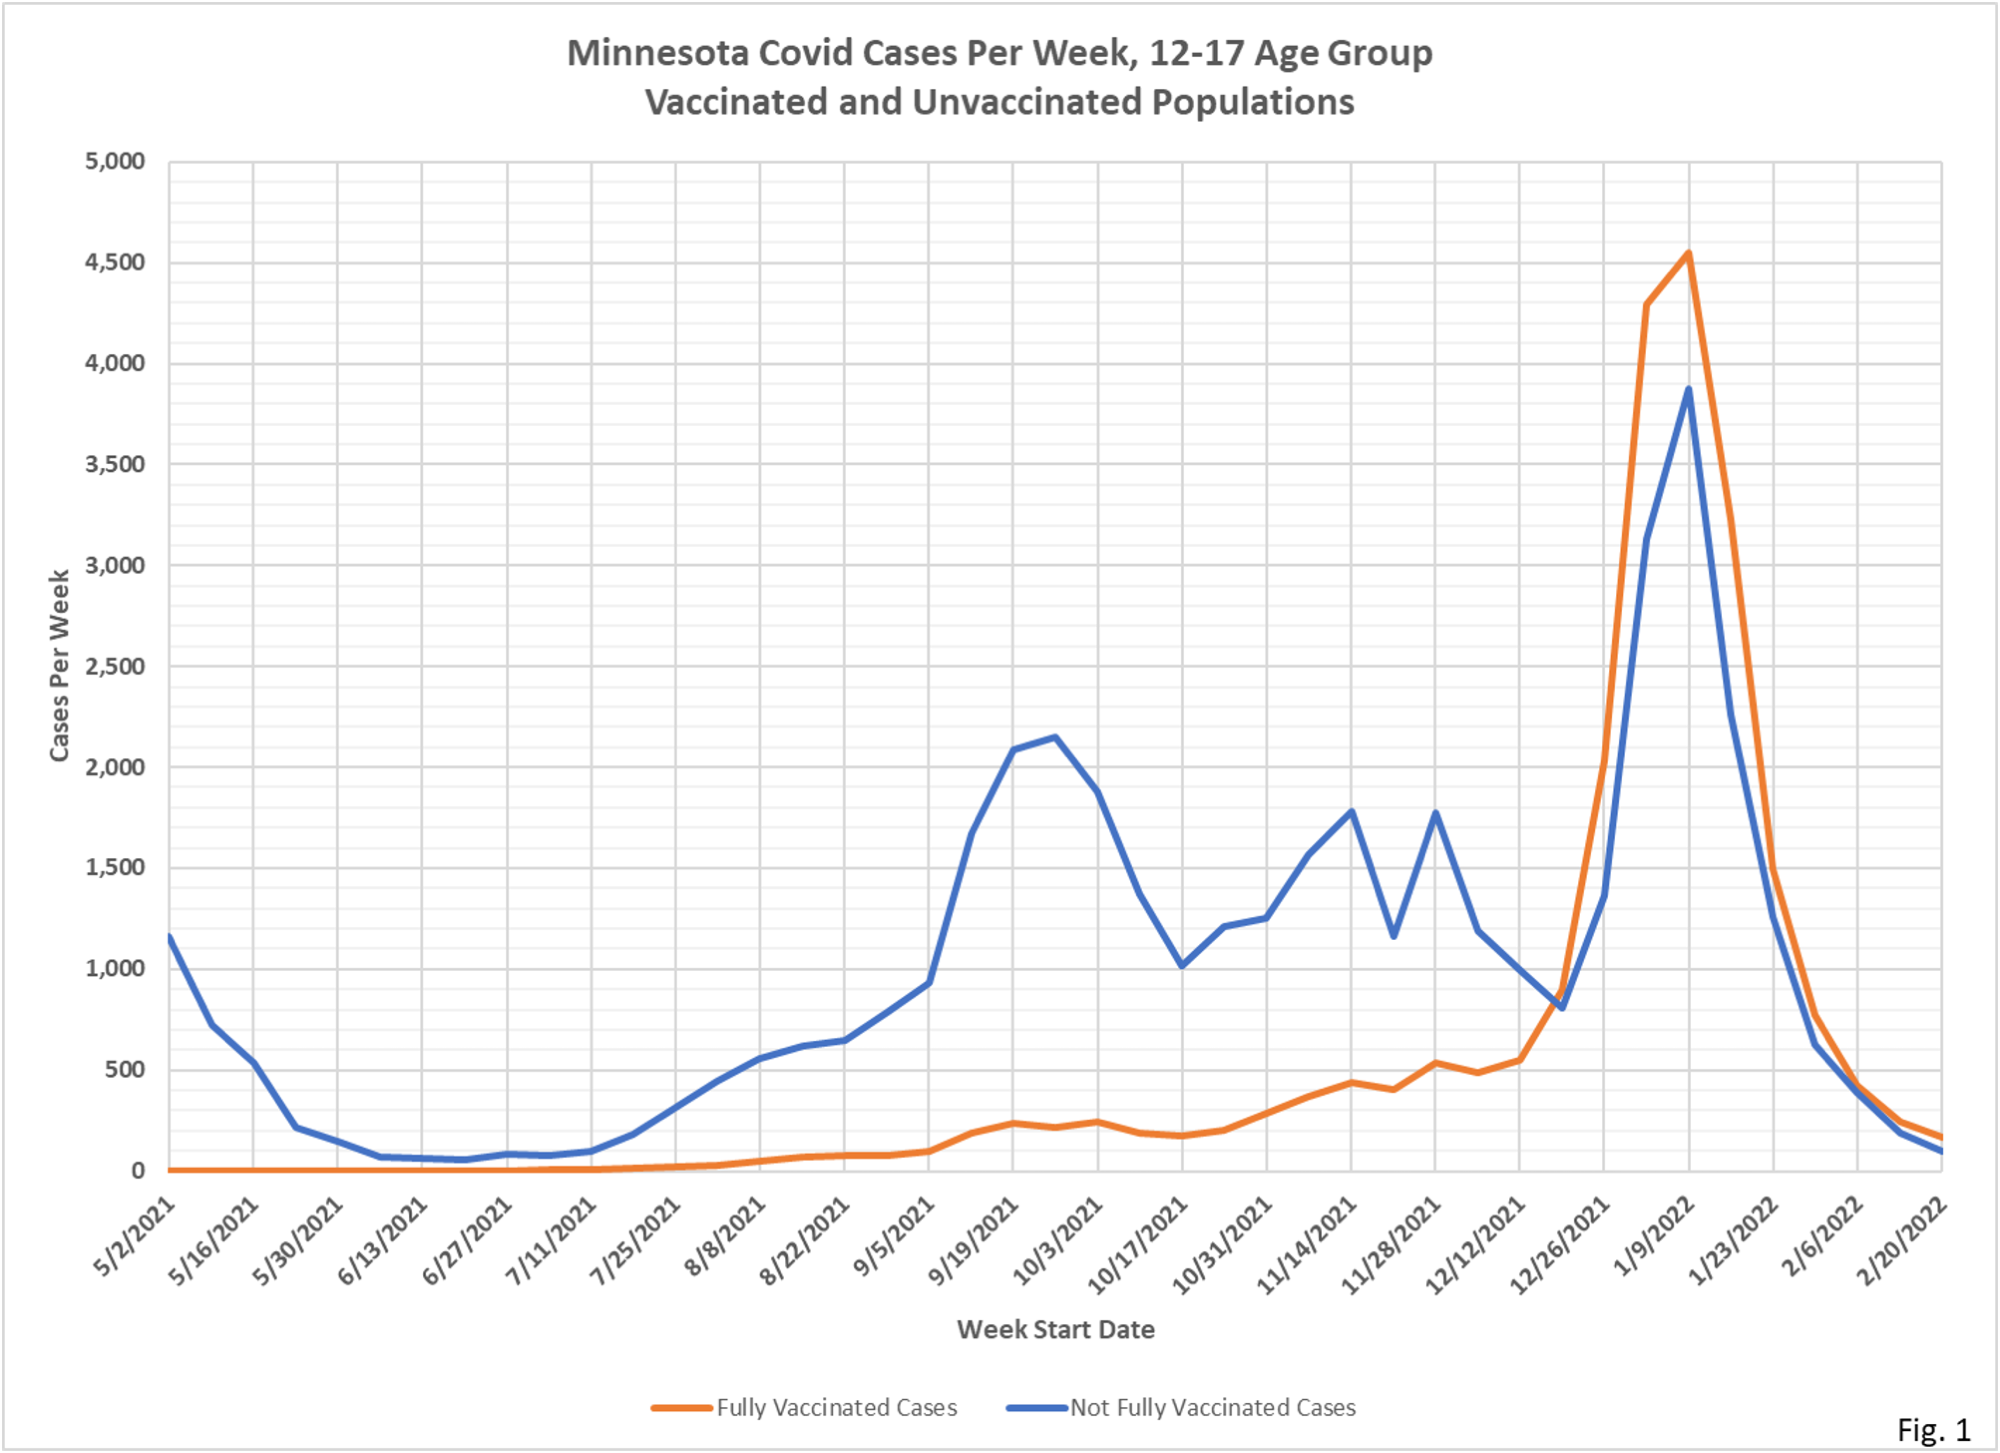
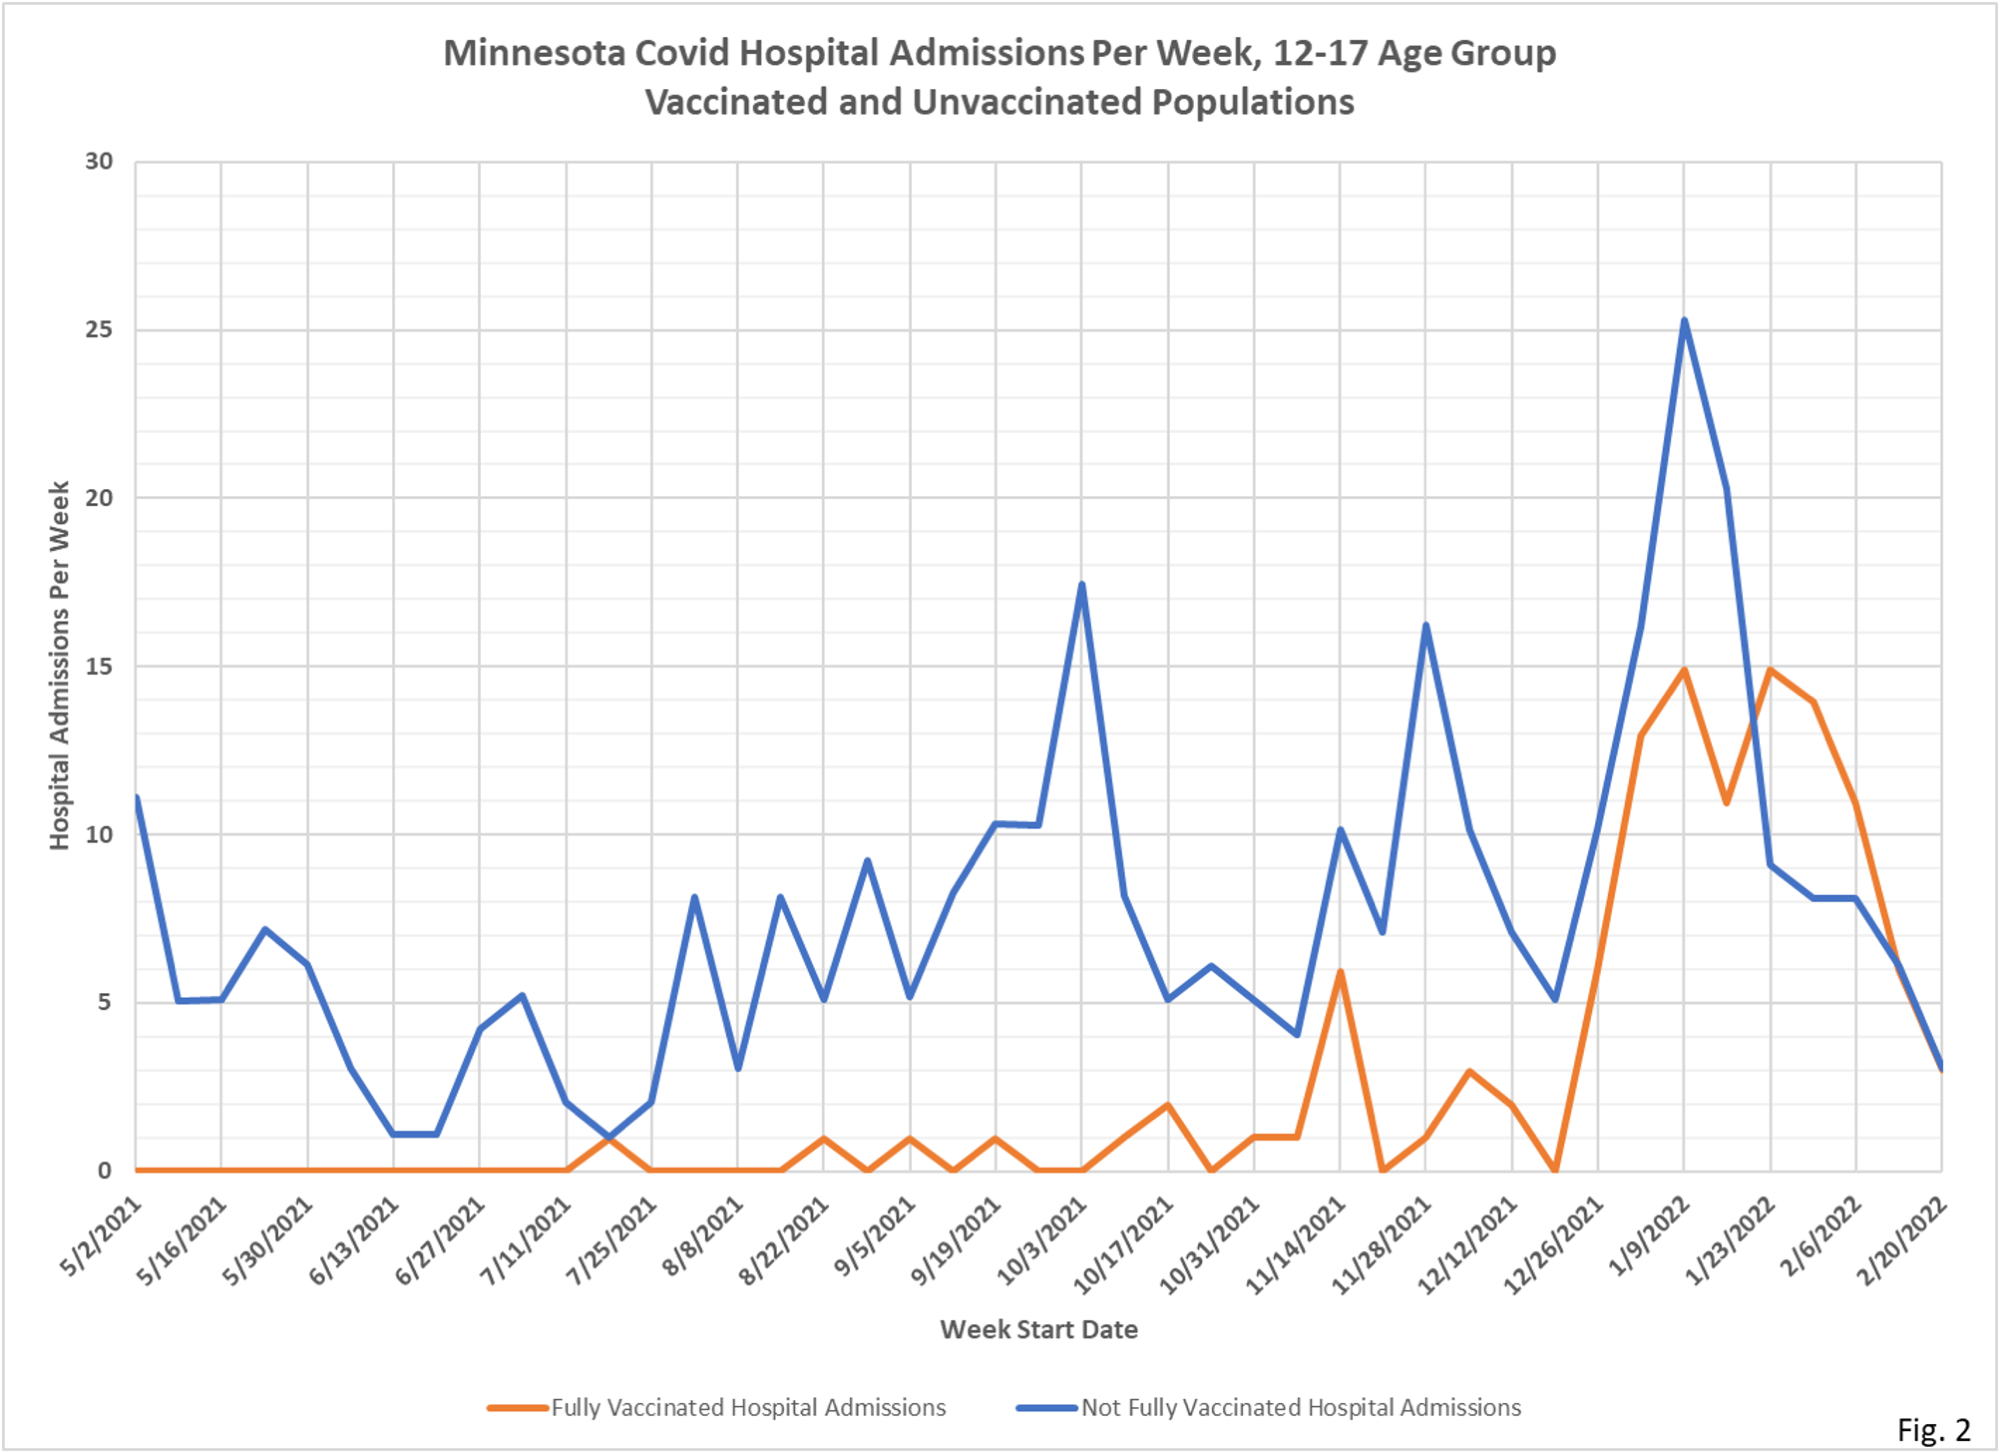
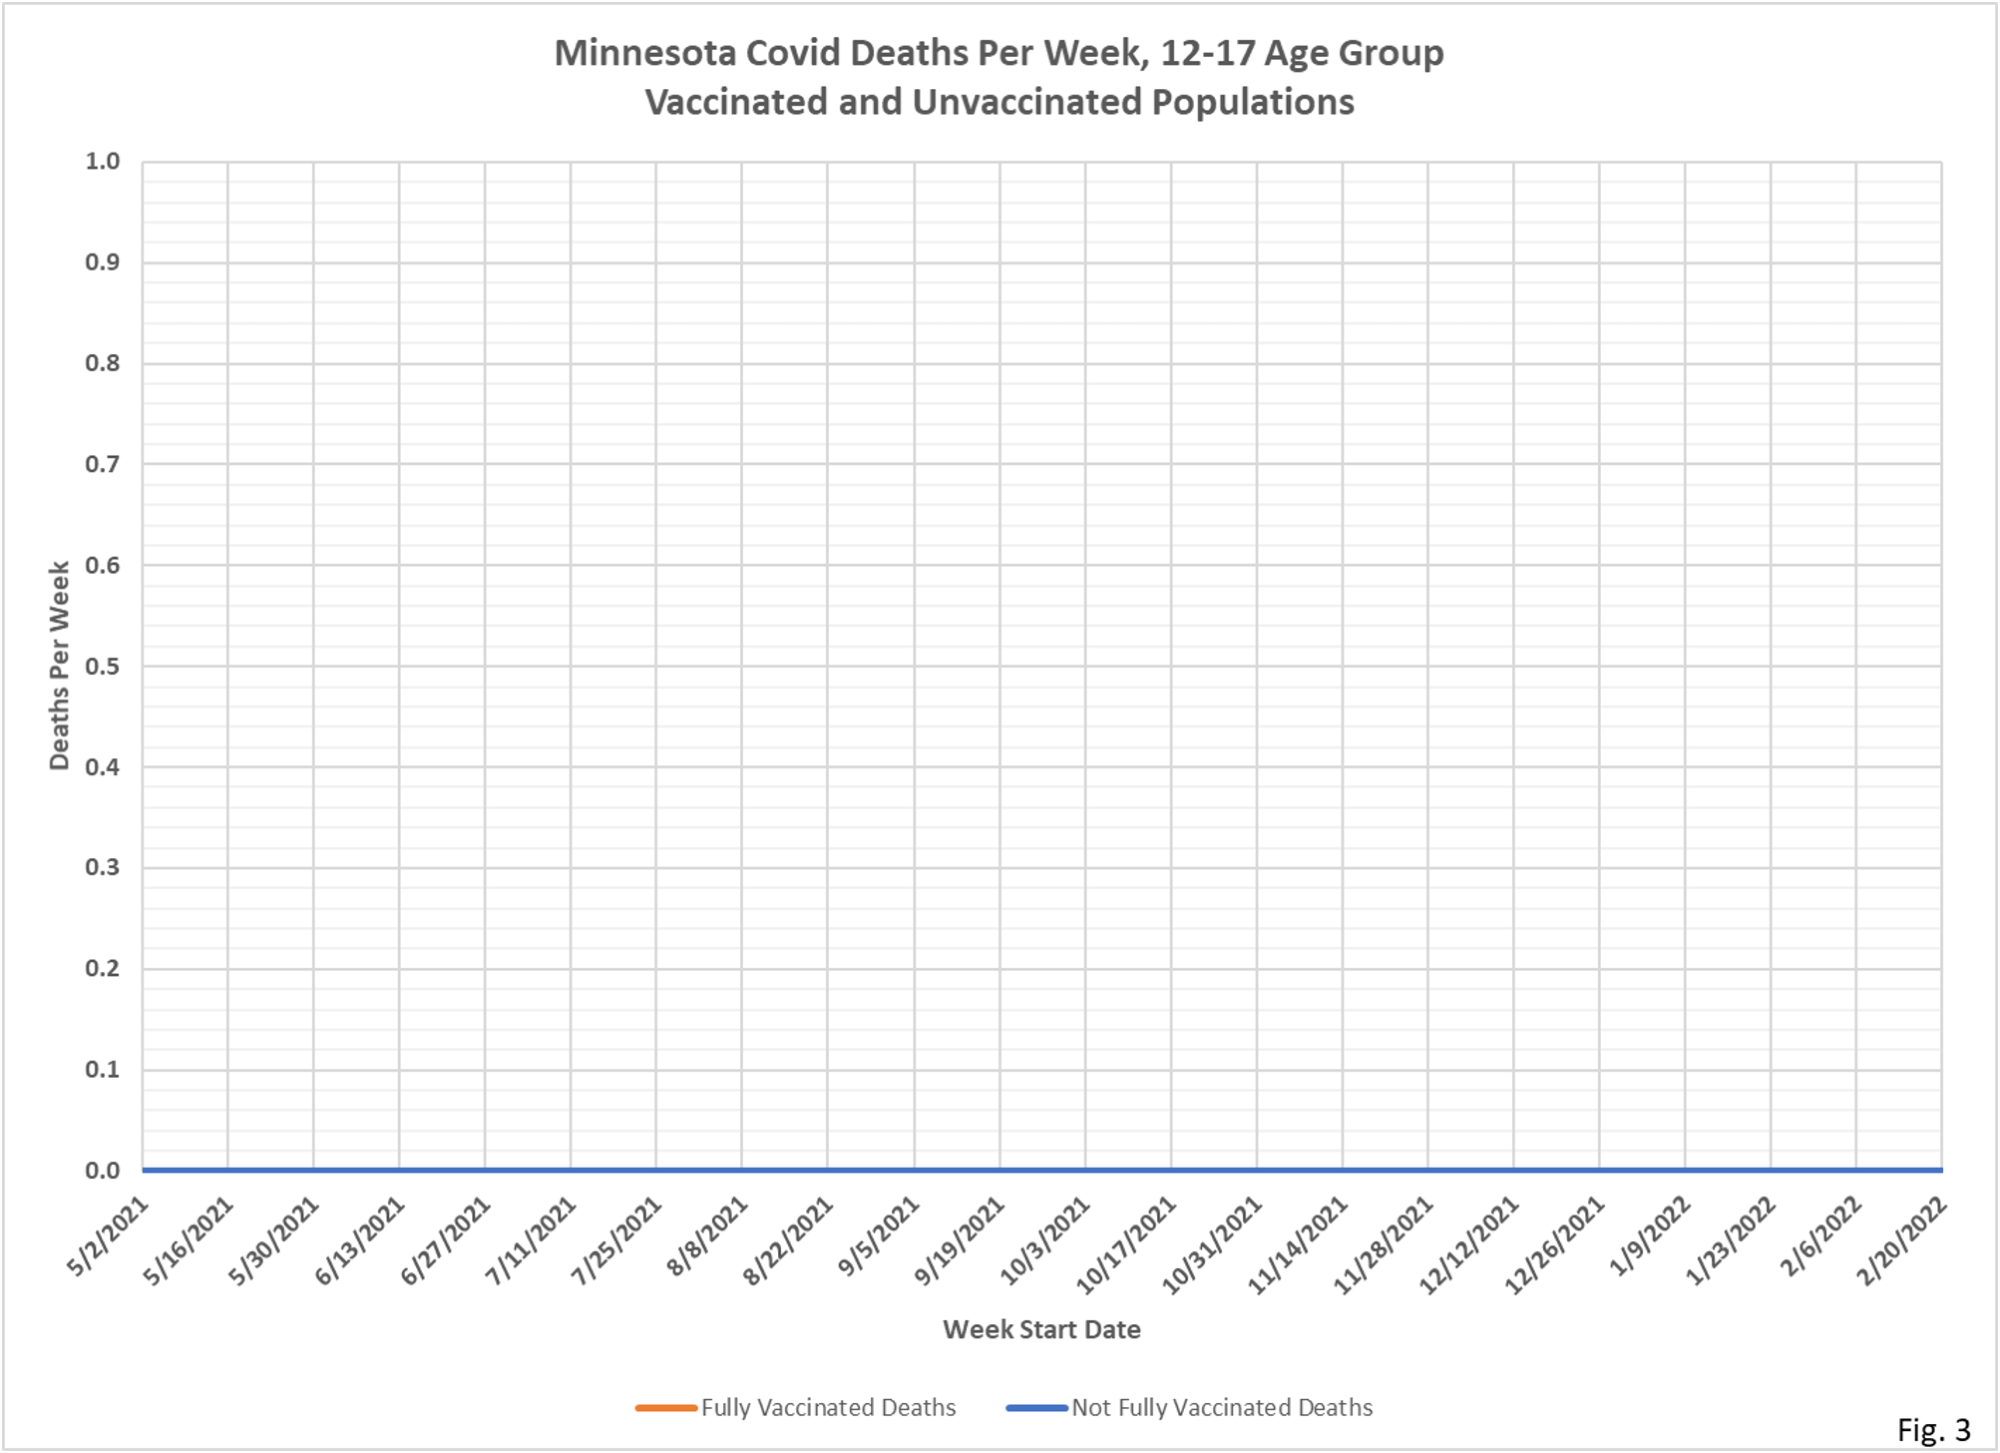
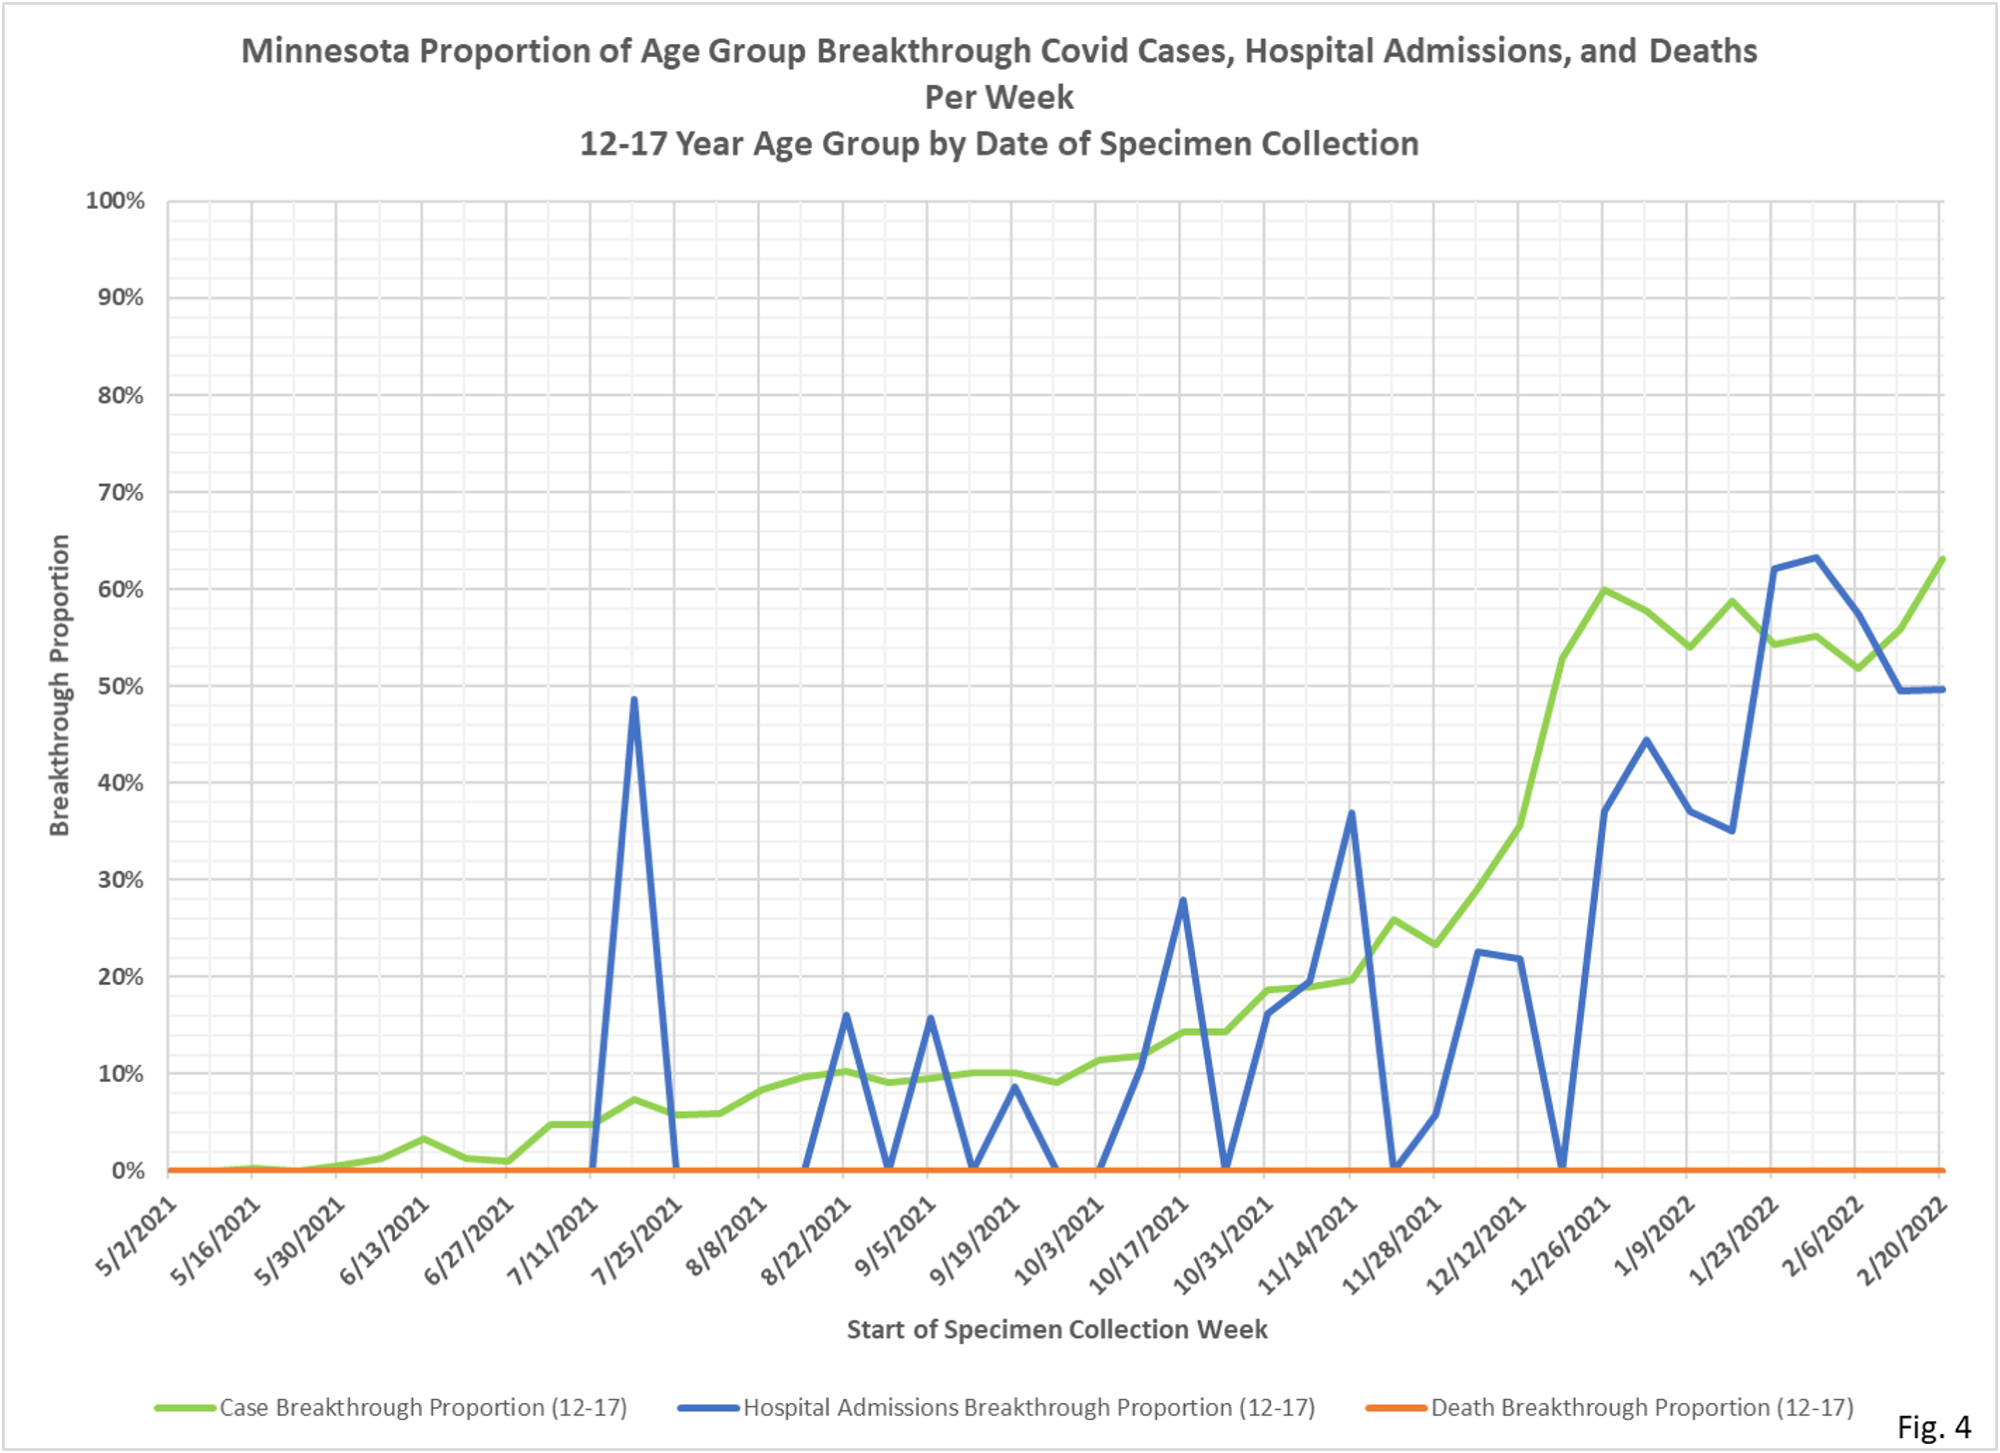
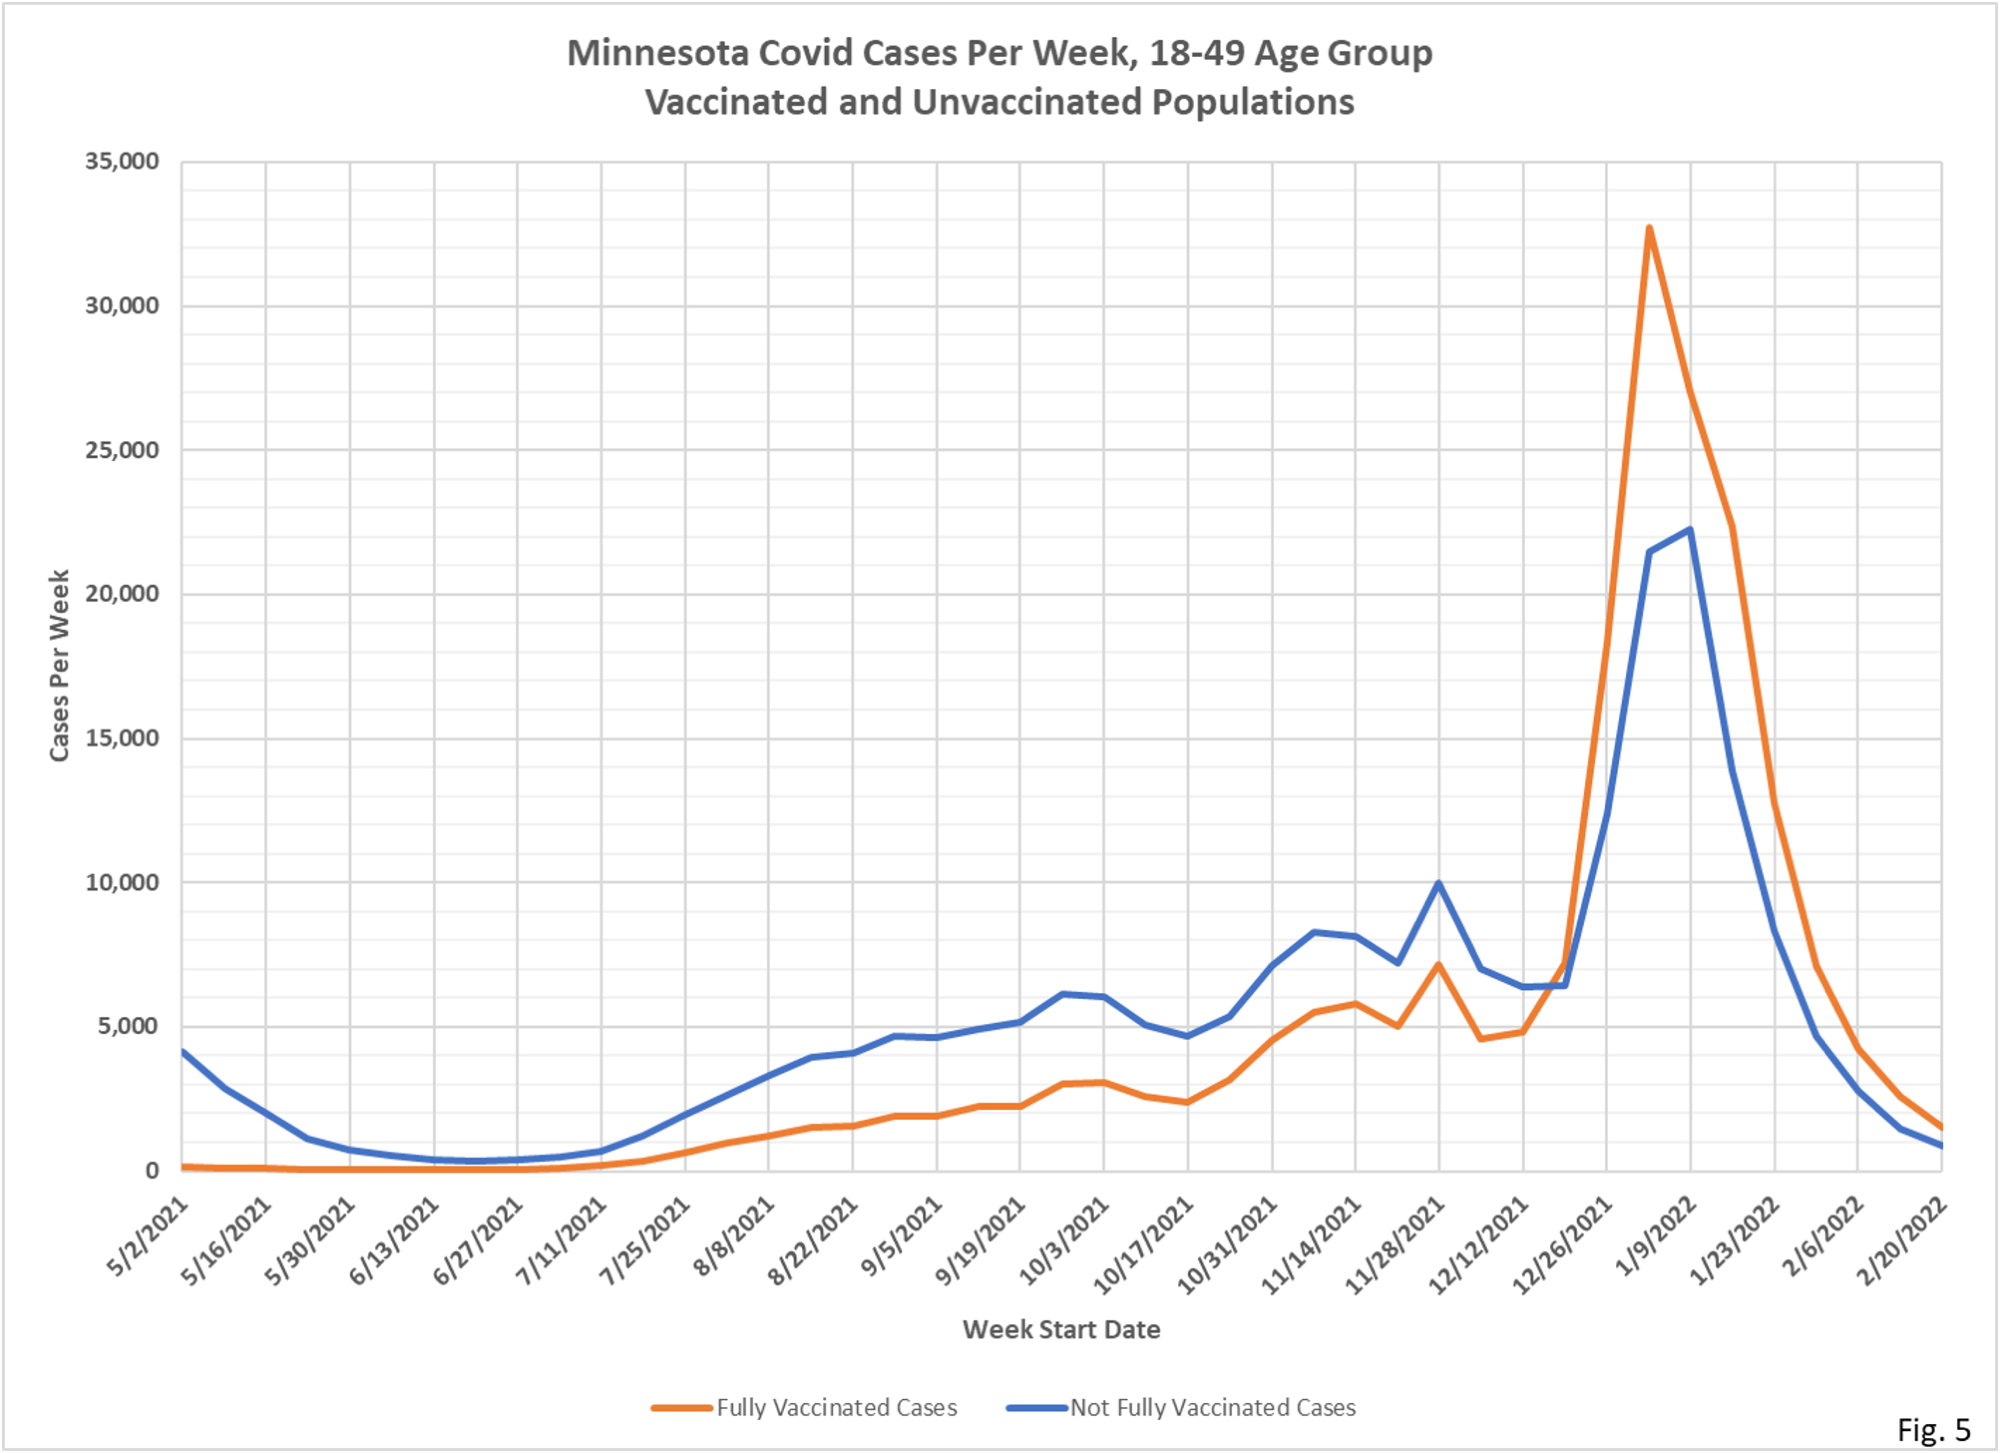
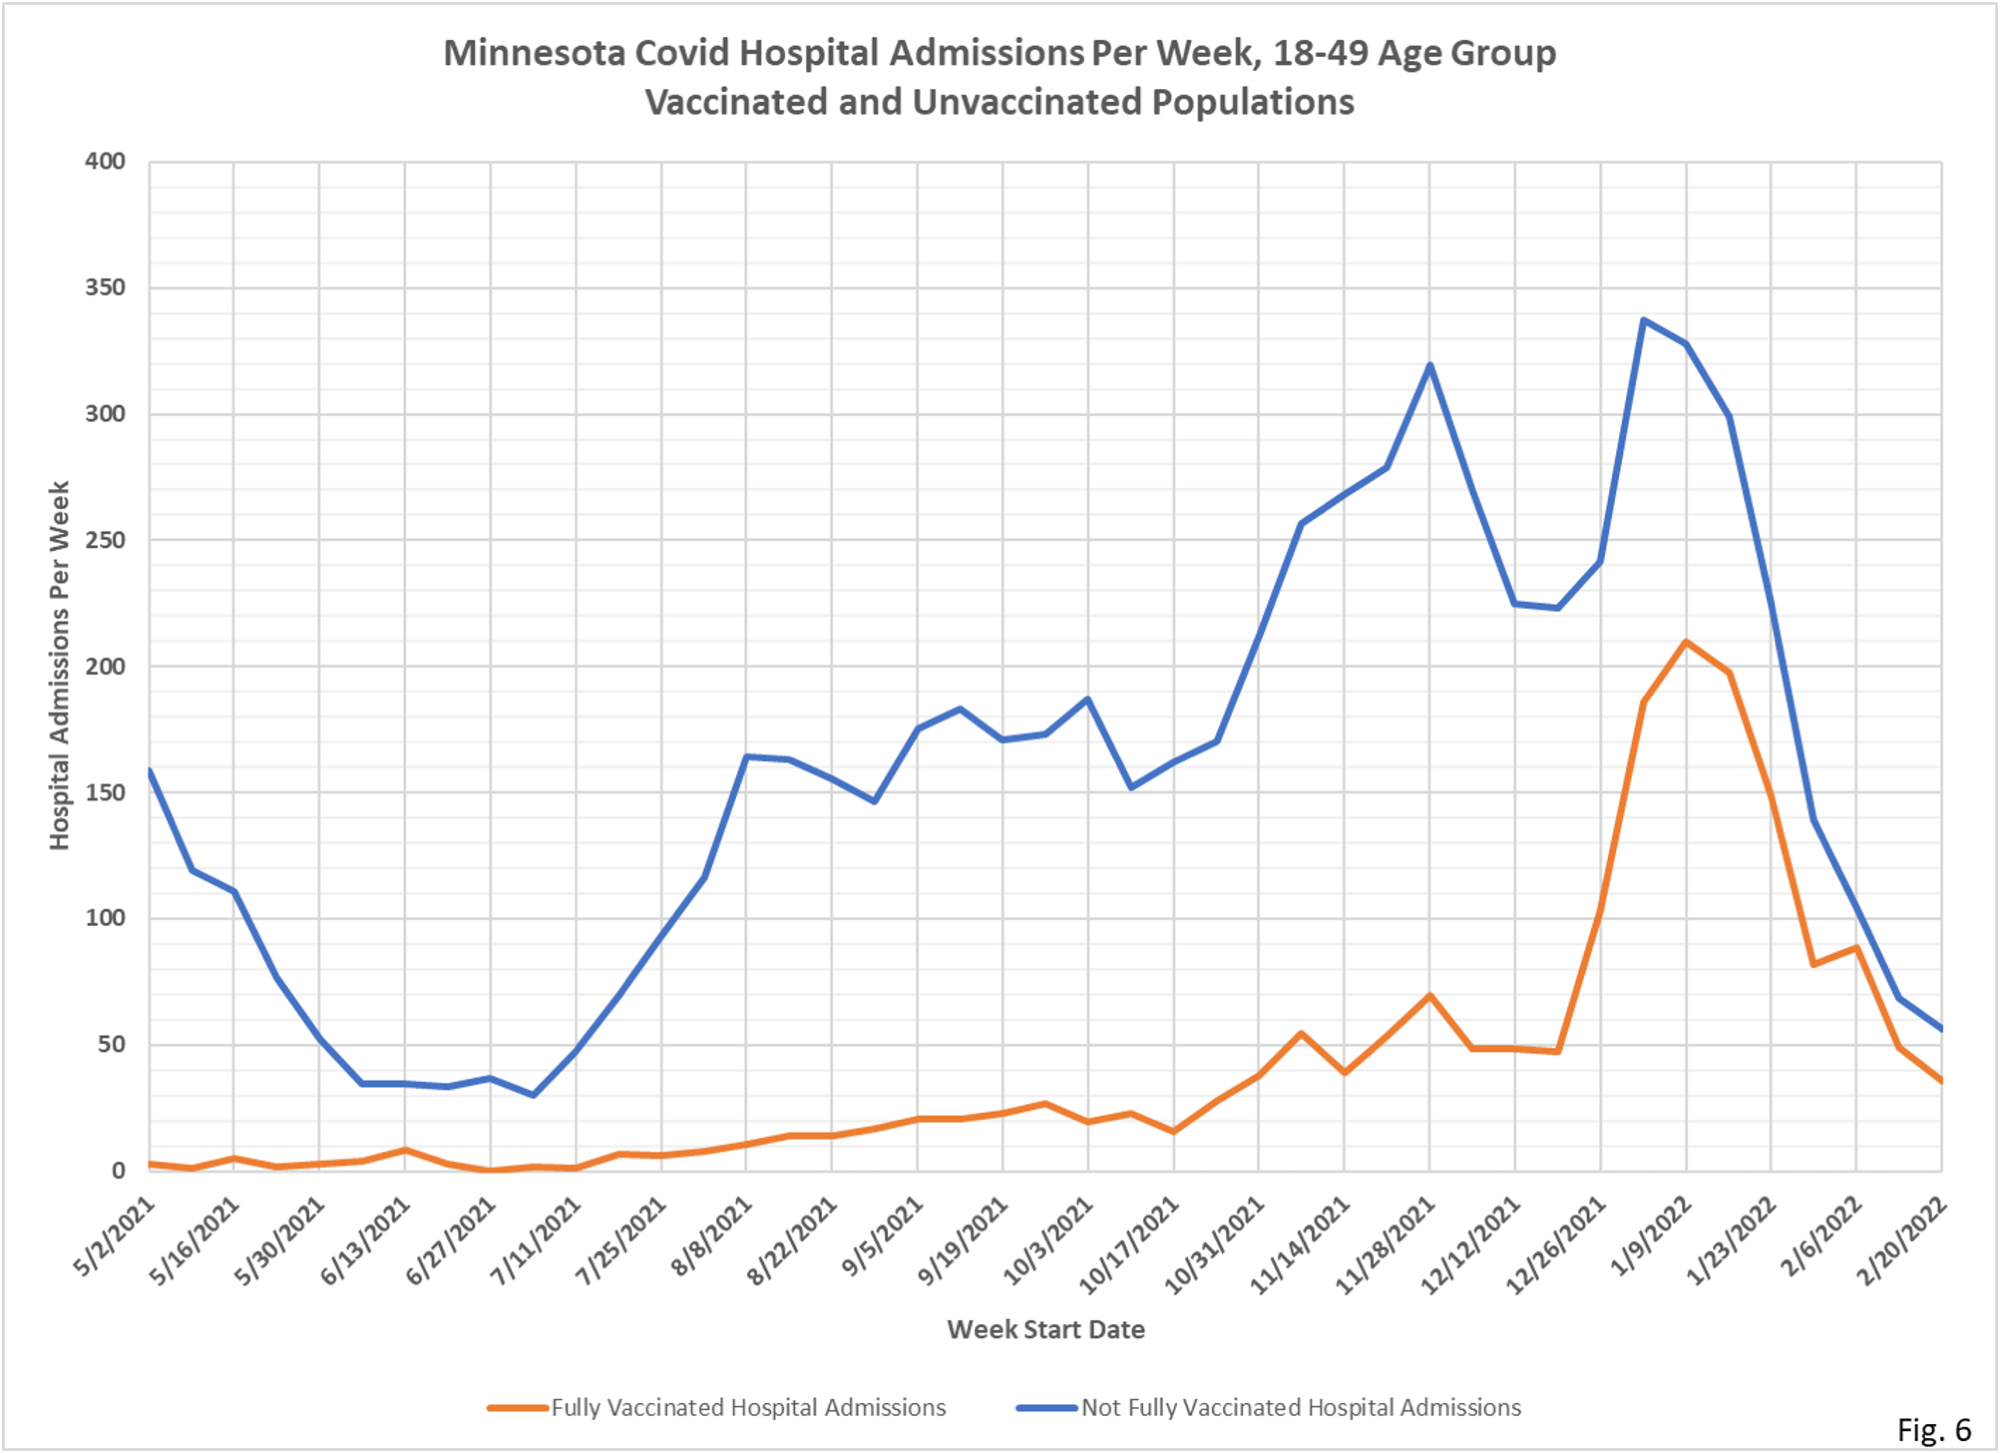
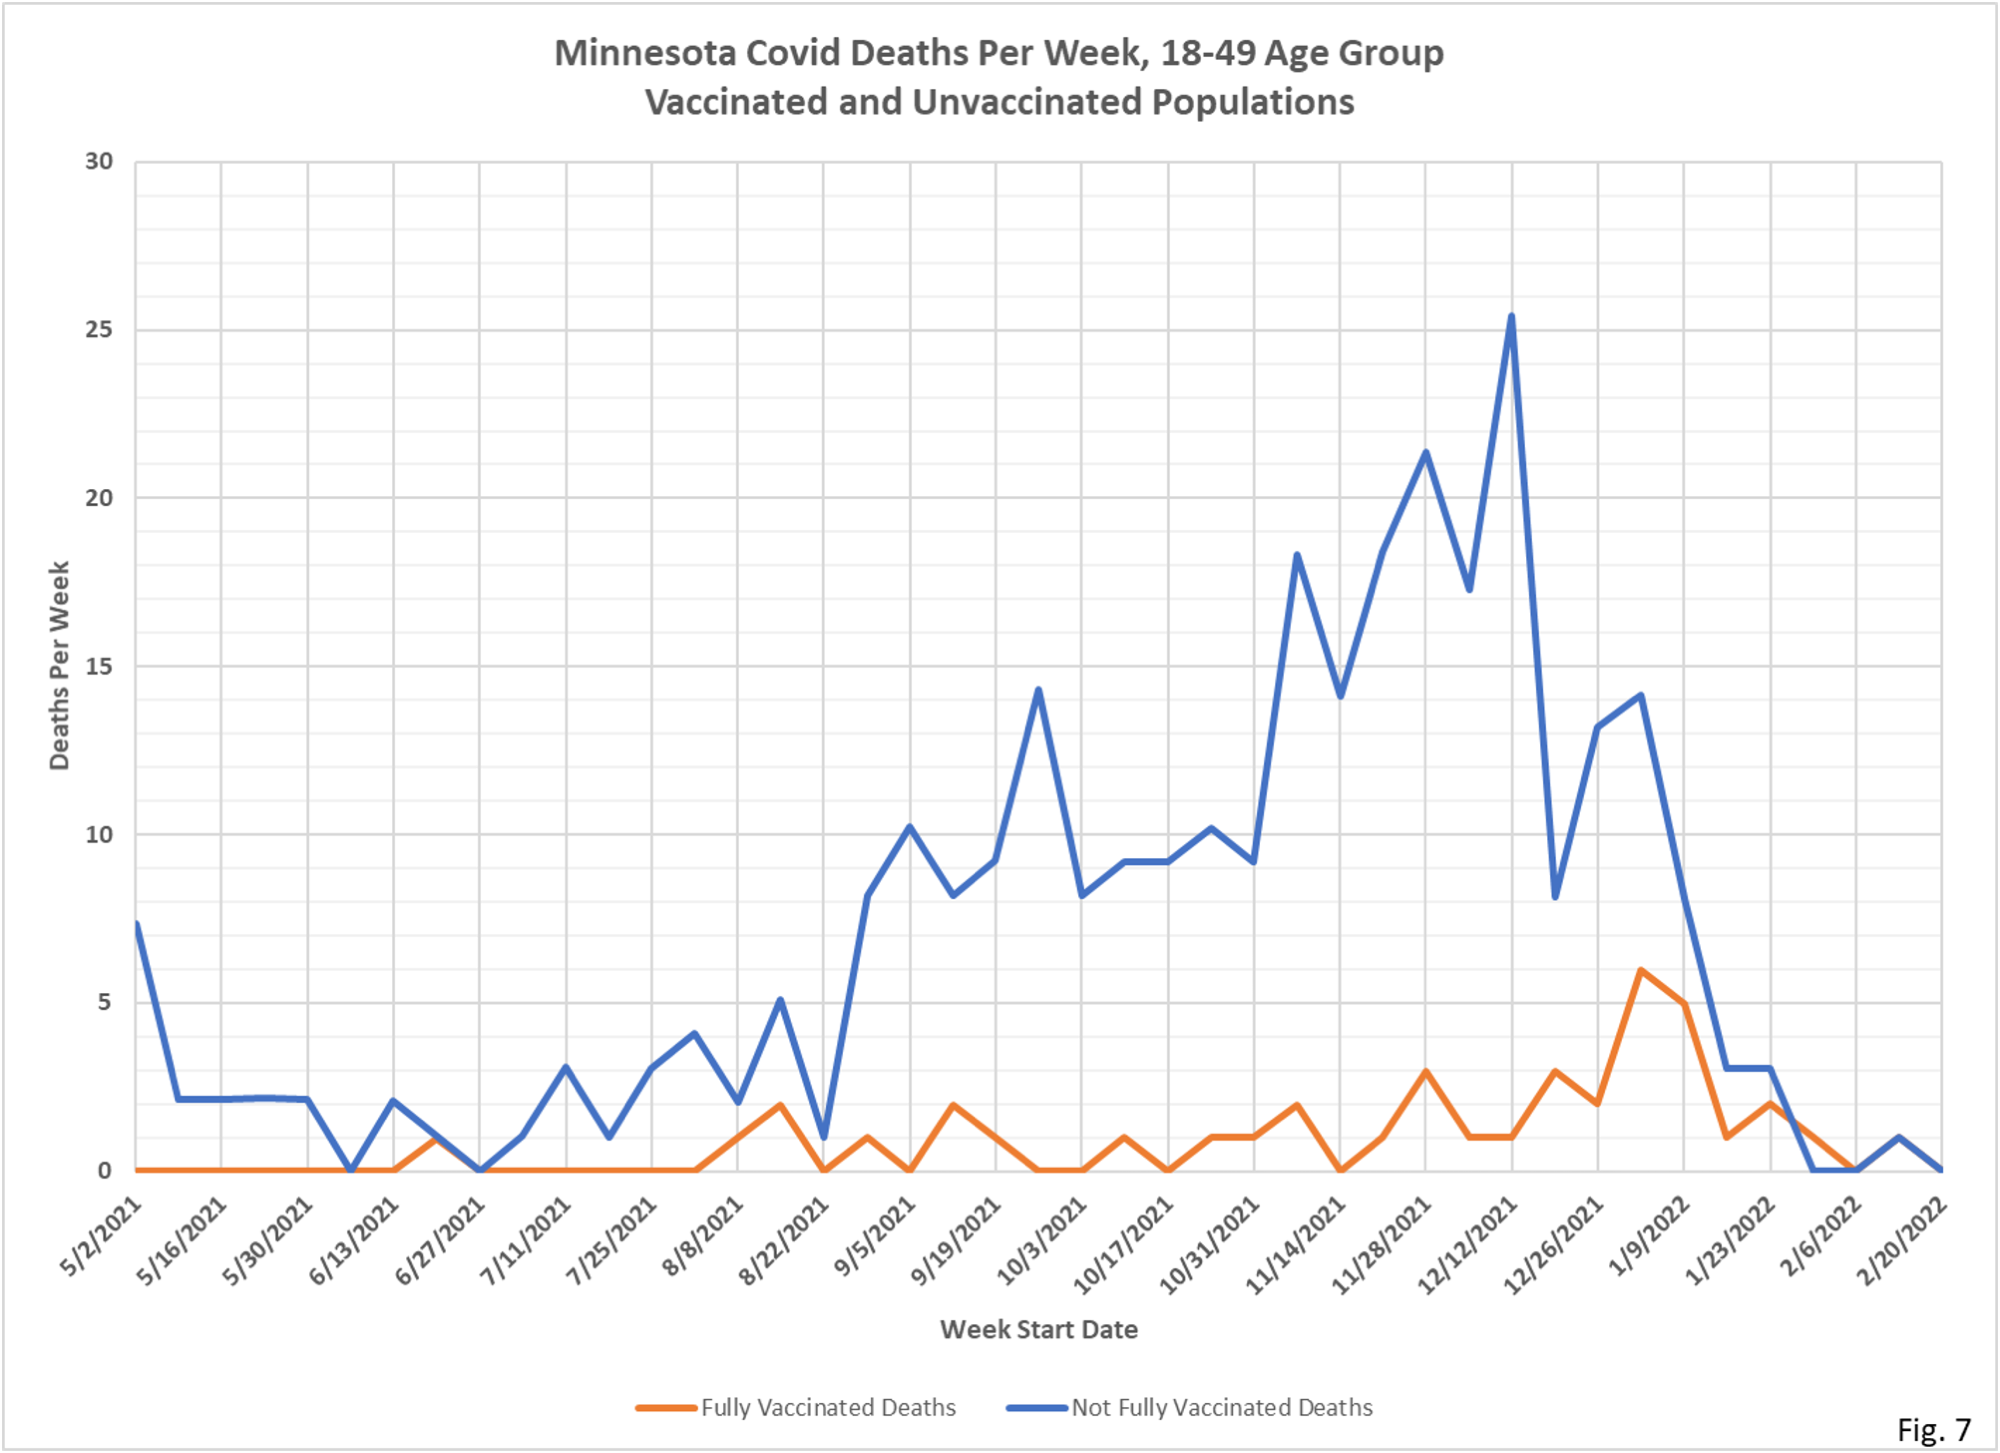
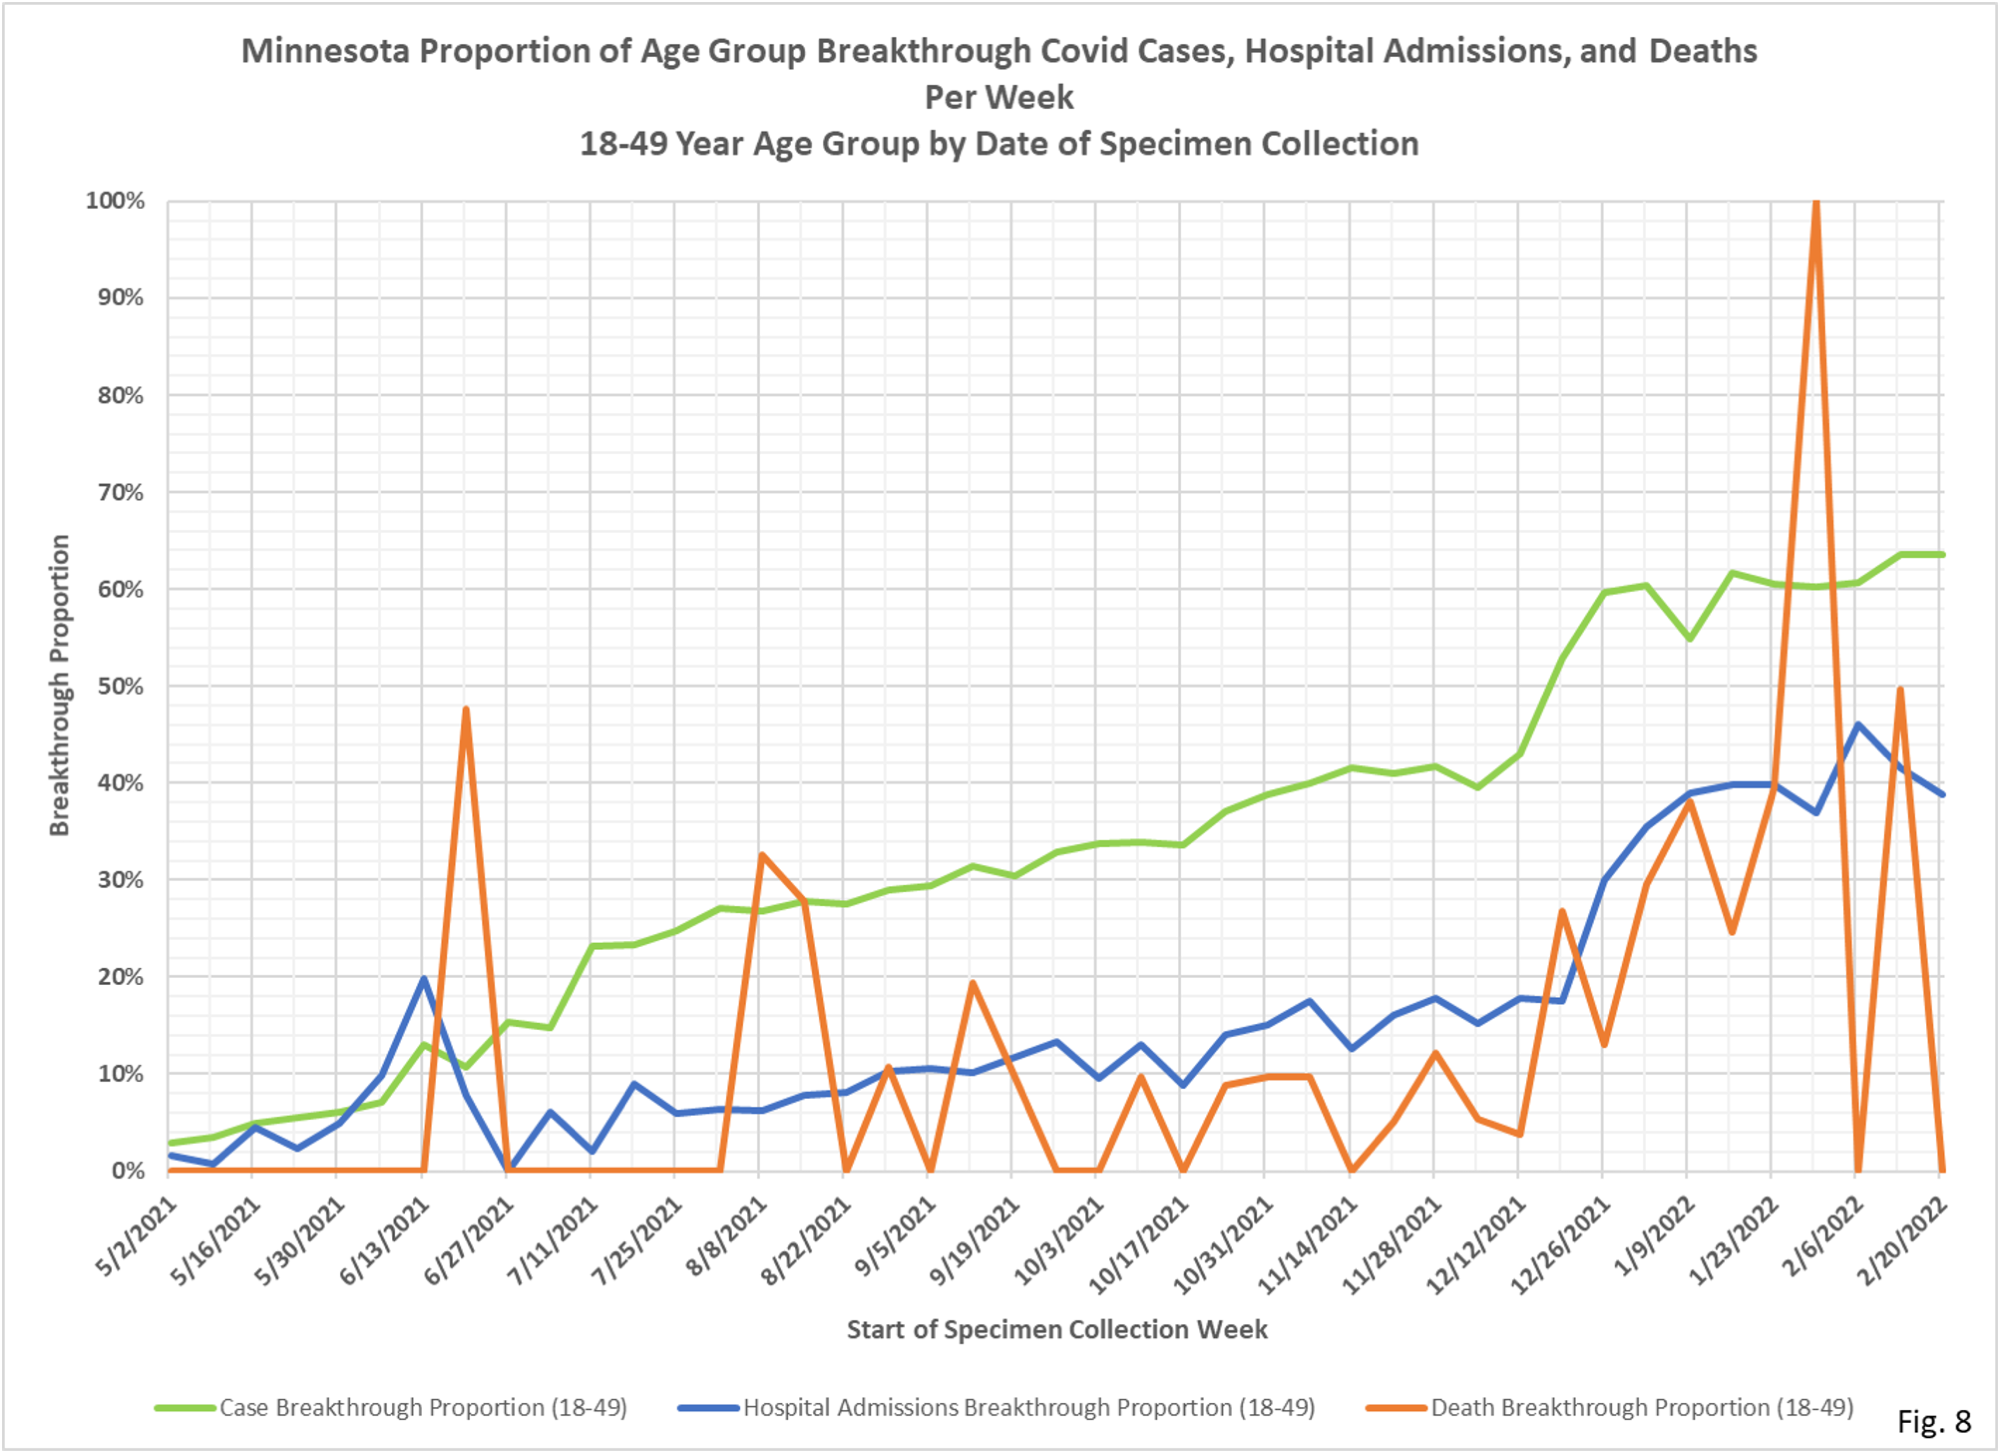
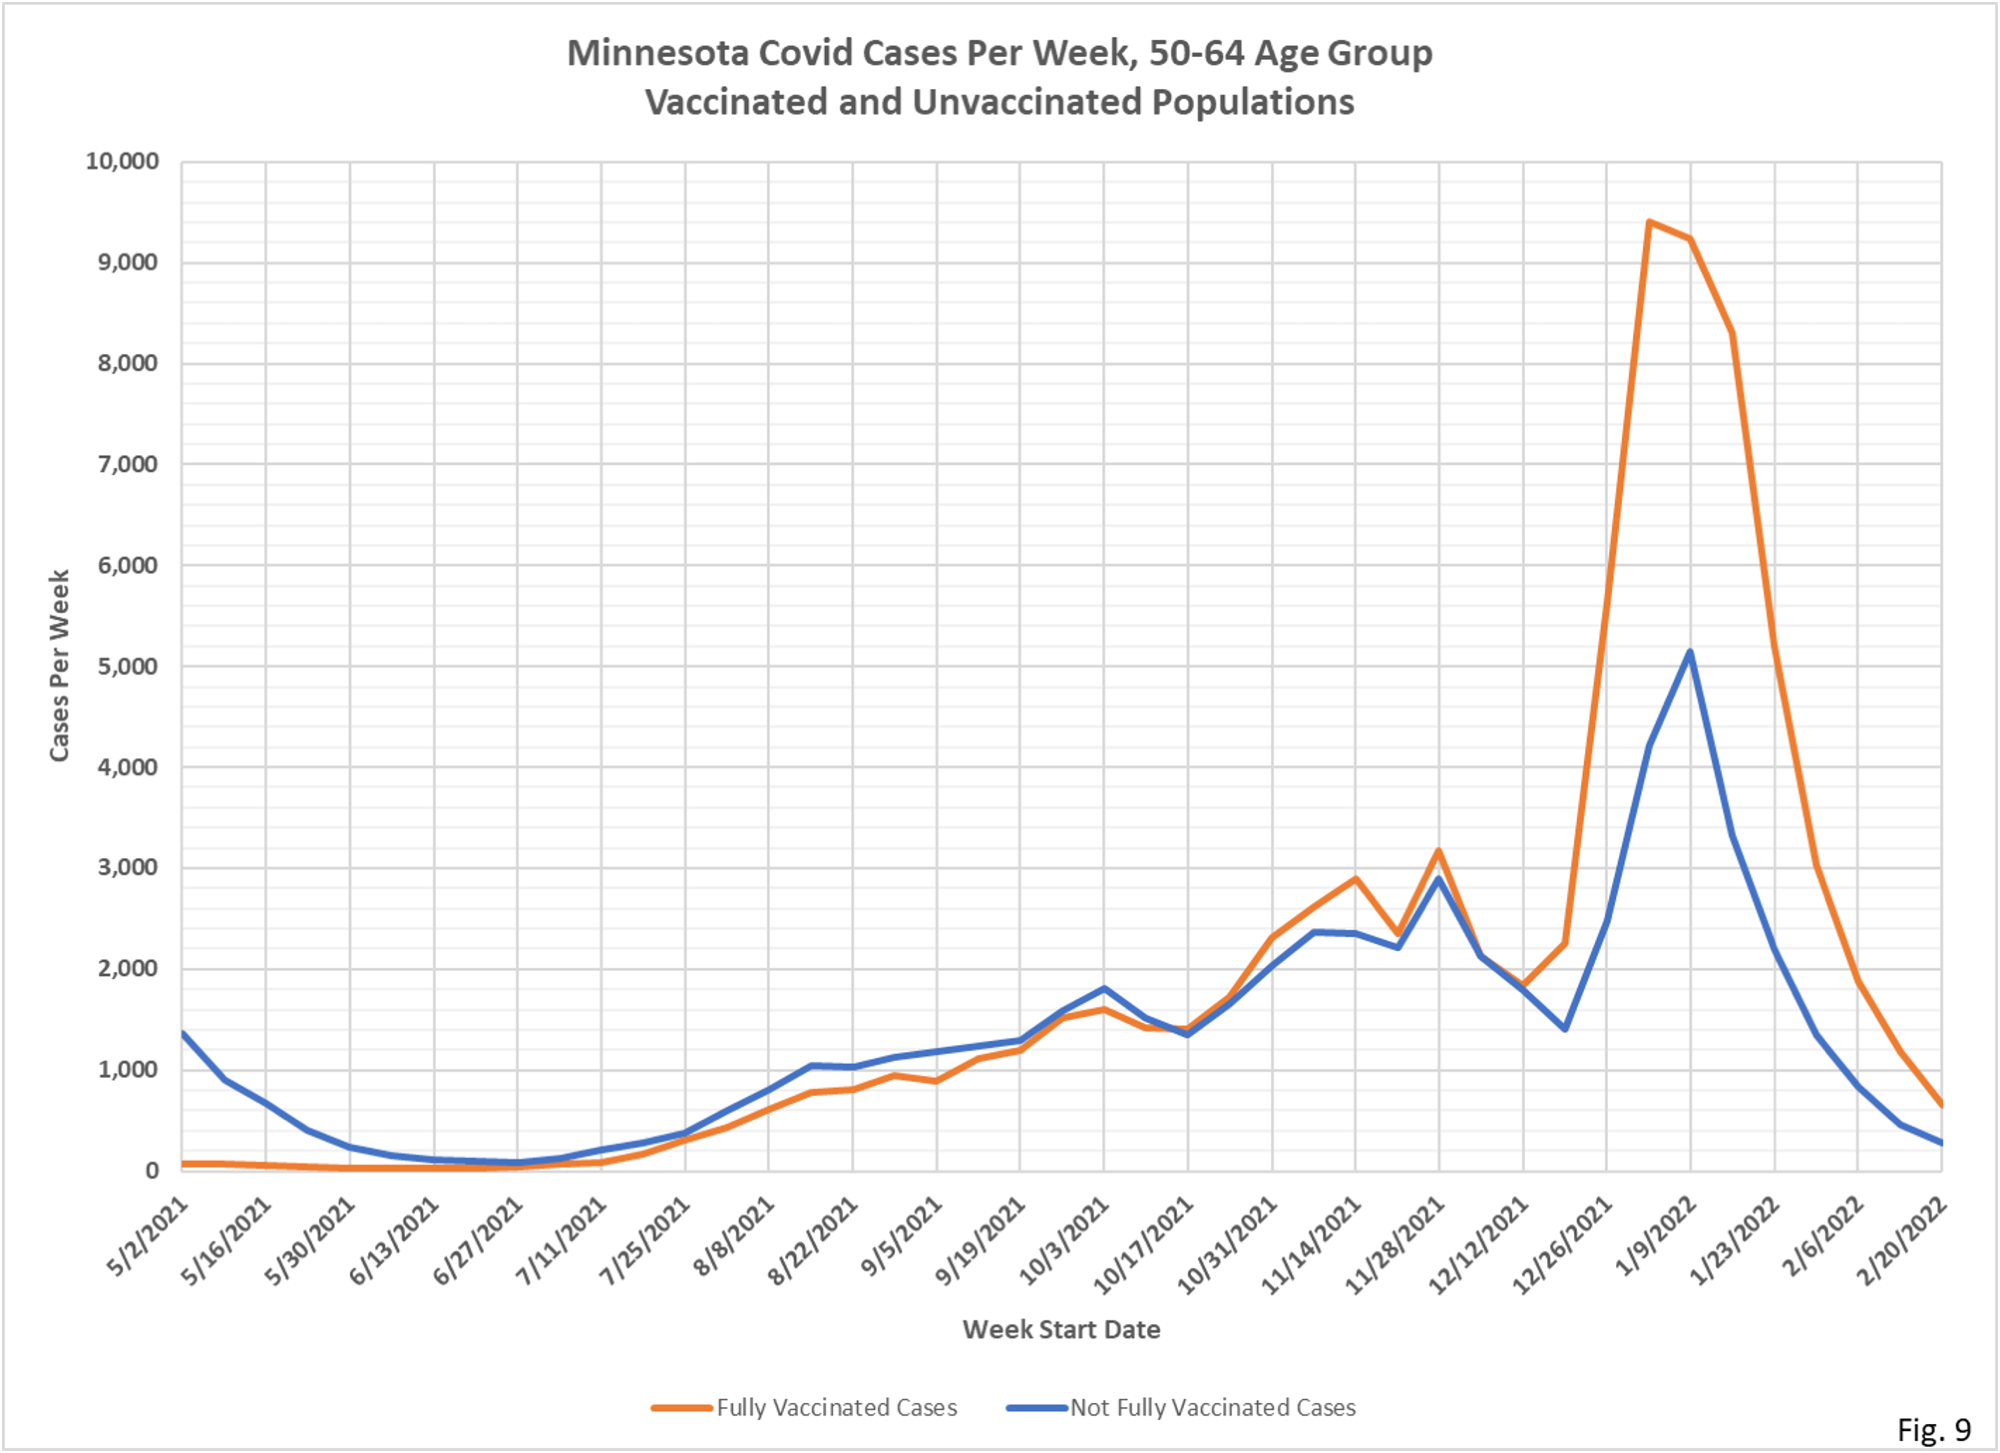
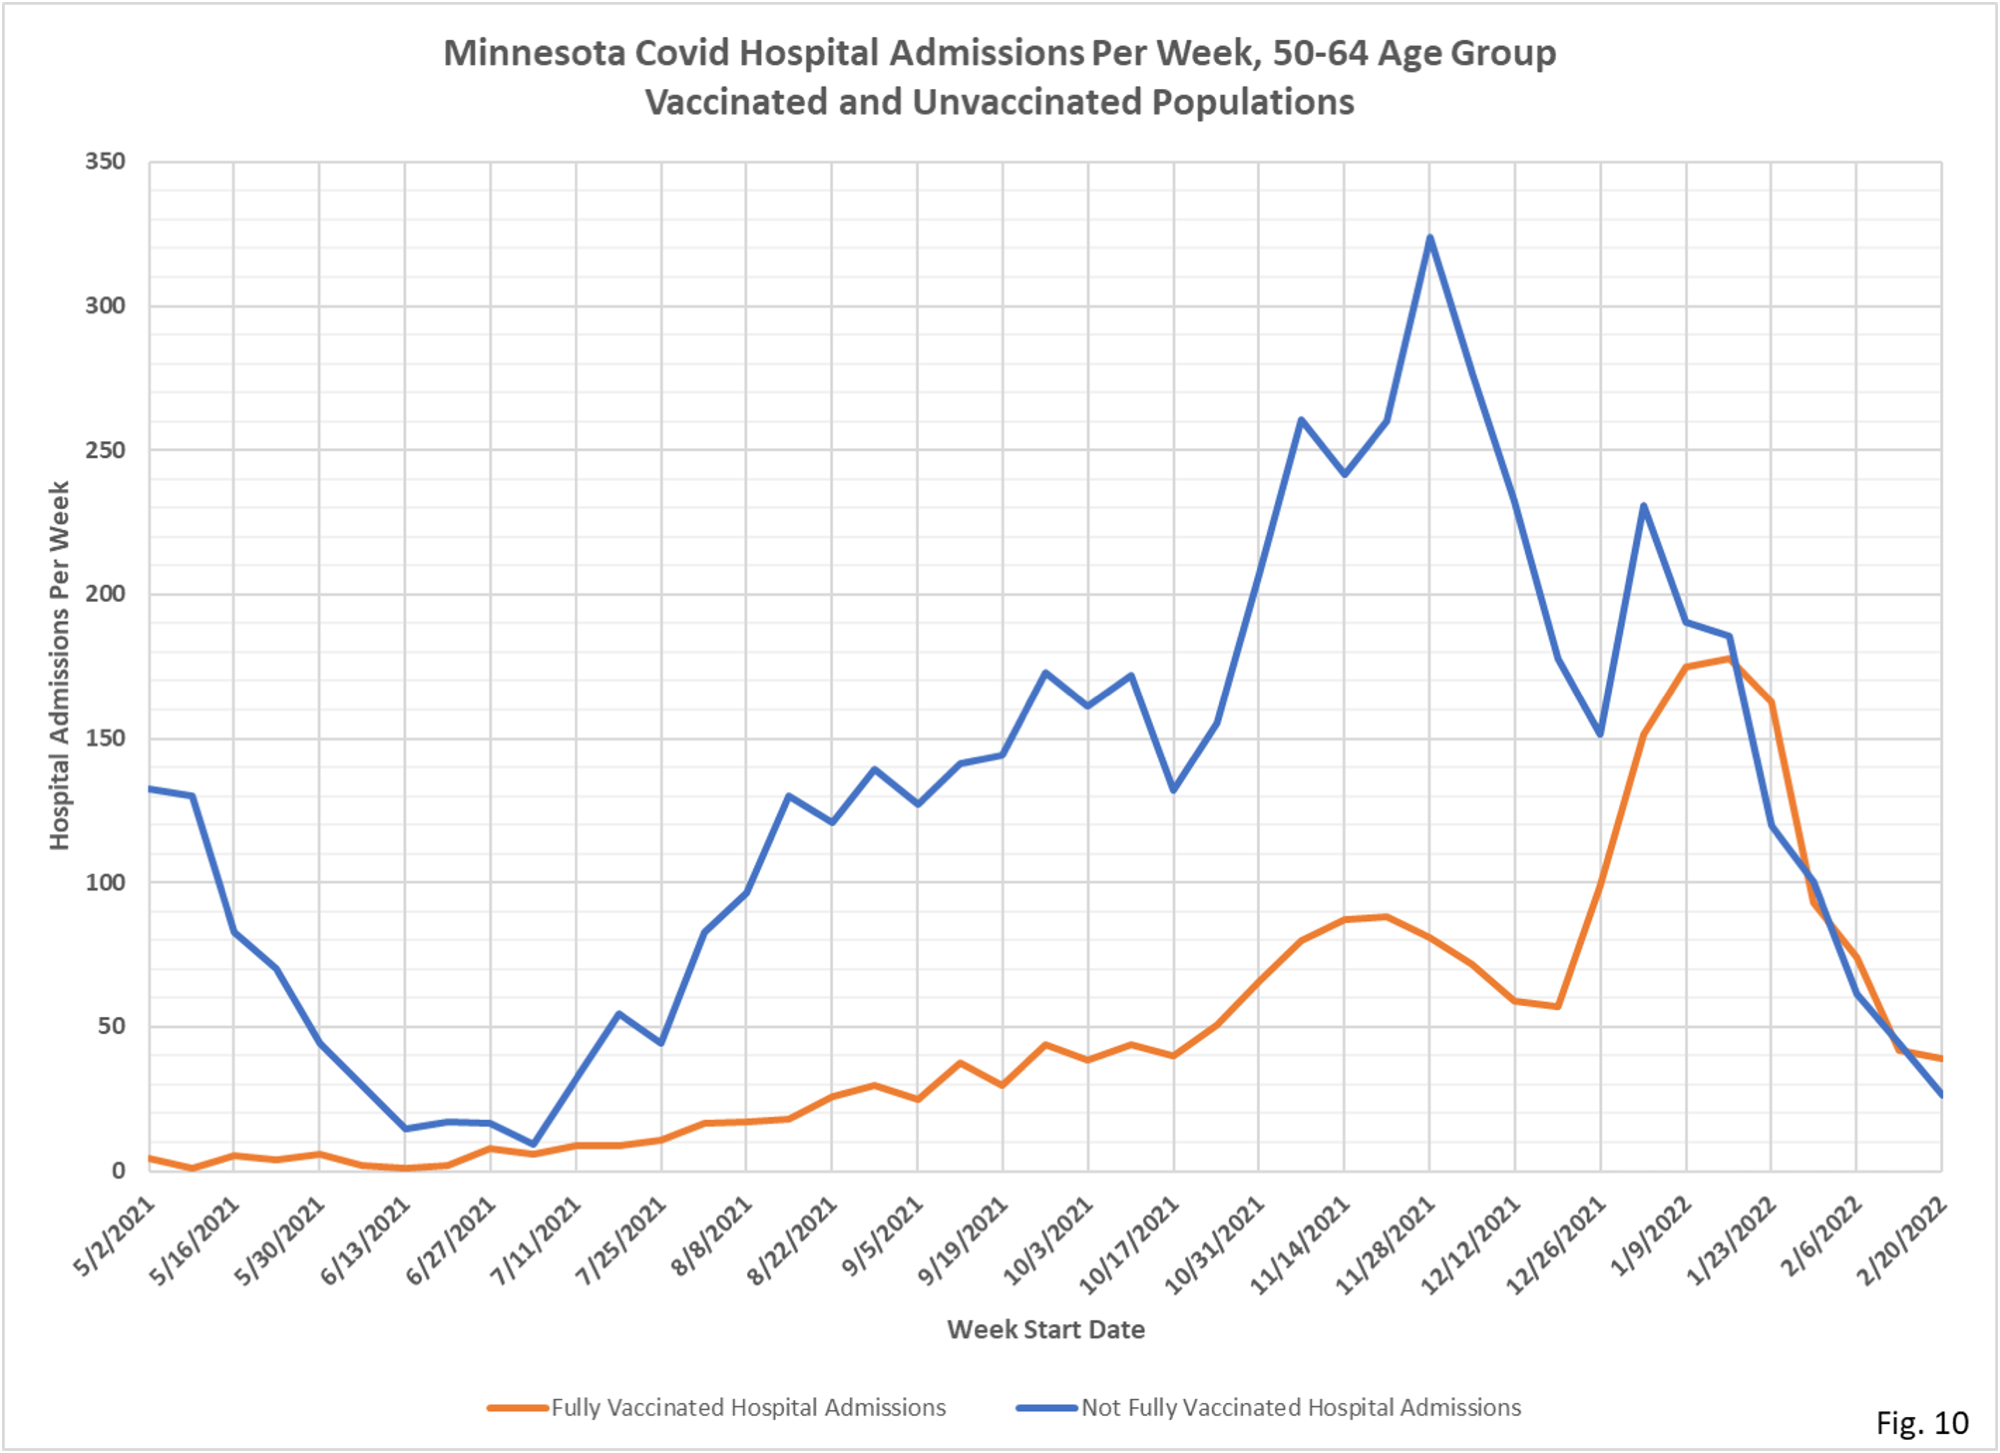
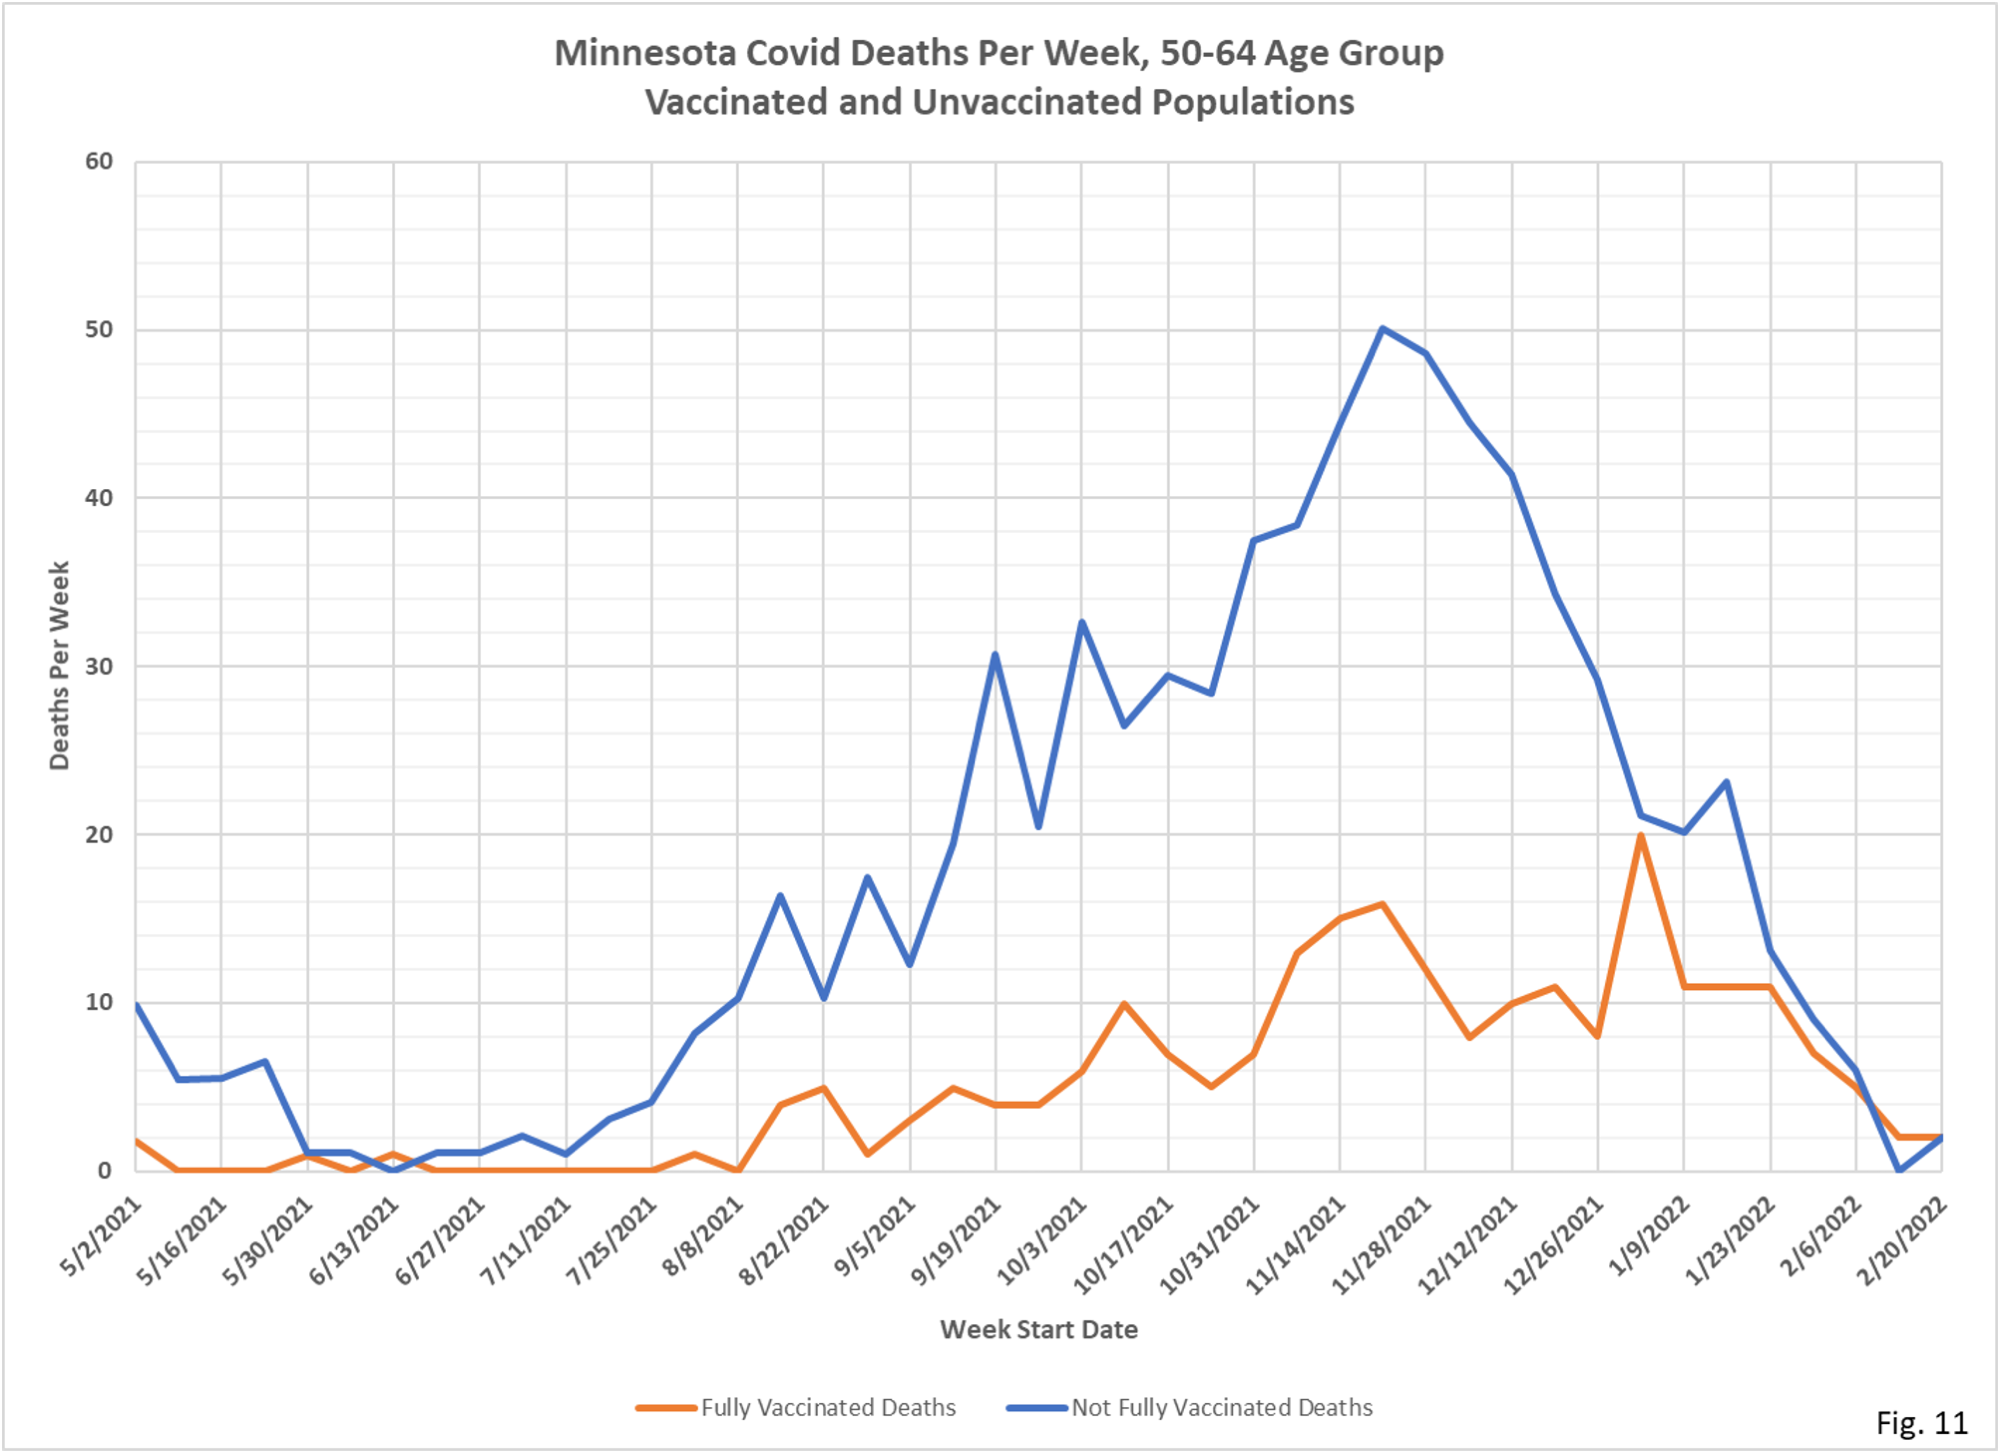
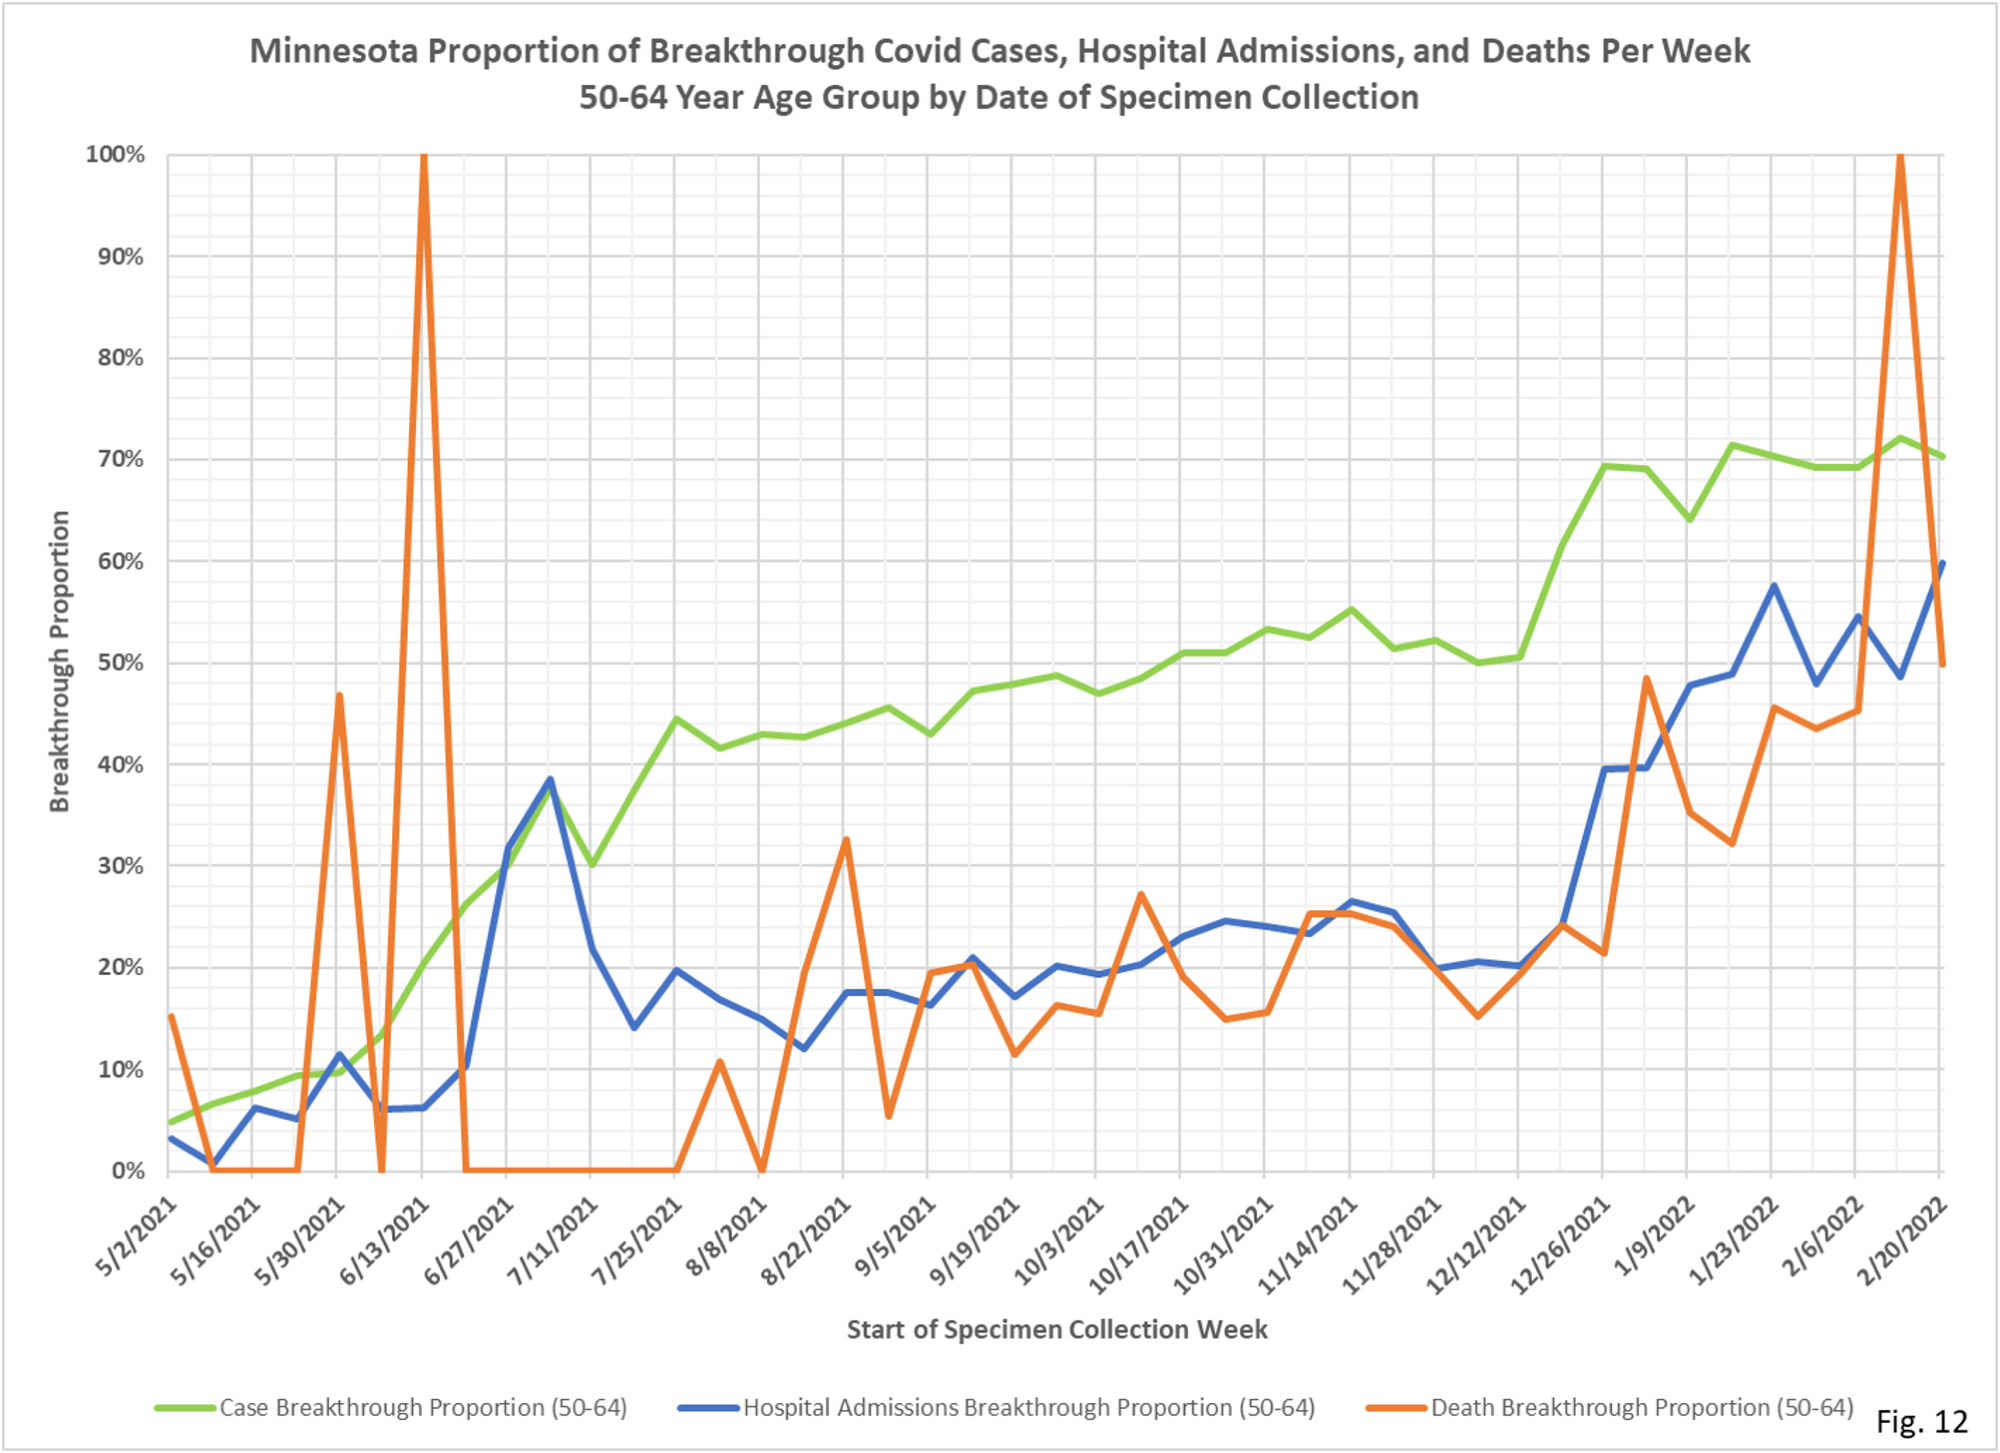
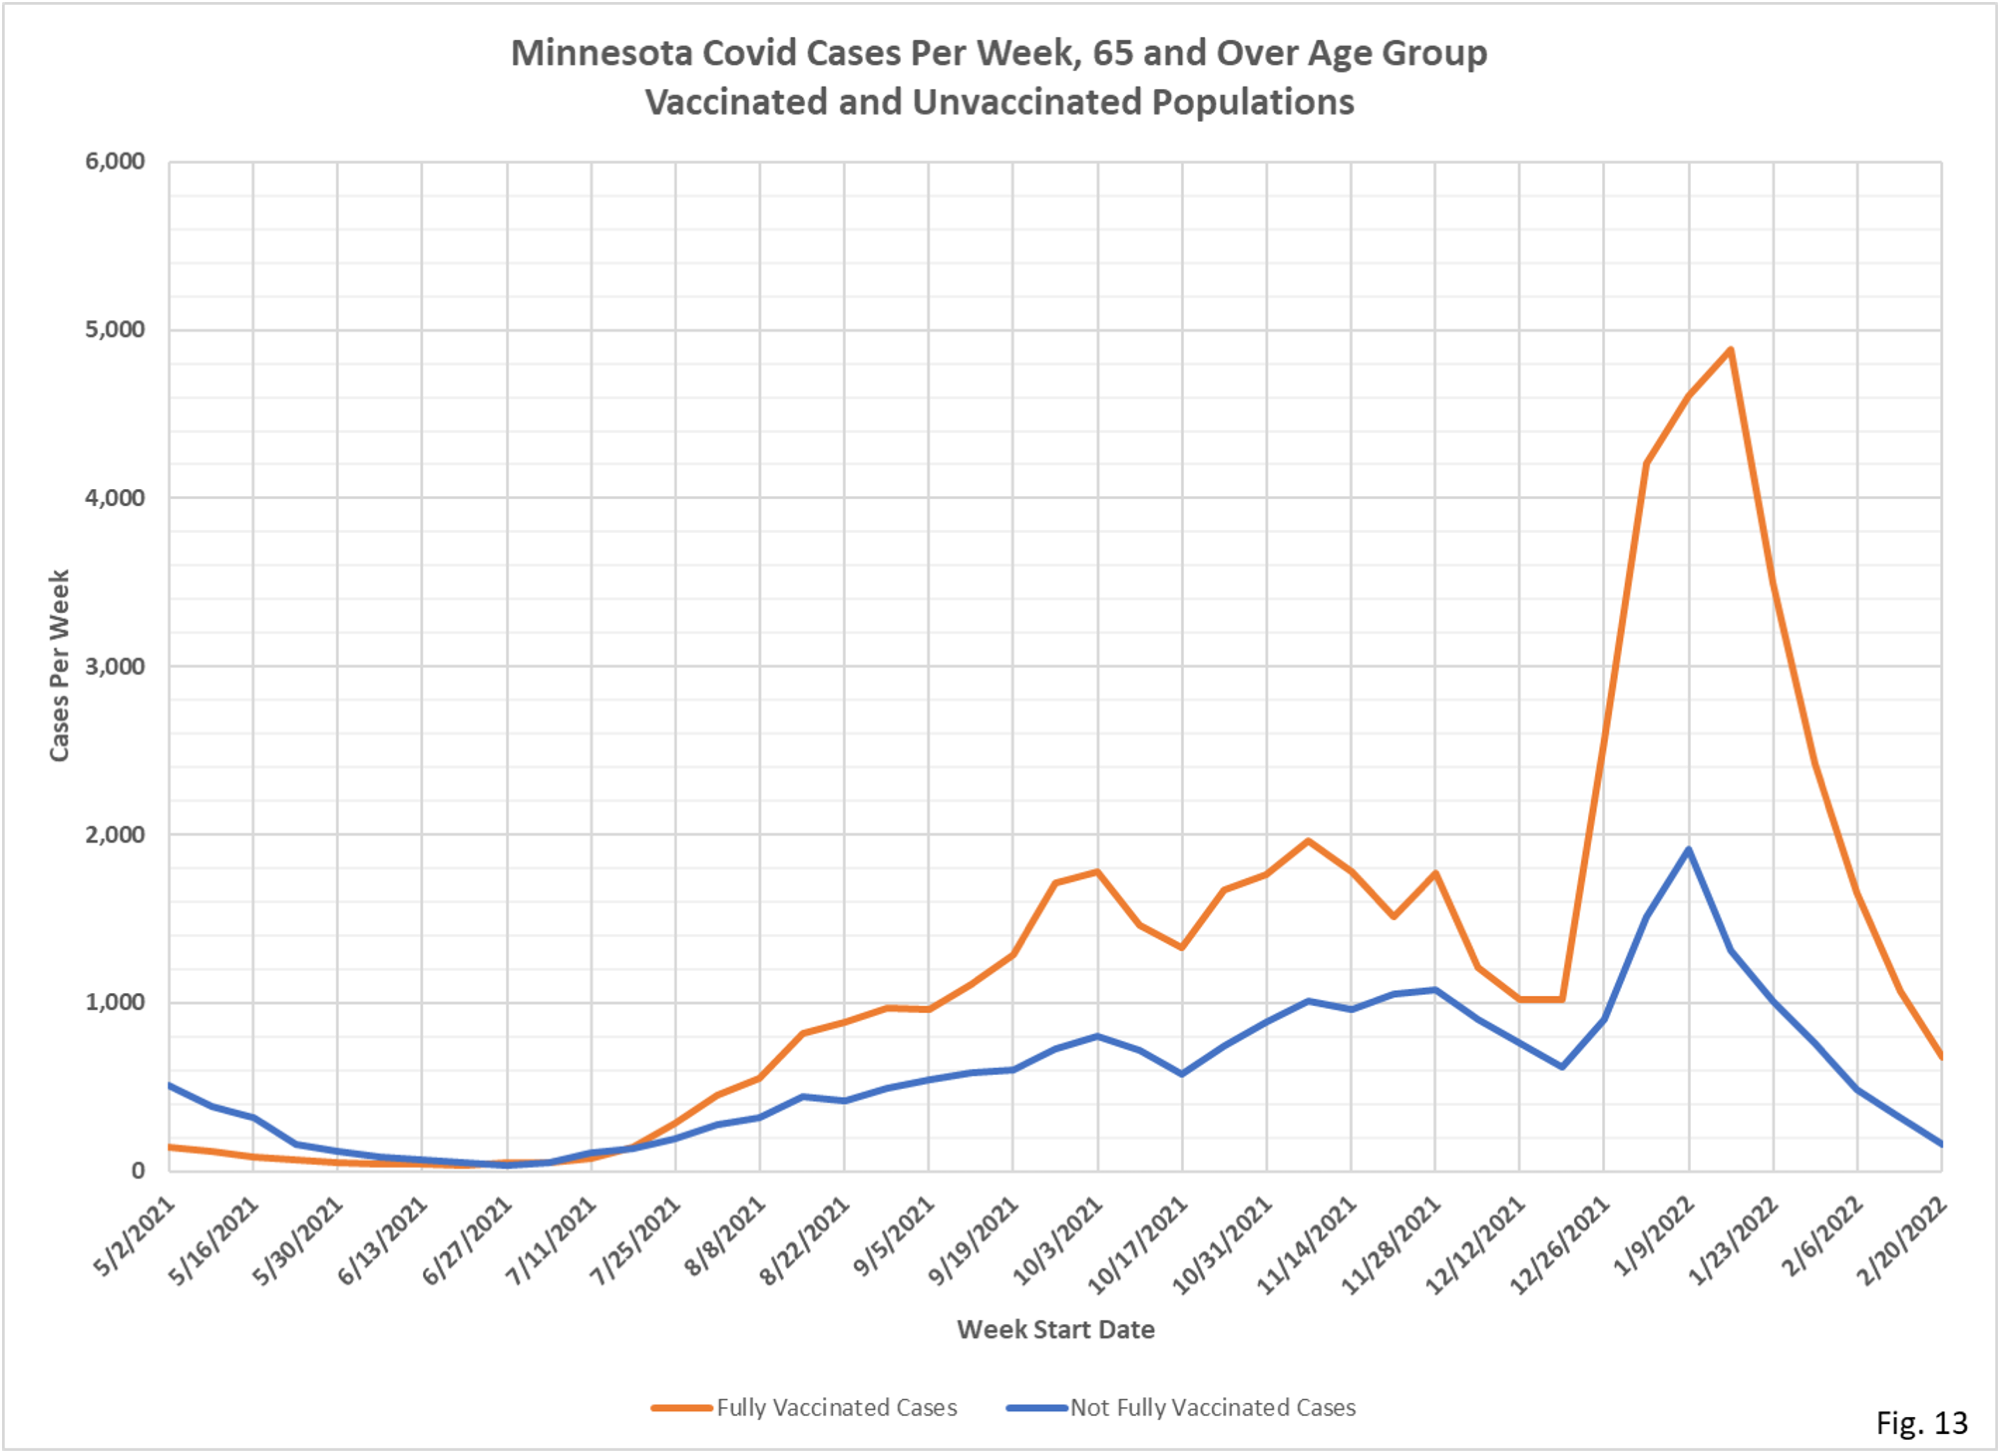
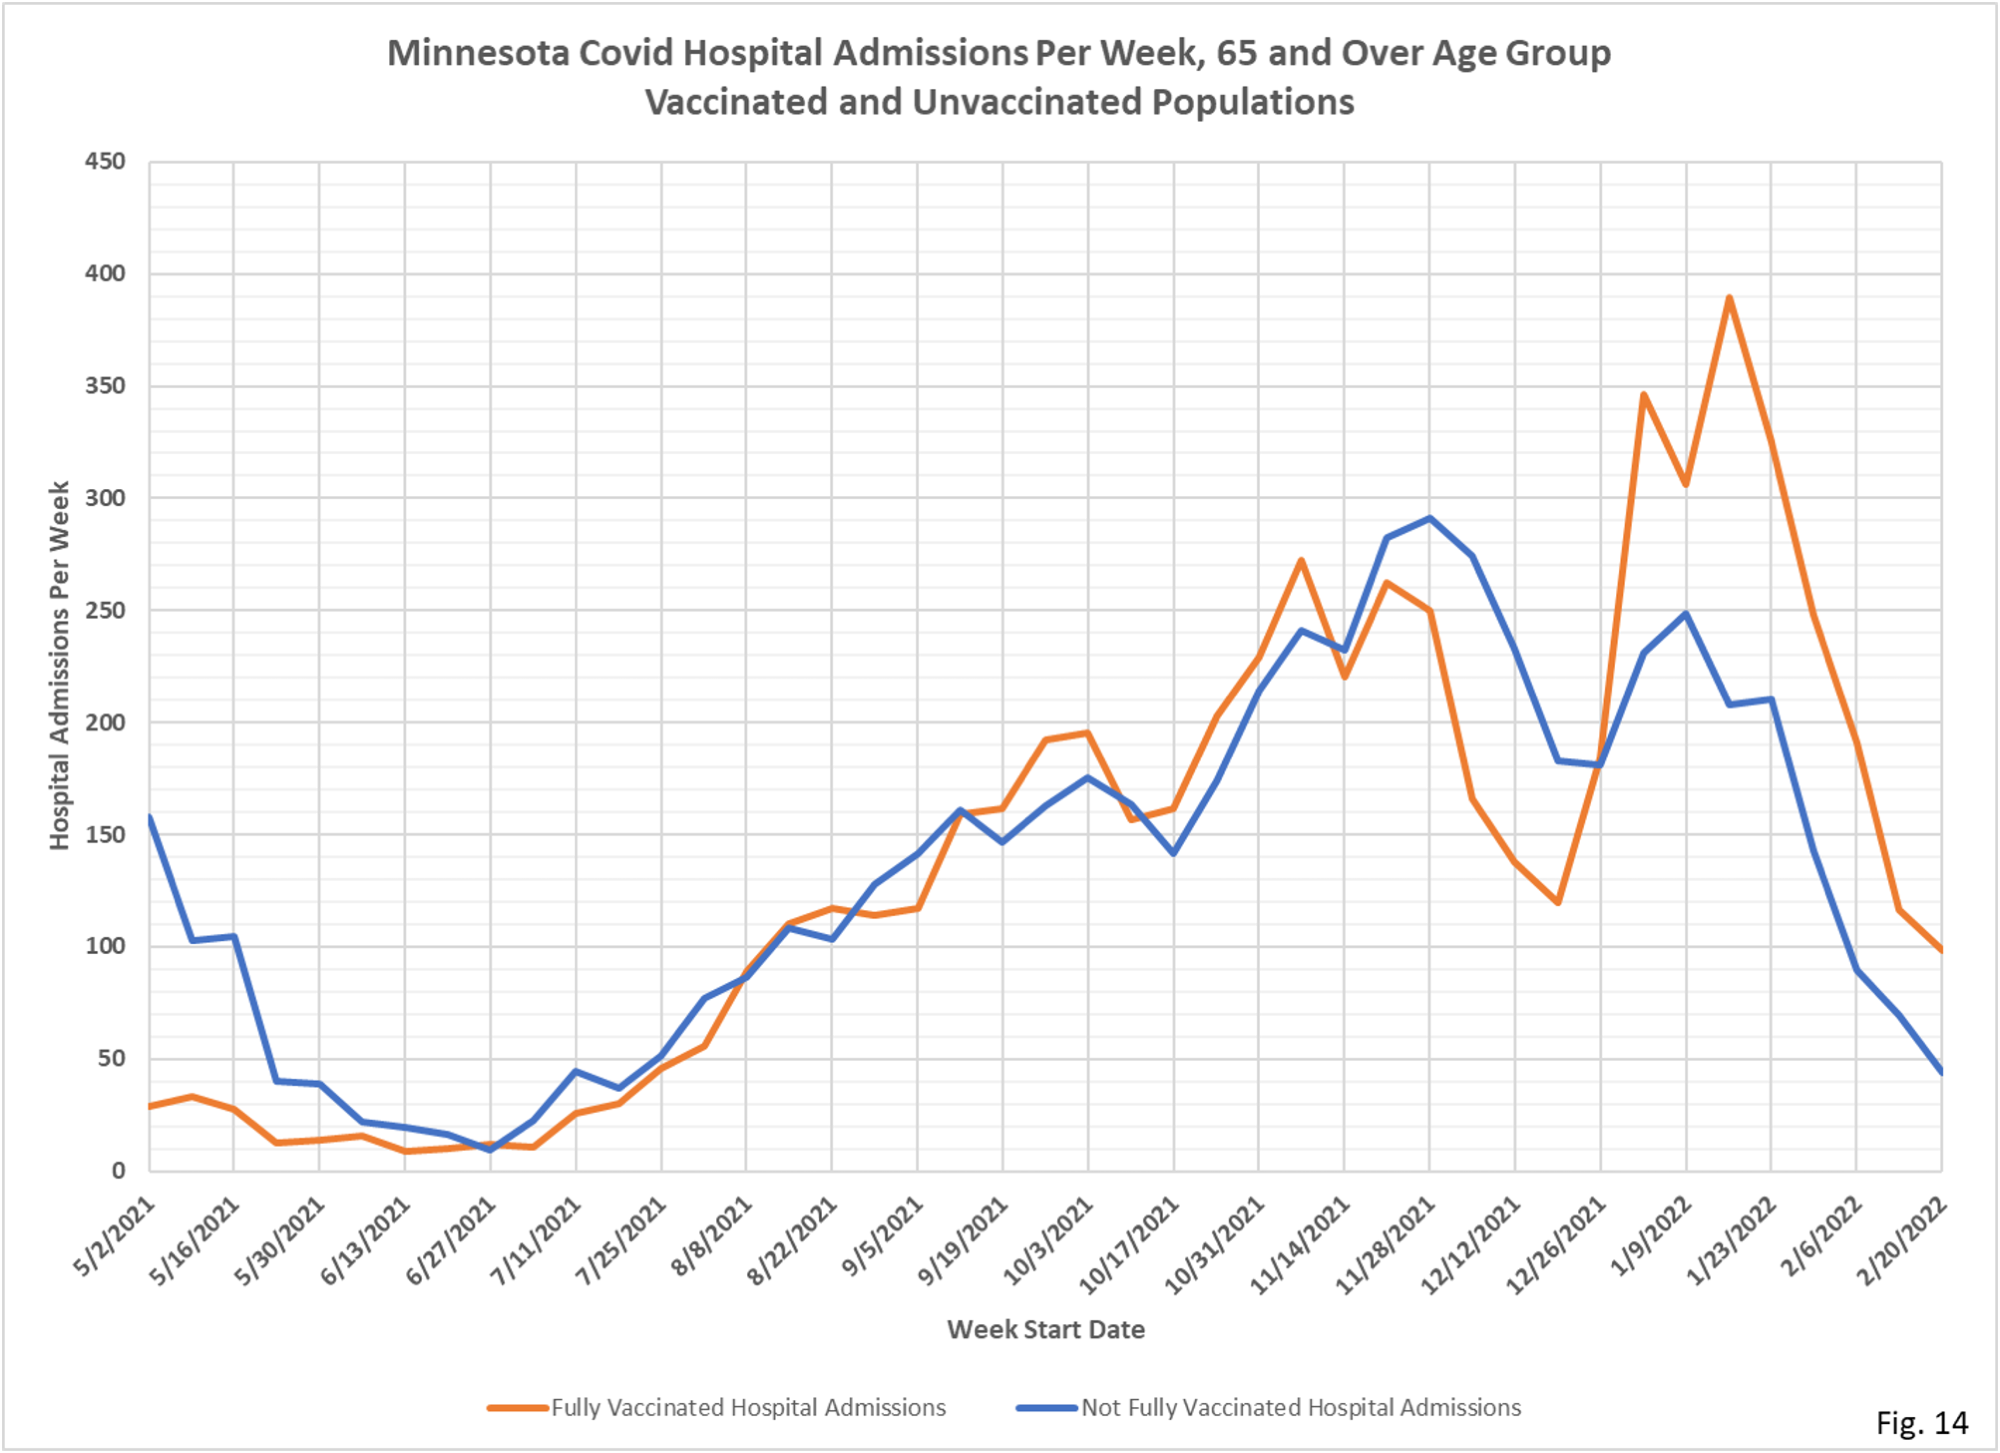
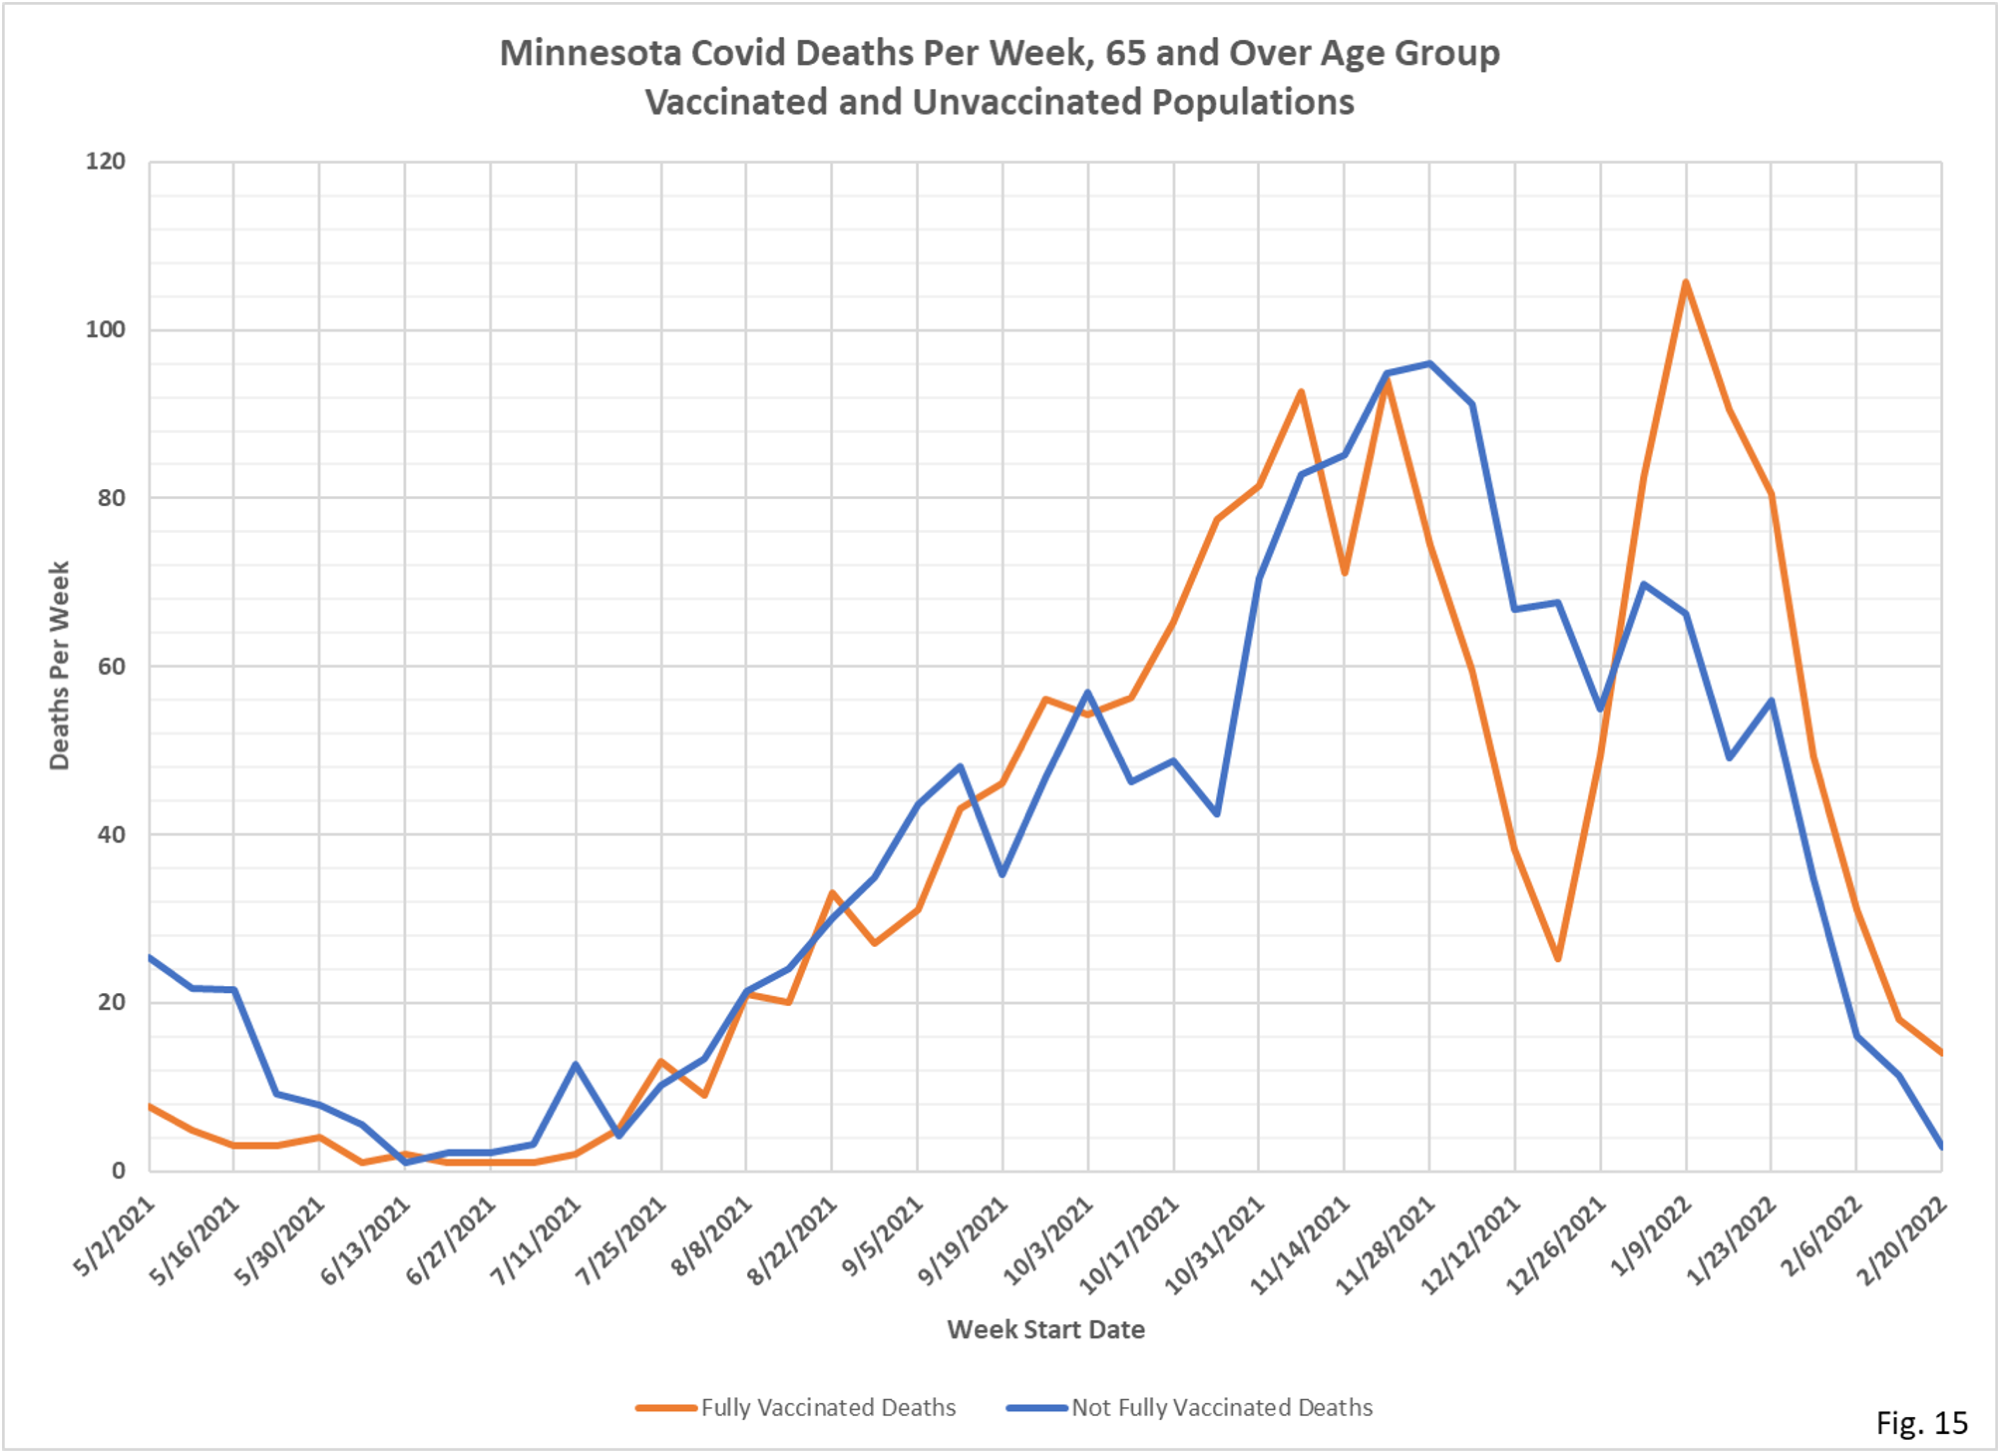
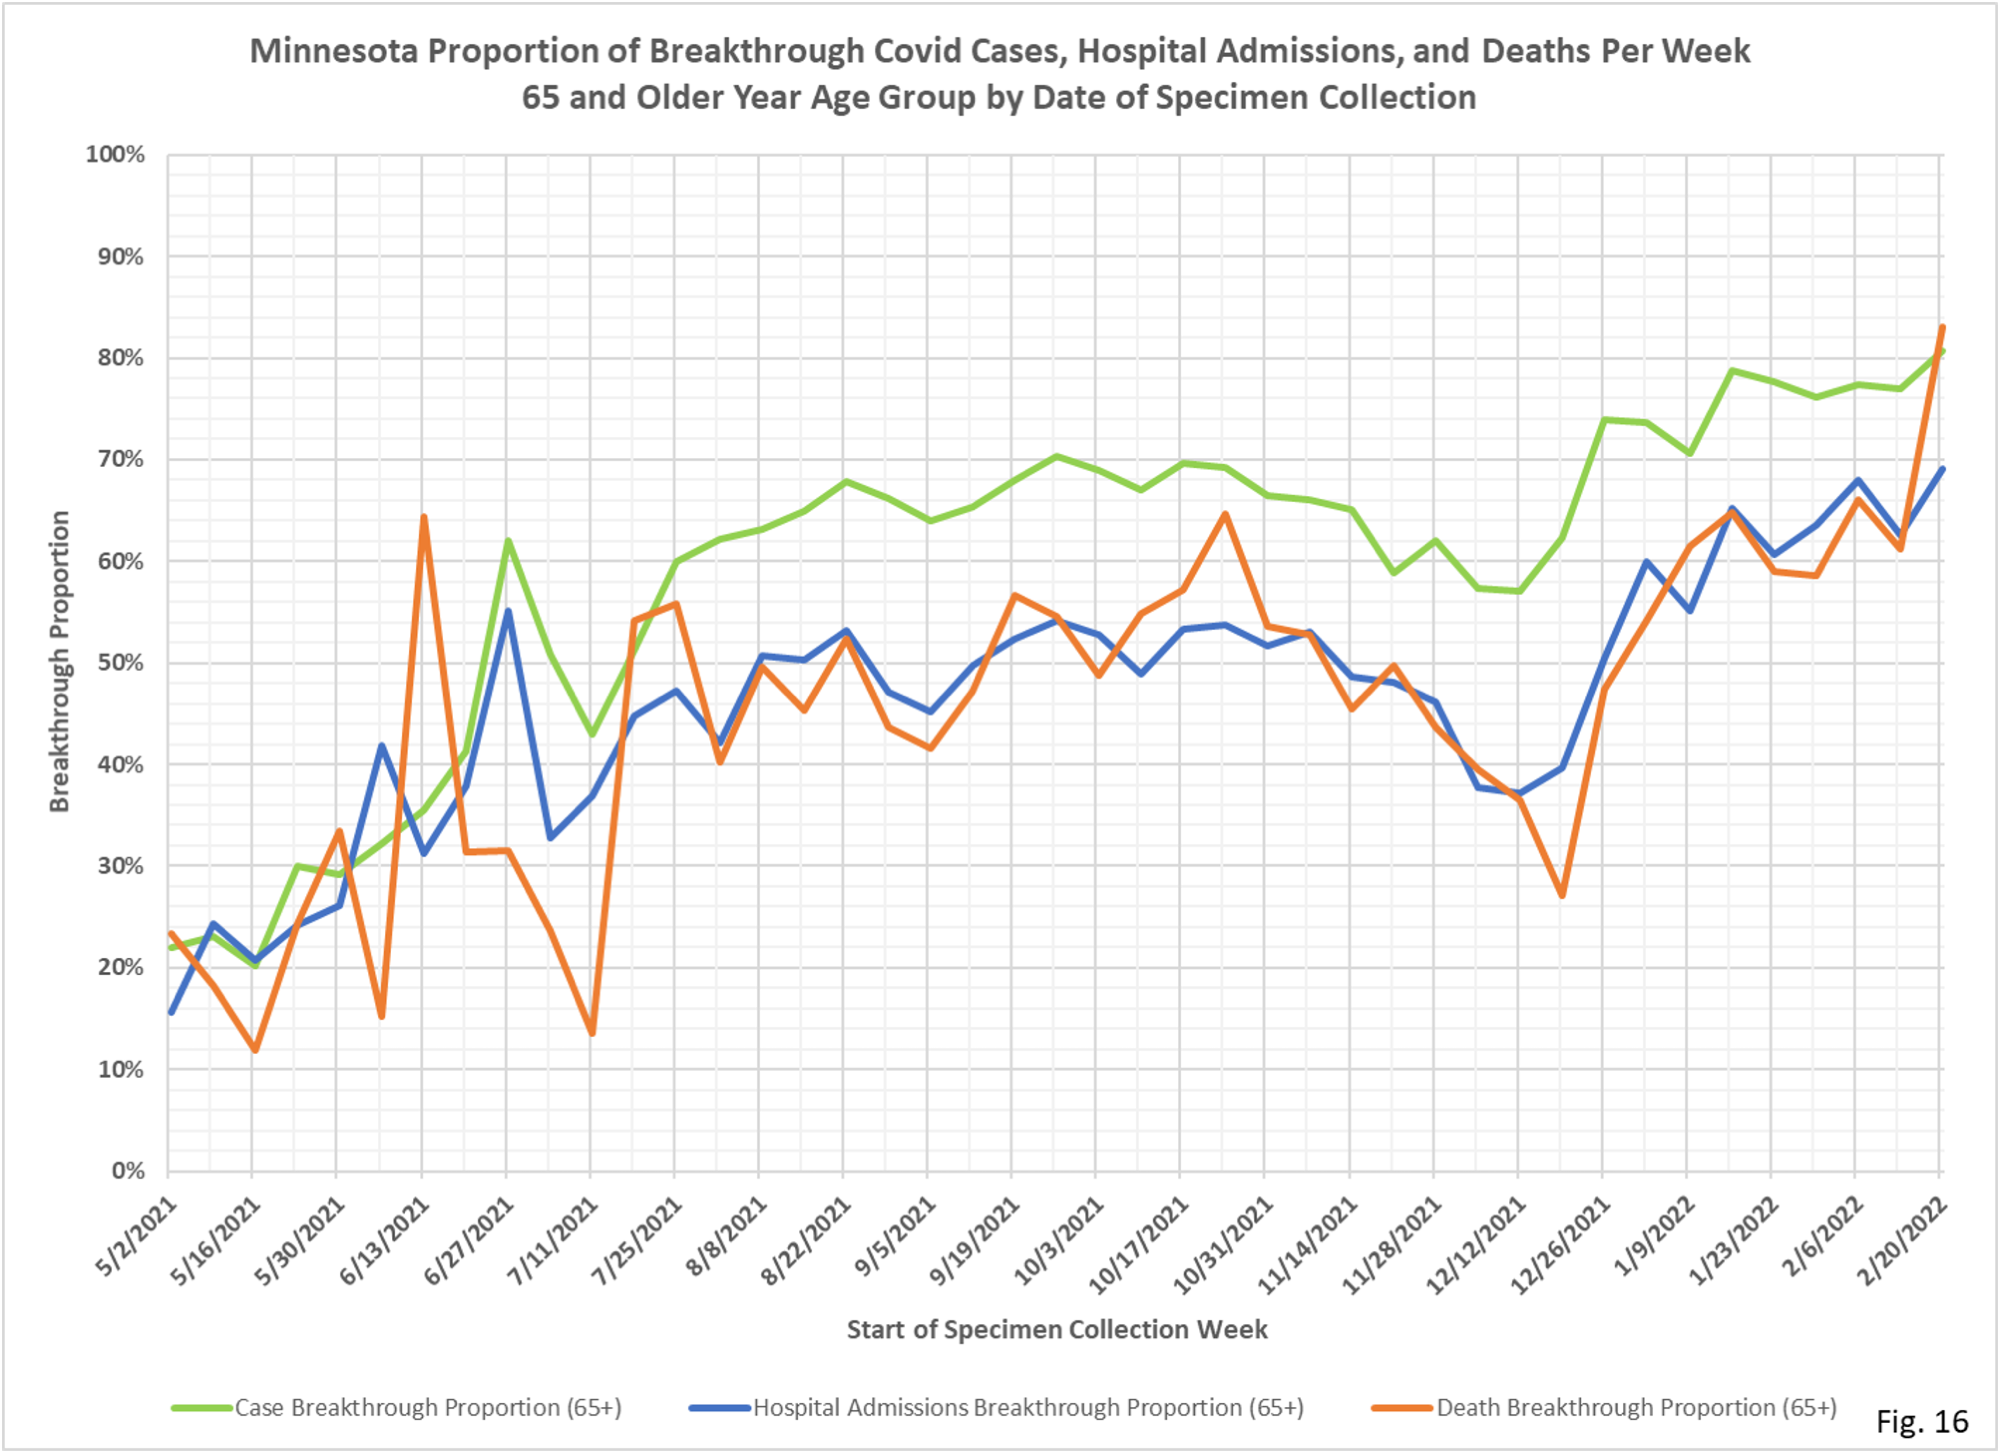
- In the charts that follow there are 4 slides for each age group; cases, hospital admissions, and deaths for the vaccinated and unvaccinated populations each week, and a single chart showing the breakthrough proportions each week.
- Fig. 1 thru 4, 12-17 Age Group: Vaccinated cases exceed unvaccinated since 12/19/2021. Hospital admissions are equal the past 2 weeks between the vaccinated and unvaccinated populations. Breakthrough cases are 63% of the total cases this week, and breakthrough admissions are 50% of the total.
- Fig. 5 thru 8, 18-49 Age Group: The case curves look quite similar to the 12-17 case curves, but vaccinated admissions and deaths are fewer than unvaccinated.
- Fig. 9 thru 12, 50-64 Age Group: Similar to the 18-49 age group, vaccinated cases exceed unvaccinated by a large margin throughout the Omicron surge stating in late 2021, and vaccinated admissions and deaths roughly equal unvaccinated admissions and deaths only starting on the tail end of Omicron in mid-January 2022.
- Fig. 13 thru 16, 65 and Over Age Group: Vaccinated cases greatly exceed unvaccinated cases since July 2021, partly because the vaccinated population is much larger, and waning vaccine immunity probably contributes as well. In contrast to the other age groups, vaccinated admissions and deaths are roughly equal to unvaccinated admissions of deaths through the entire date range. Of course, the unvaccinated population is much smaller than the vaccinated population, reflecting the higher per capita rates among the unvaccinated.
- The data source for all charts is the data file vbtcirates.xlsx, found on the Minnesota Department of Health (MDH) web page: https://www.health.state.mn.us/diseases/coronavirus/stats/vbtcirates.xlsx . This data file gives the rates per 100k of cases, hospitalizations, and deaths in full vaccinated and not fully vaccinated people, broken out by age group. The rates per 100k in vbtcirates.xlsx are converted into cases, hospitalizations, and deaths by multiplying by the appropriate population. The number of vaccinated people by age group can found on the Vaccine Data page, https://mn.gov/covid19/vaccine/data/index.jsp , in the data file People Vaccinated by Age. The unvaccinated population is found by taking the US Census American Community Survey 5-Year Estimate (Data Table S0101, https://data.census.gov/cedsci/table) and subtracting the vaccinated population. The breakthrough proportion is then found by dividing the breakthrough events by the total of the breakthrough and non-breakthrough weekly events.
- MDH defines a breakthrough event as a Covid case, hospital admission, or death that occurs 14 or more days after completing the vaccination series (not including boosters).
