Another set of the epidemic portrayed by age group. It continues to wind down, notwithstanding the fervent prayers of the coronamonomaniacs. Dave’s notes are here, with notes on sources below the charts:
- Overall, all Covid measurements for the week were lower, except ICU admissions which were flat for the week. Cases especially are still declining with no sign of any resurgence due to new variants.
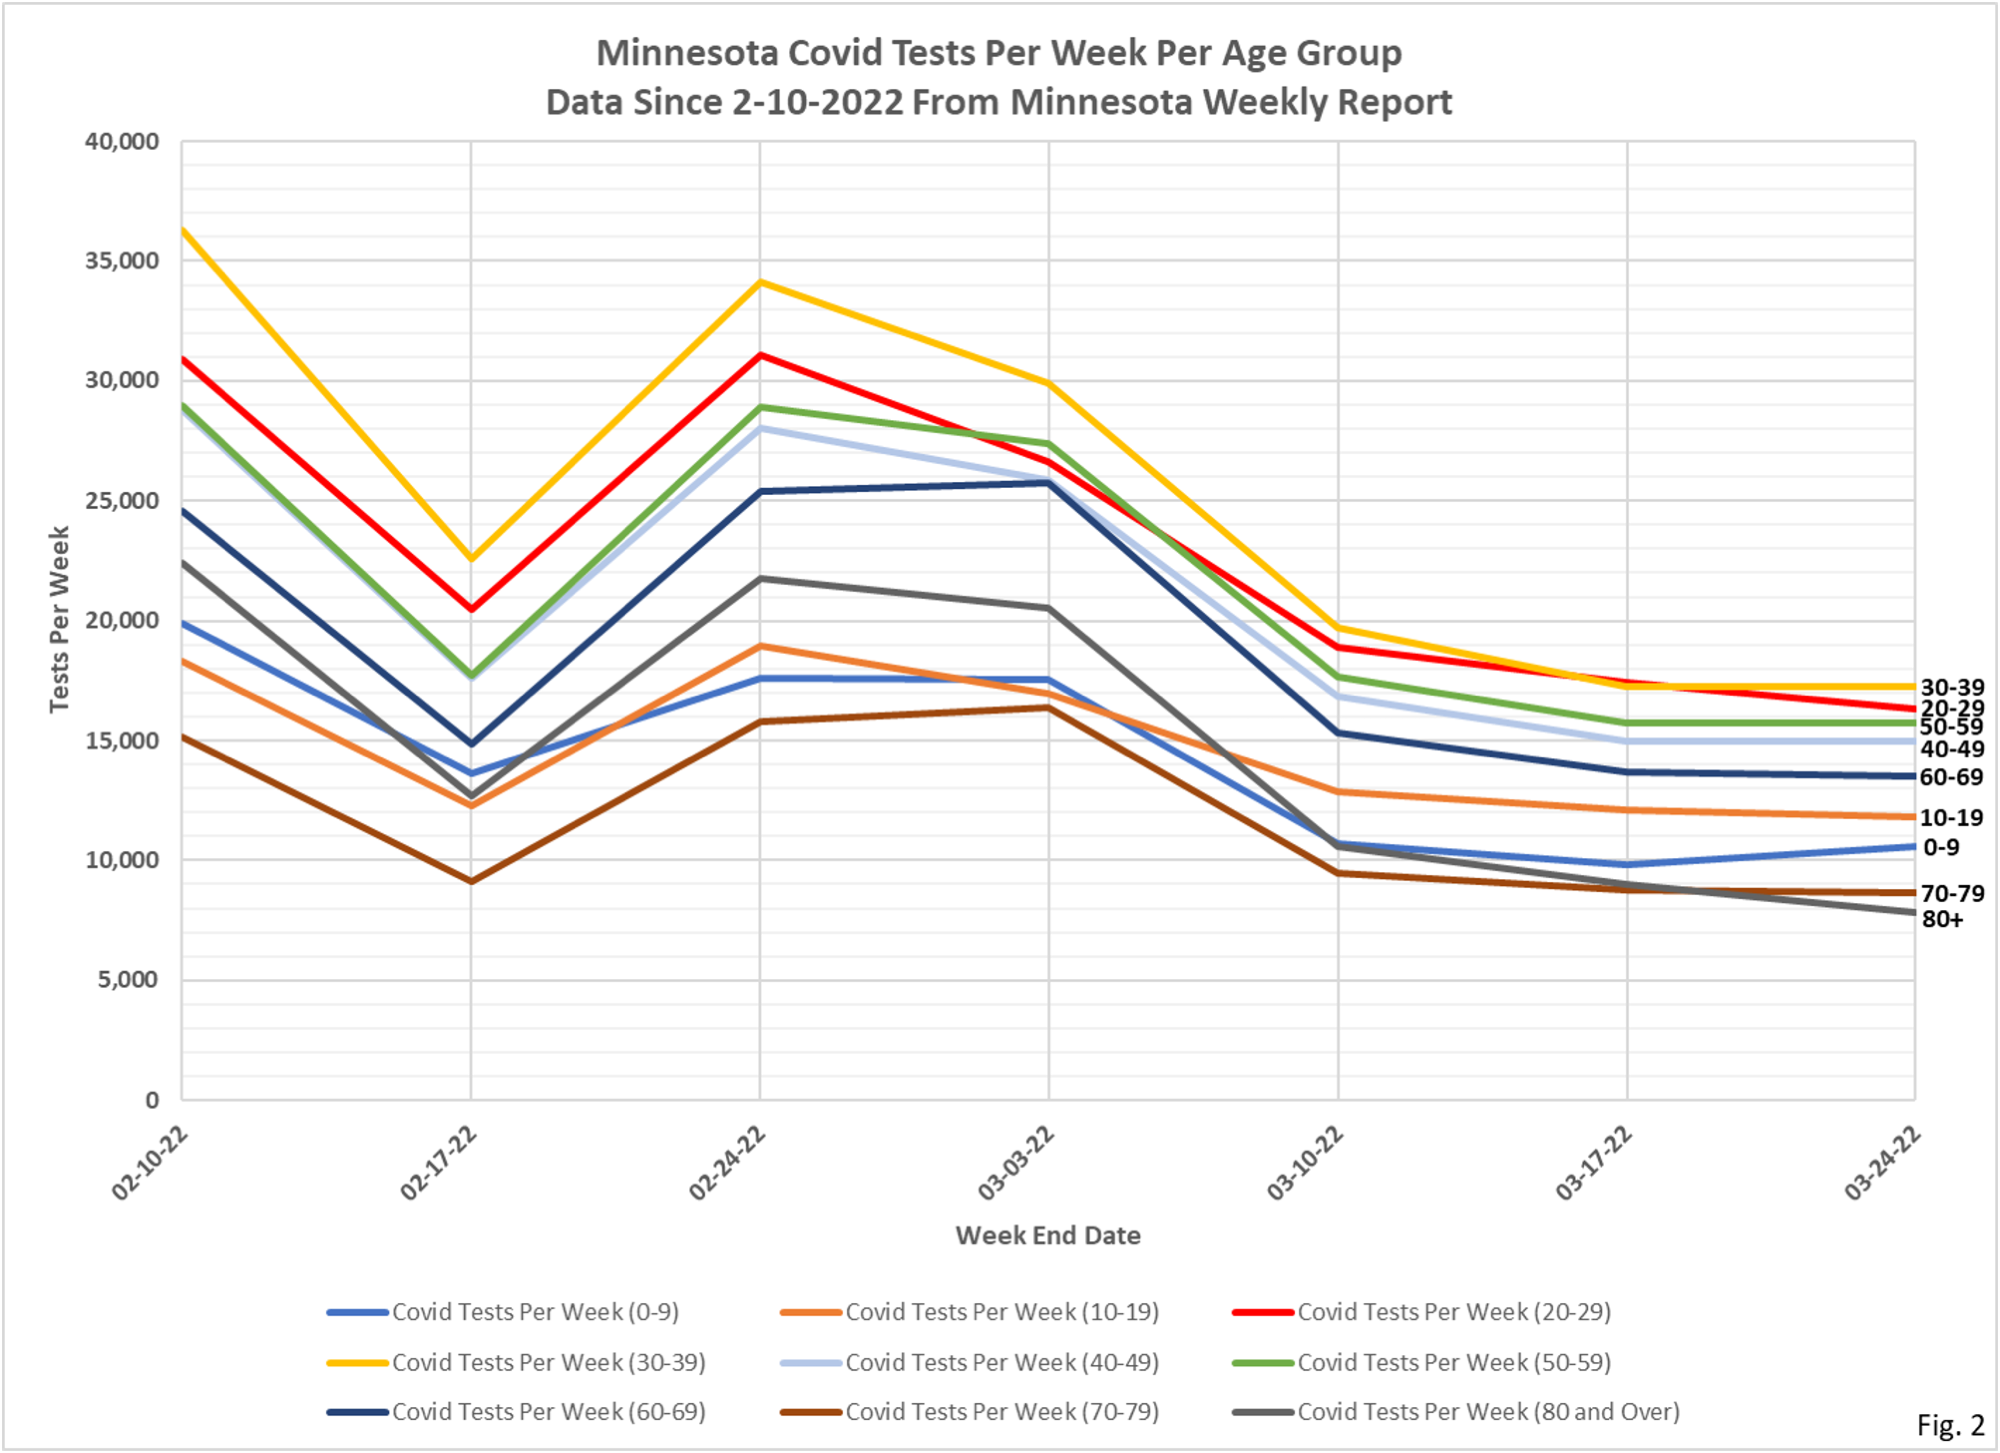
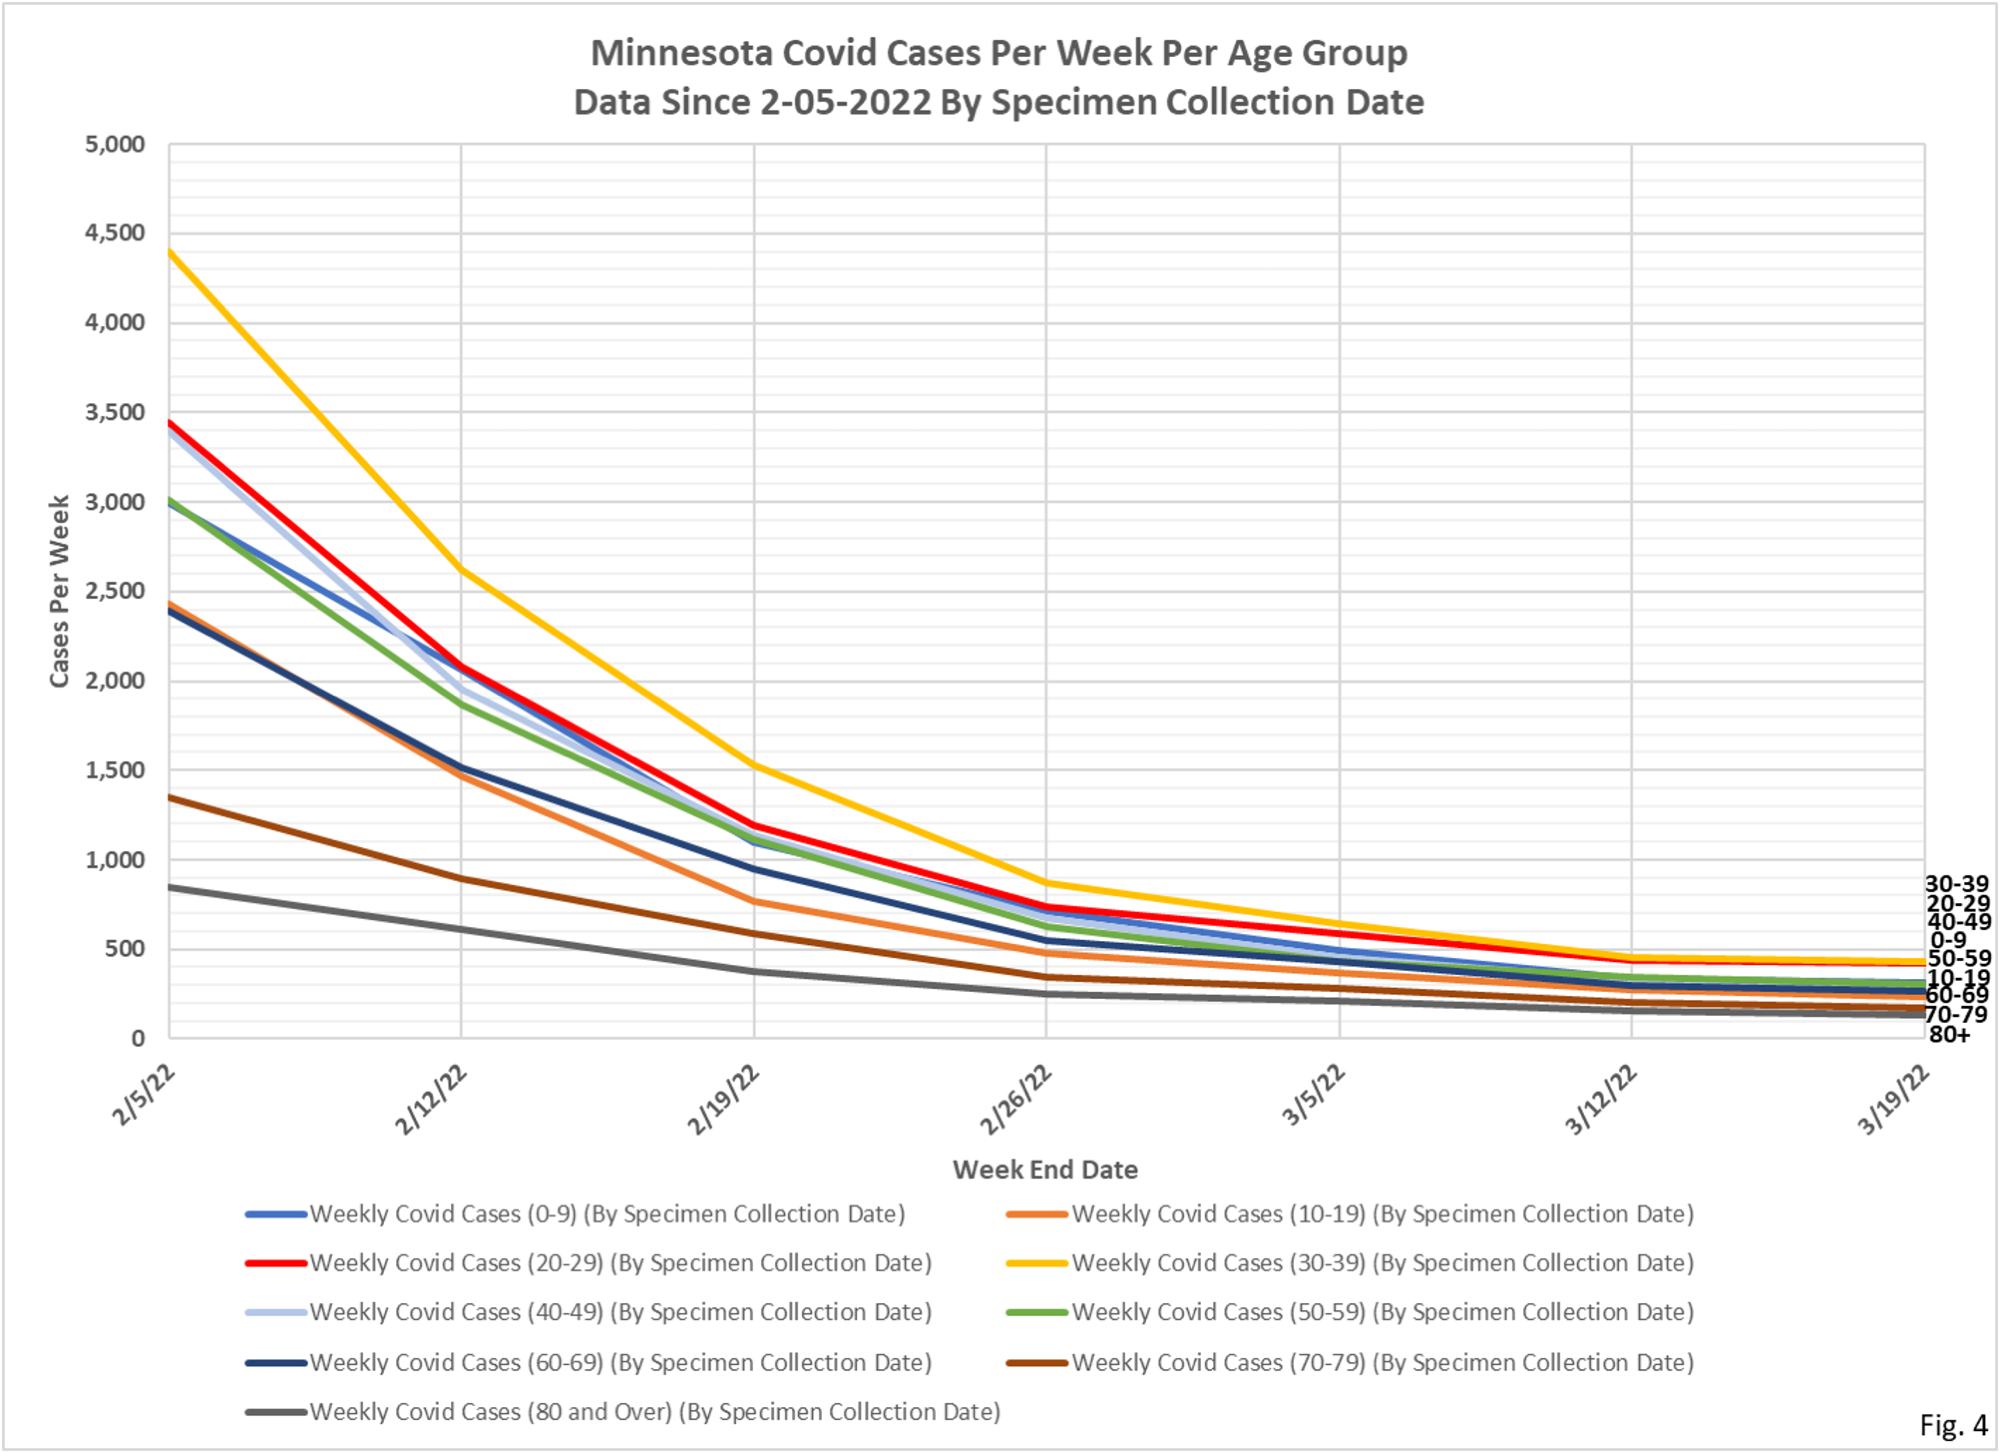
- As always there are 2 charts for each metric. New this week, the second chart for each metric starts on 2/10/2022 (2/05/2022 for the Cases chart, because the data source for cases uses different date definitions).
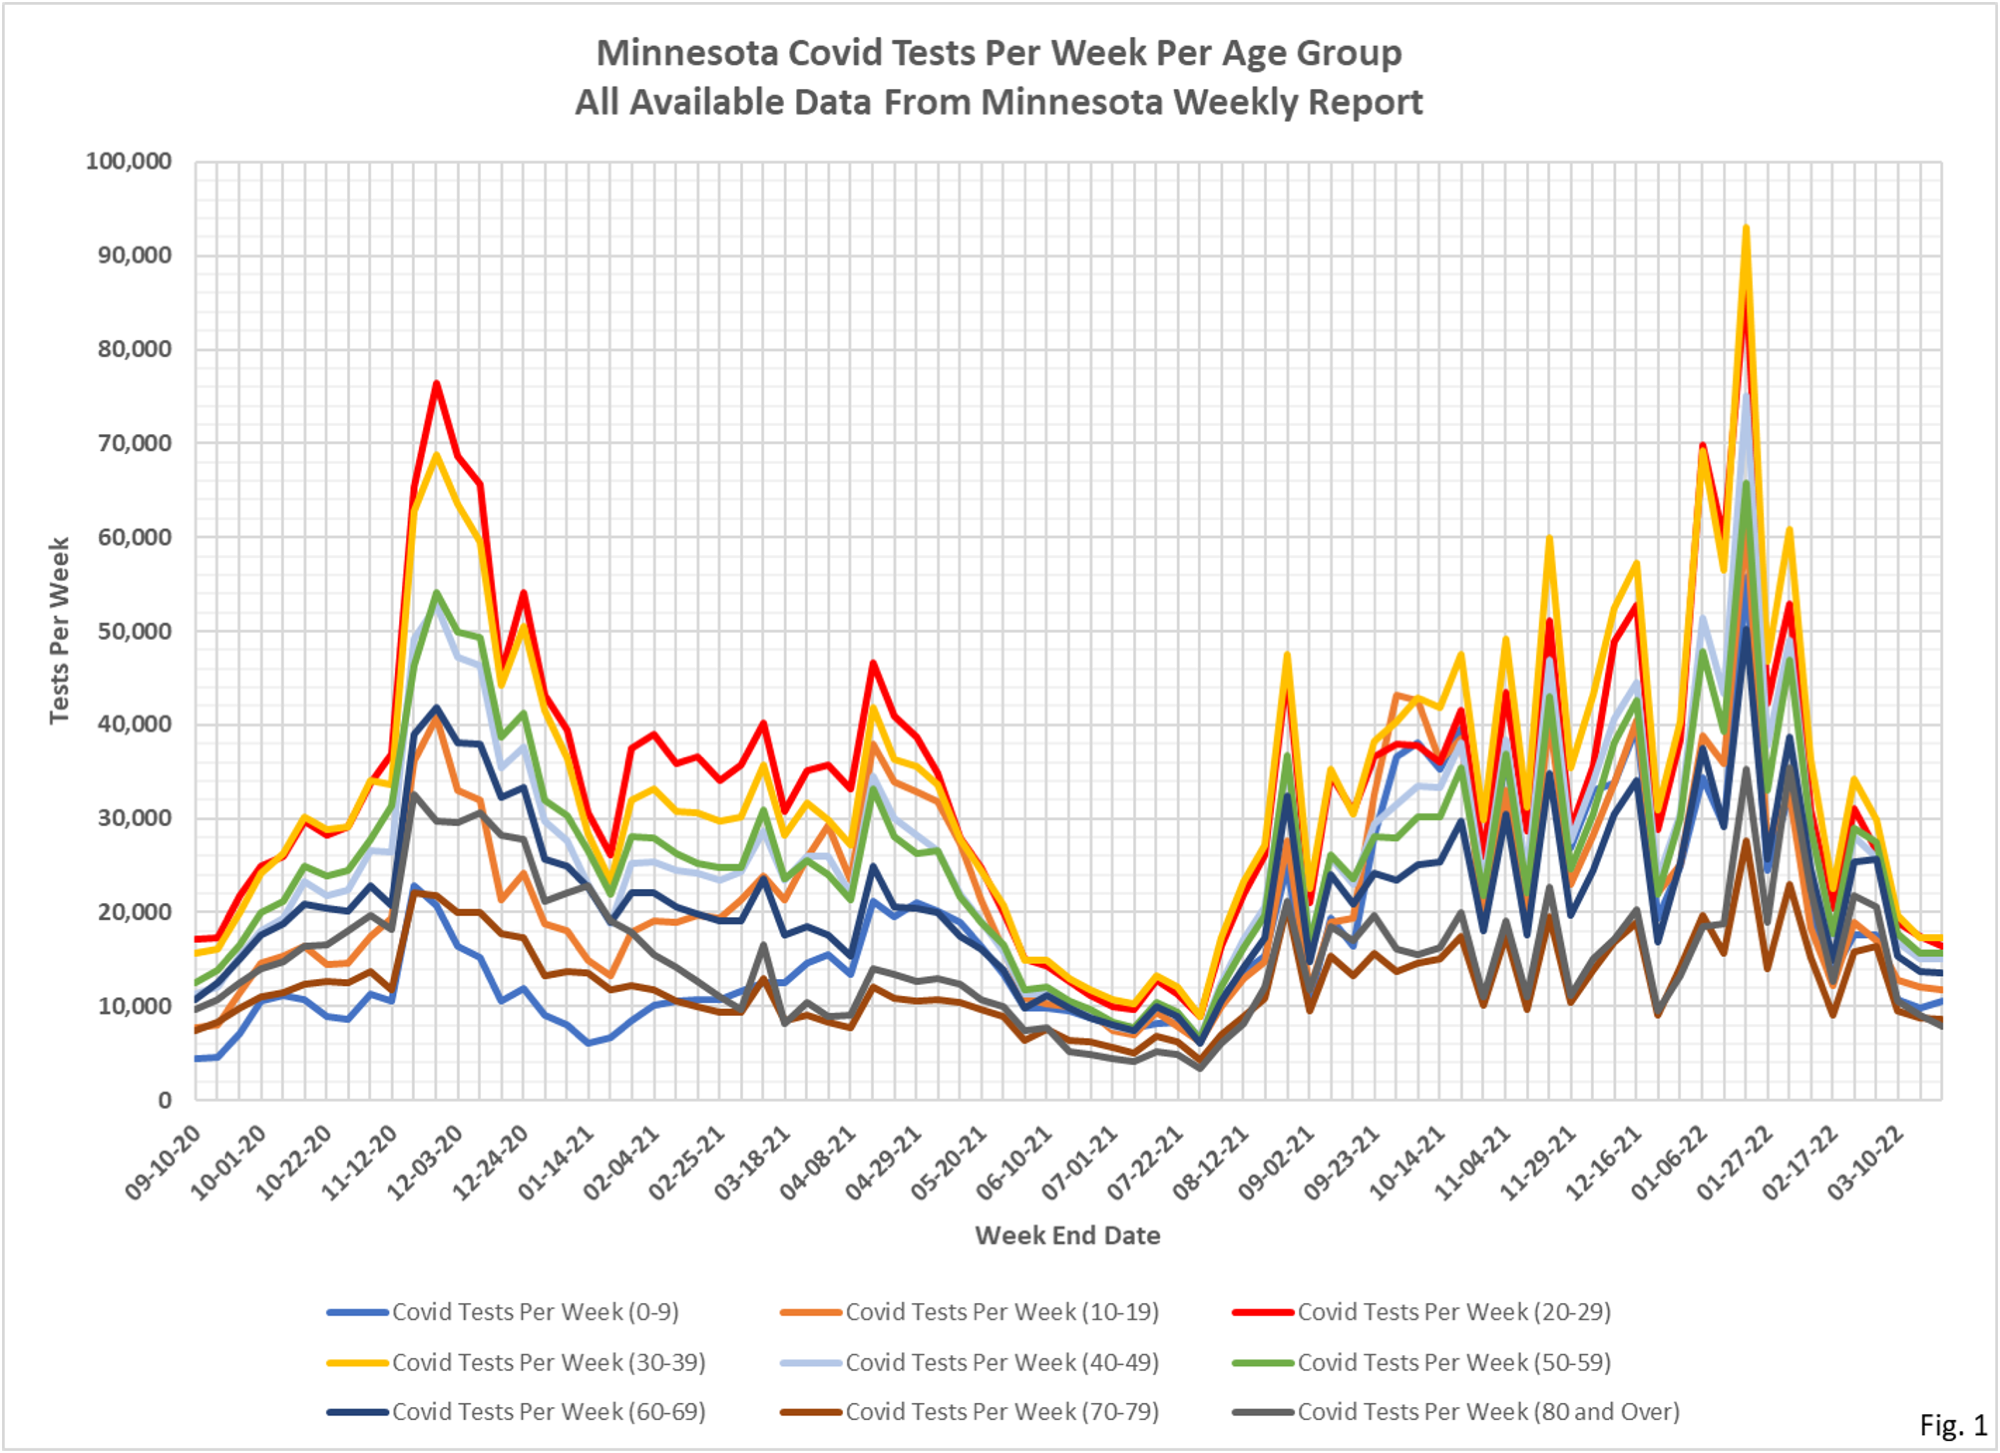
- Fig. 1 and 2: Covid Tests Per Week. Reported testing trending lower this week, although still higher than the lows last seen in July 2021. Total reported tests this week were 116,614.
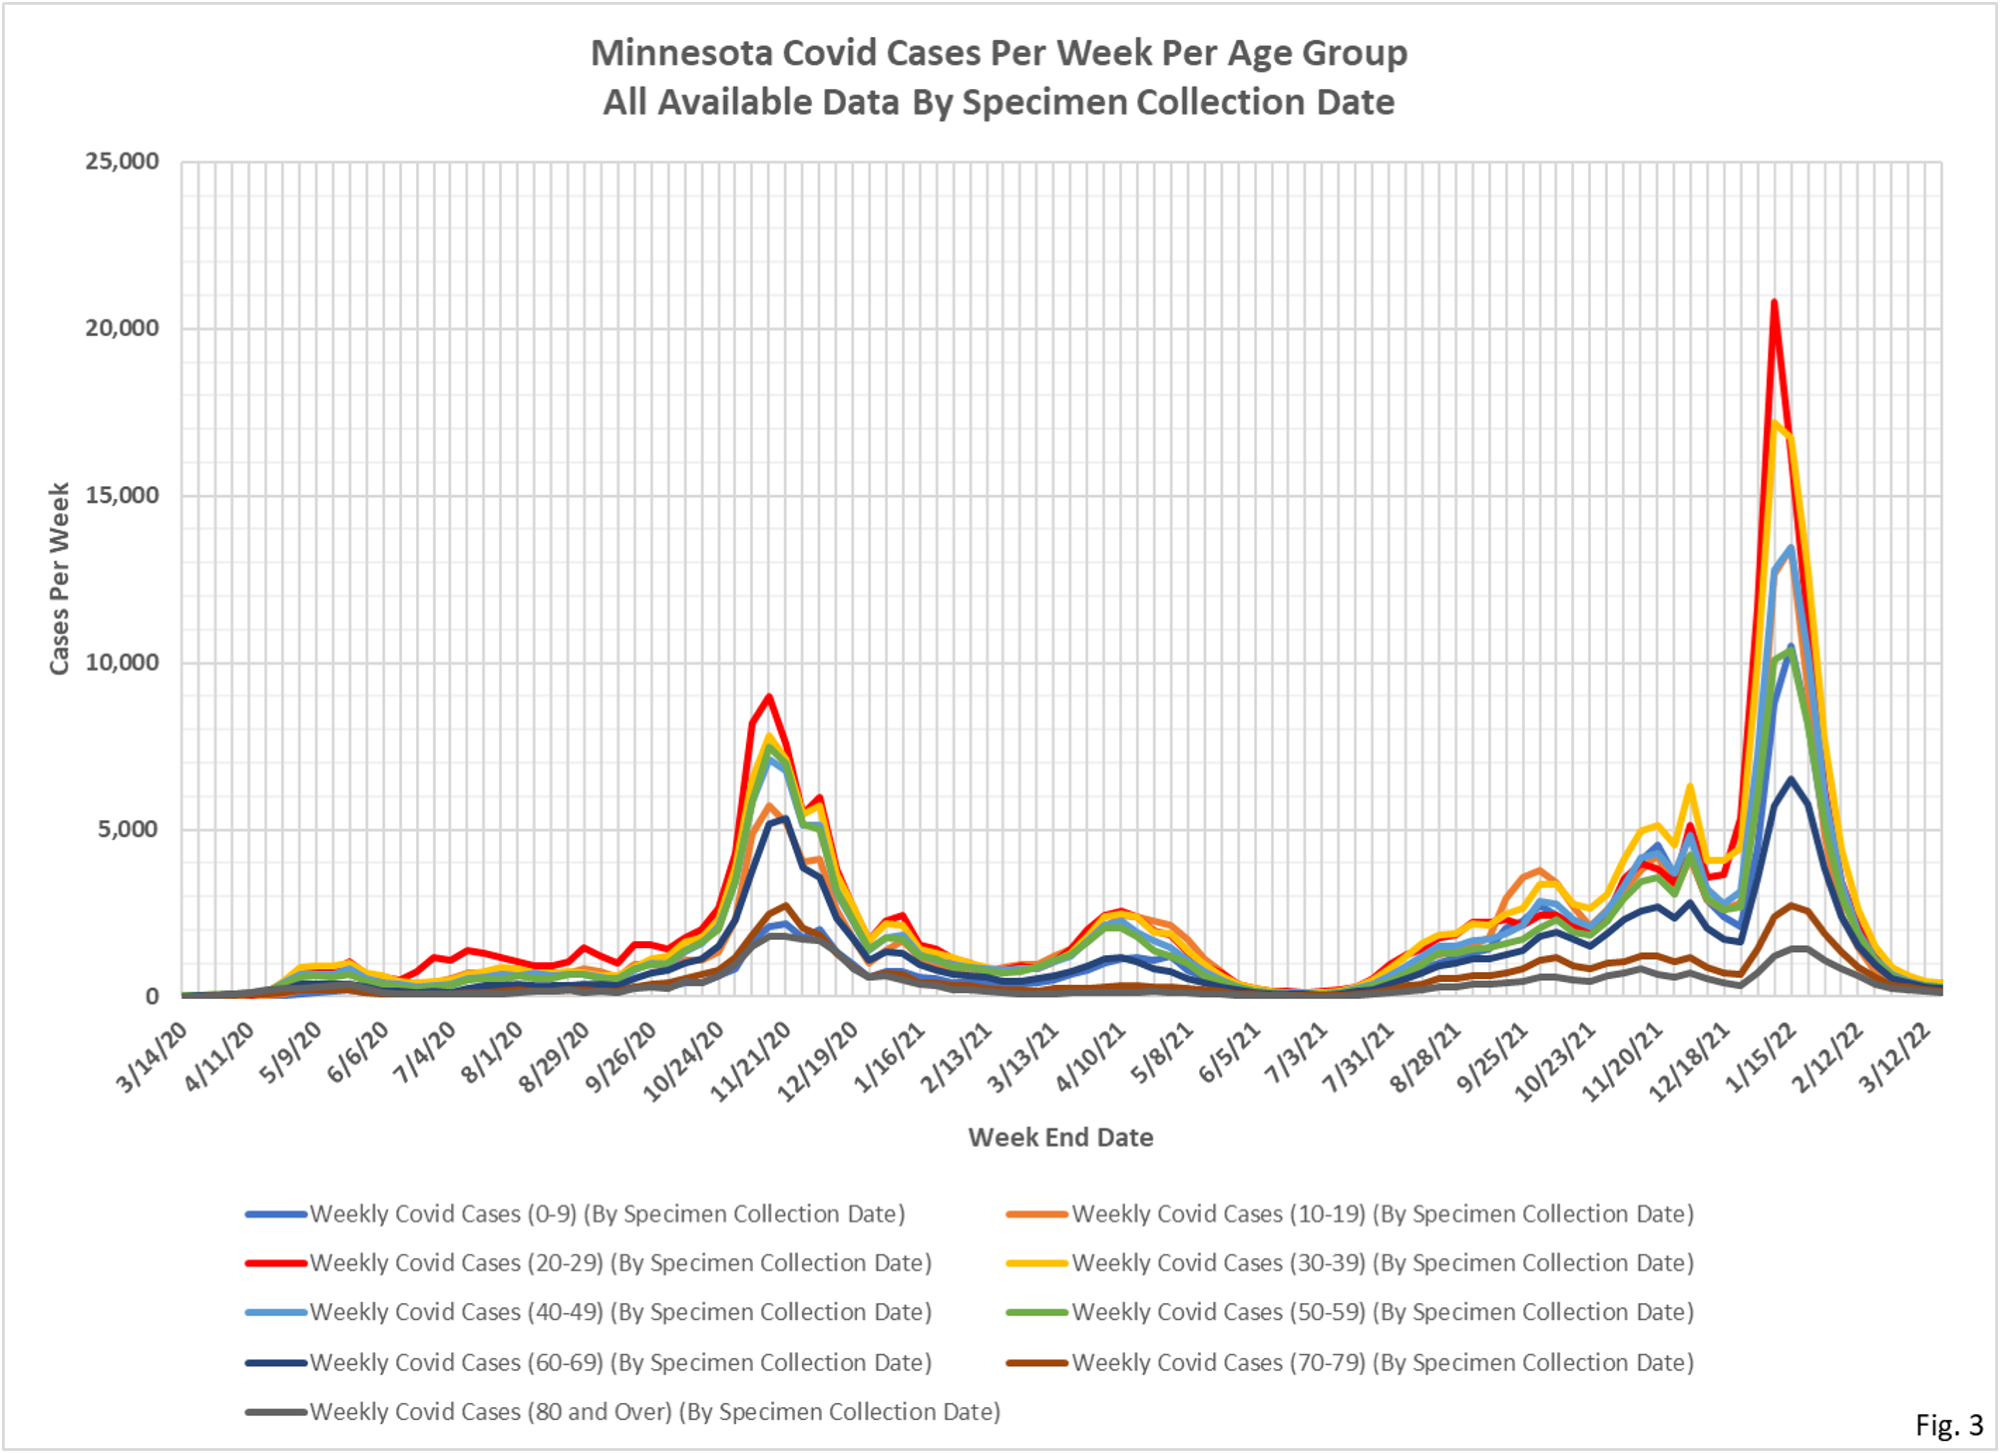
- Fig. 3 and 4: Covid Cases Per Week. The reported Covid cases this week continue to trend lower in all age groups. Total reported cases for the week were 2,569 total for all age groups, a 9.7% decrease from the prior week, and the lowest since 1,636 cases were reported the week starting 7/17/2021.
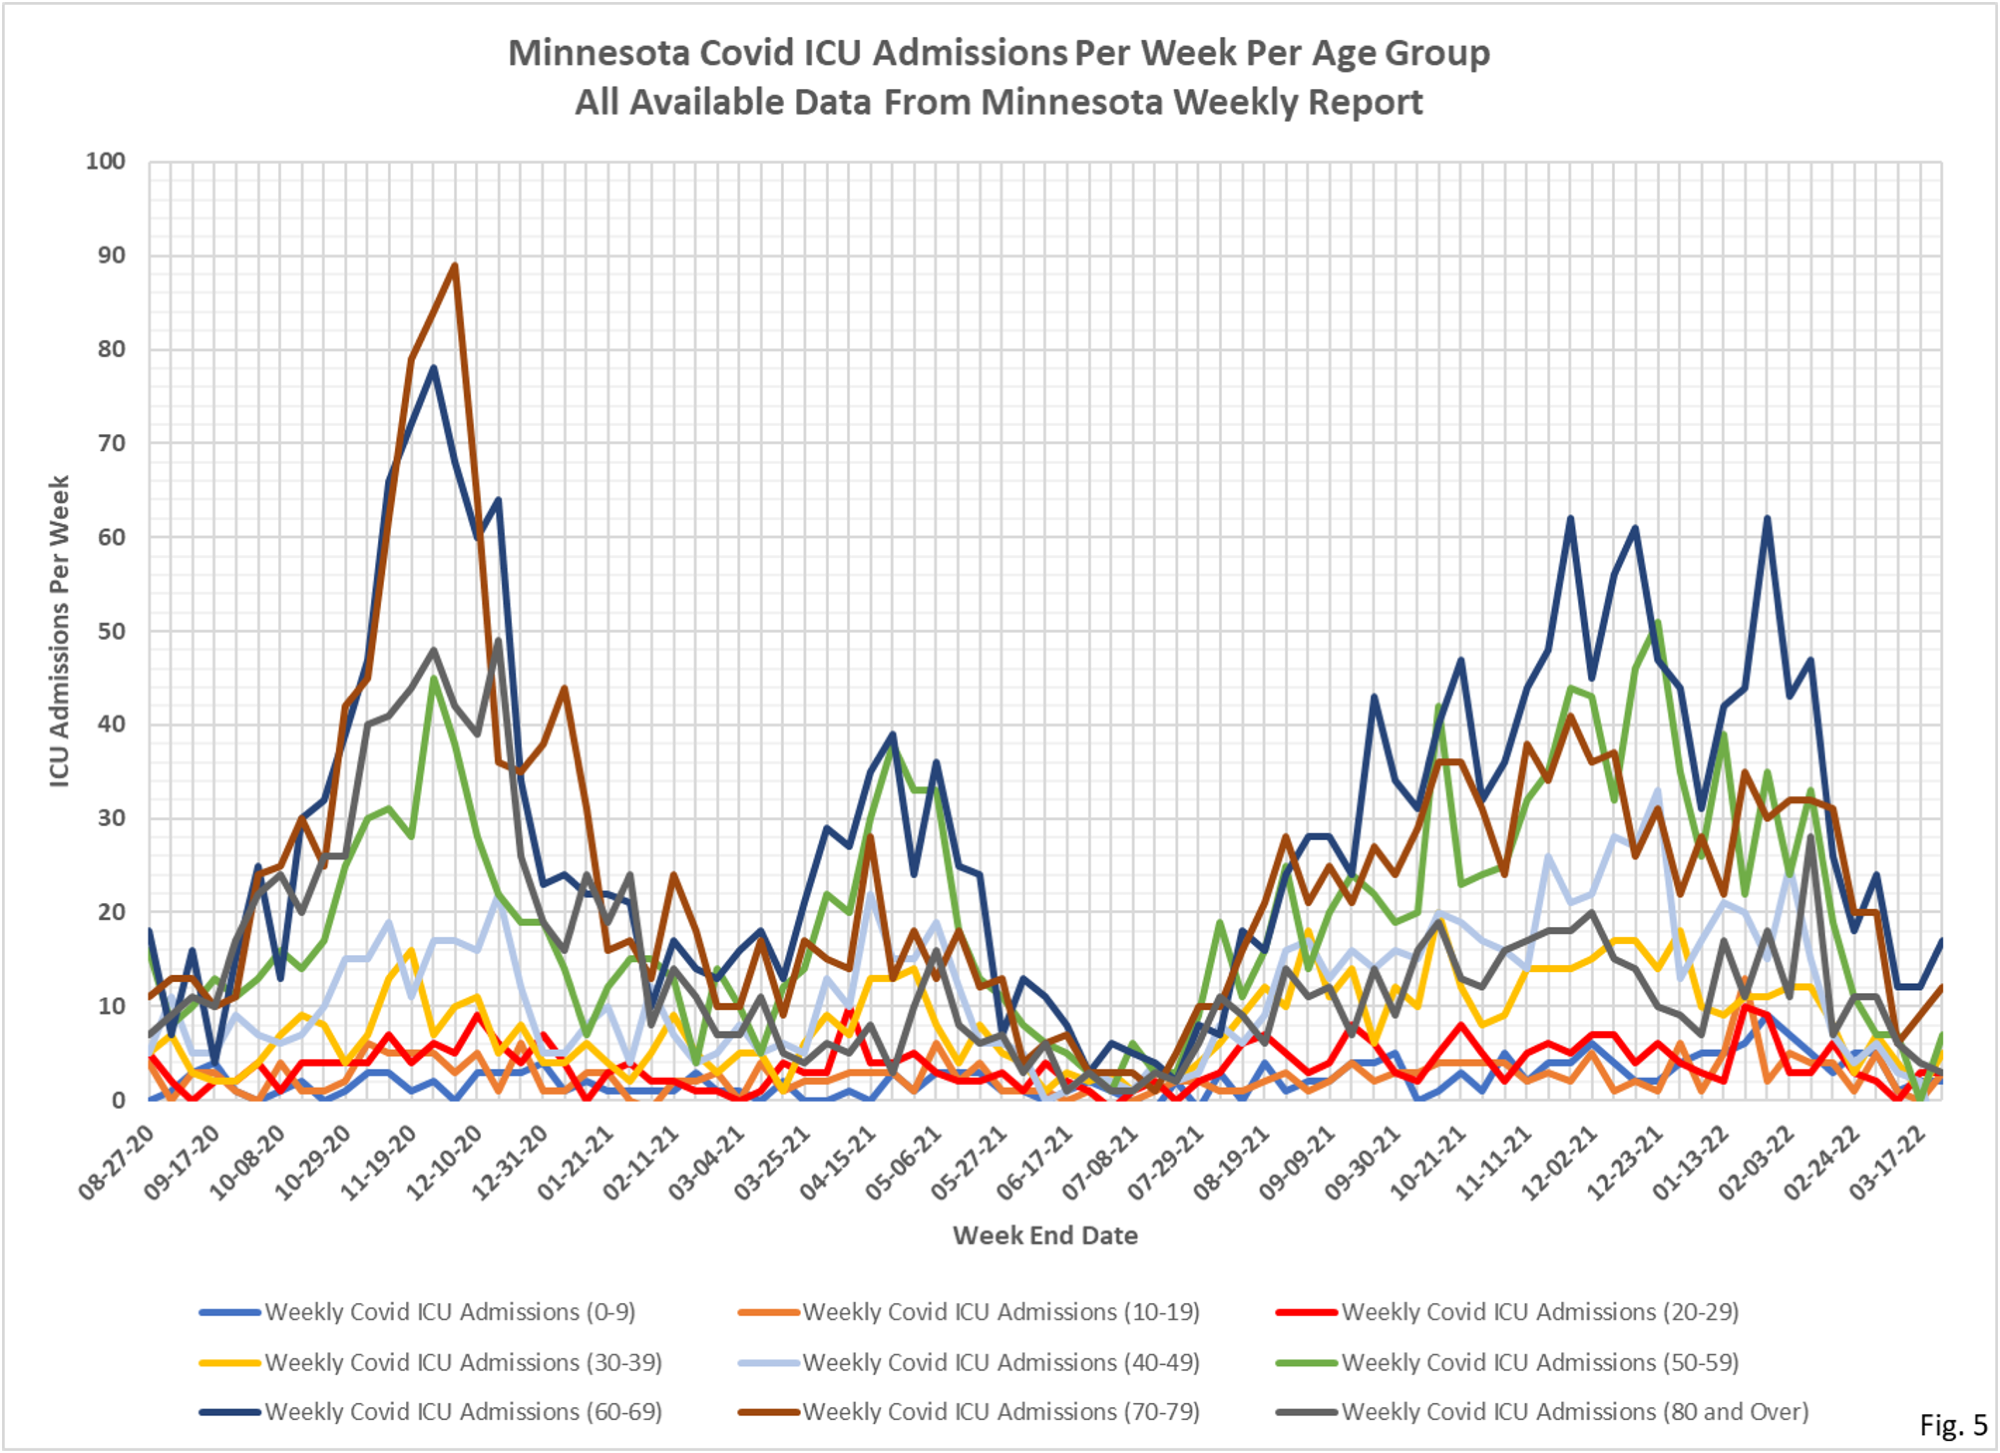
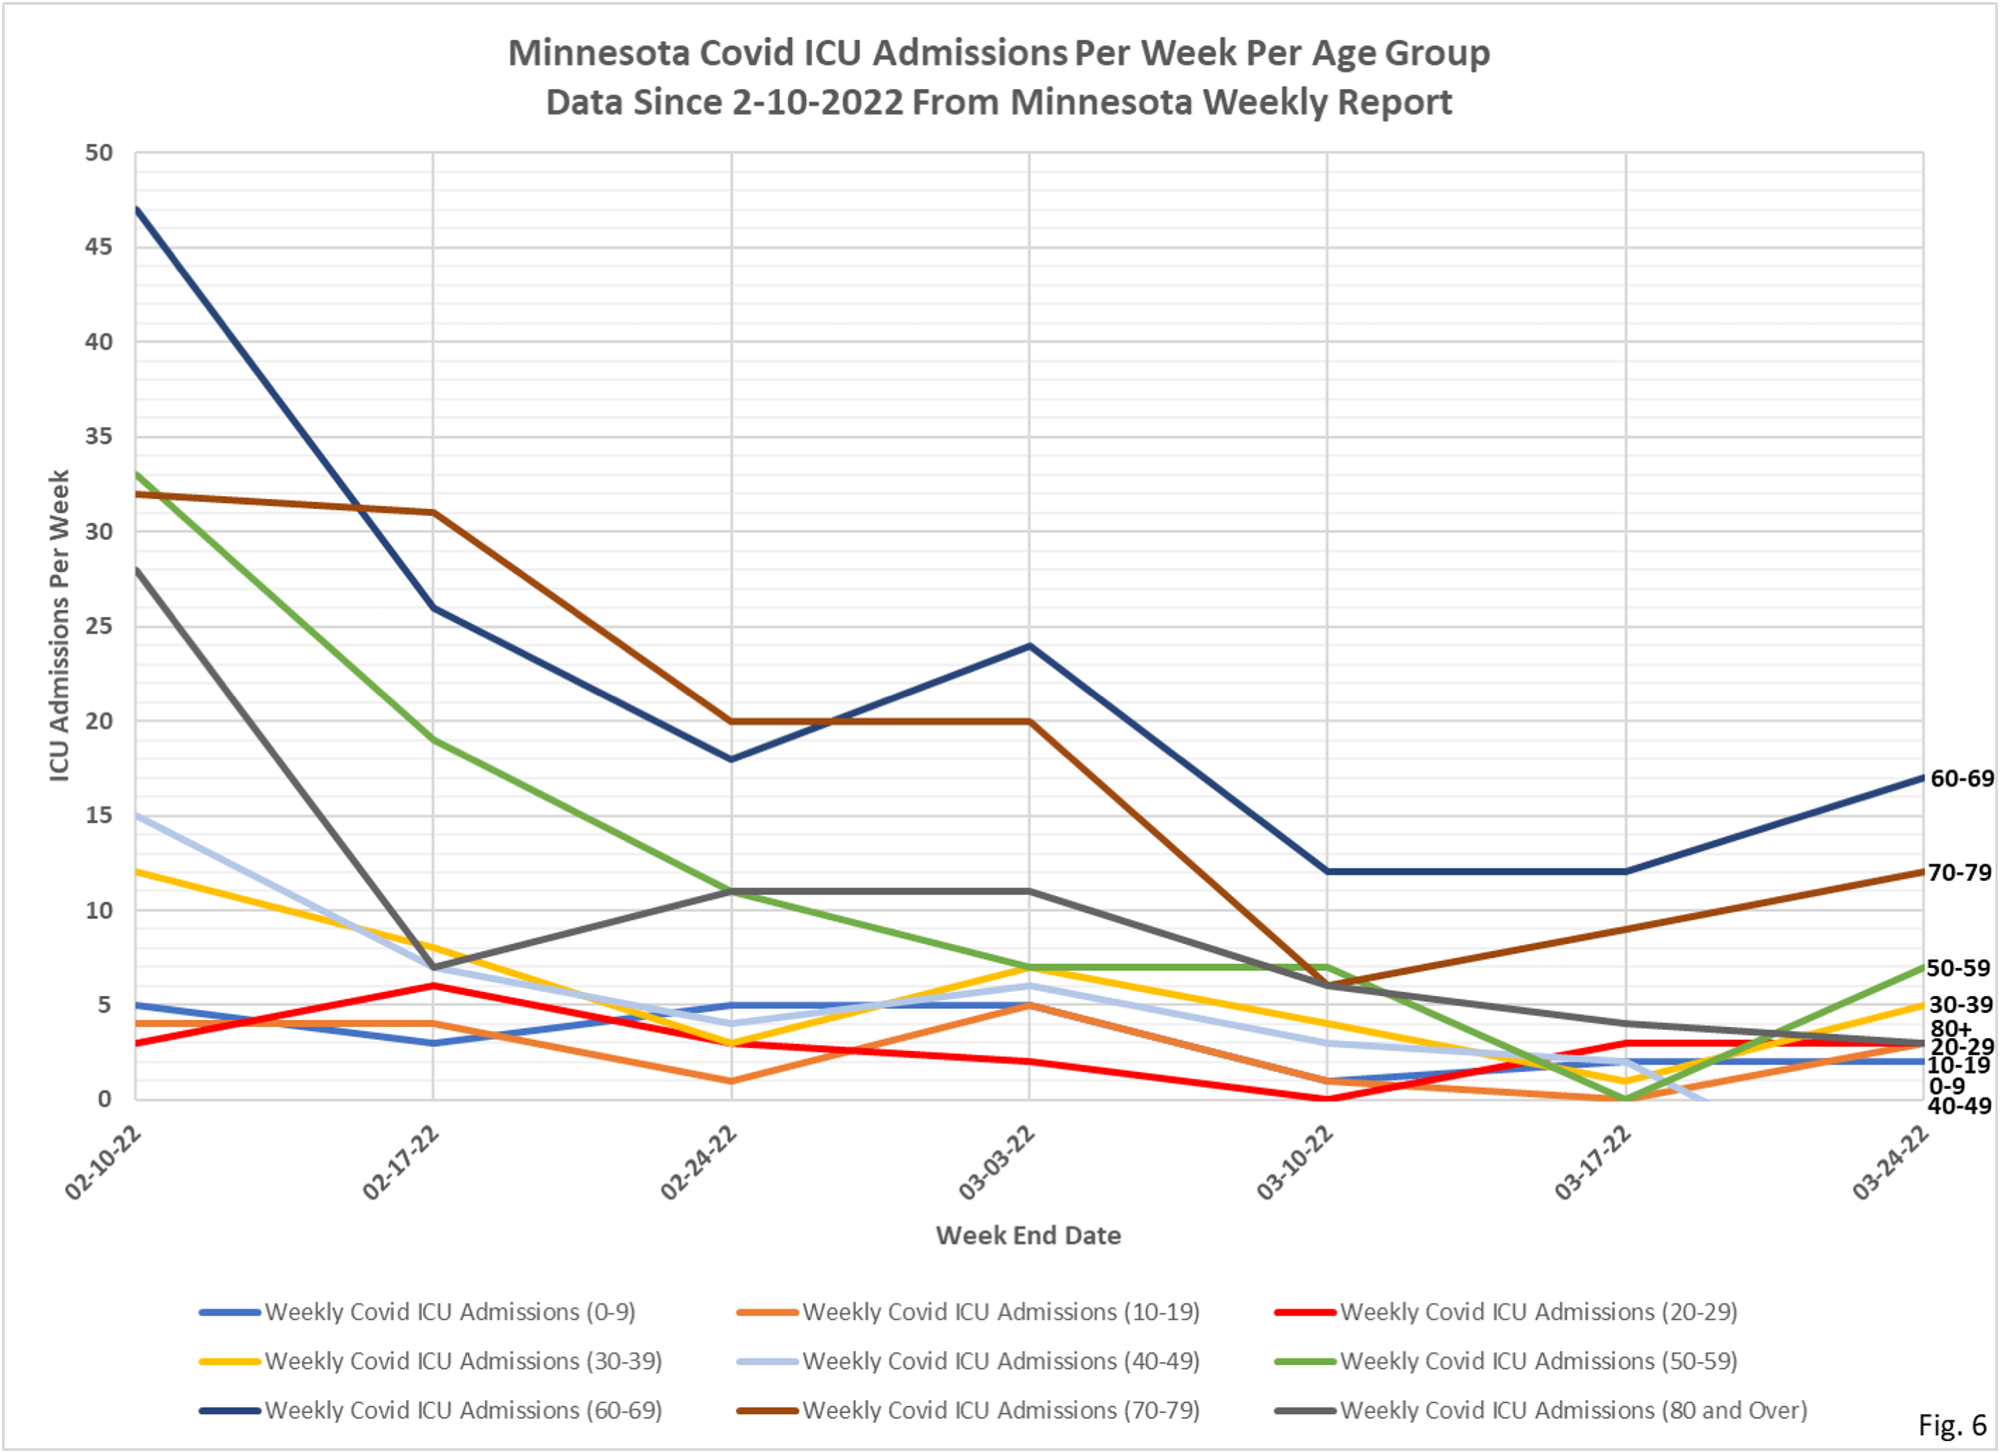
- Fig. 5 and 6: ICU Covid Admissions Per Week. Reported ICU Covid admissions were somewhat higher off the recent lows this week, interrupting the general downward trend seen in recent weeks. Reported total ICU admissions for the week were 46, an increase of 13 from the 33 reported ICU admissions the prior week. The biggest unknown is incidental admissions, when a person is admitted for non-Covid reasons and then tests positive. We have filed a Data Practices Act Request for information on incidental positive admissions, but so far we have not been given any data.
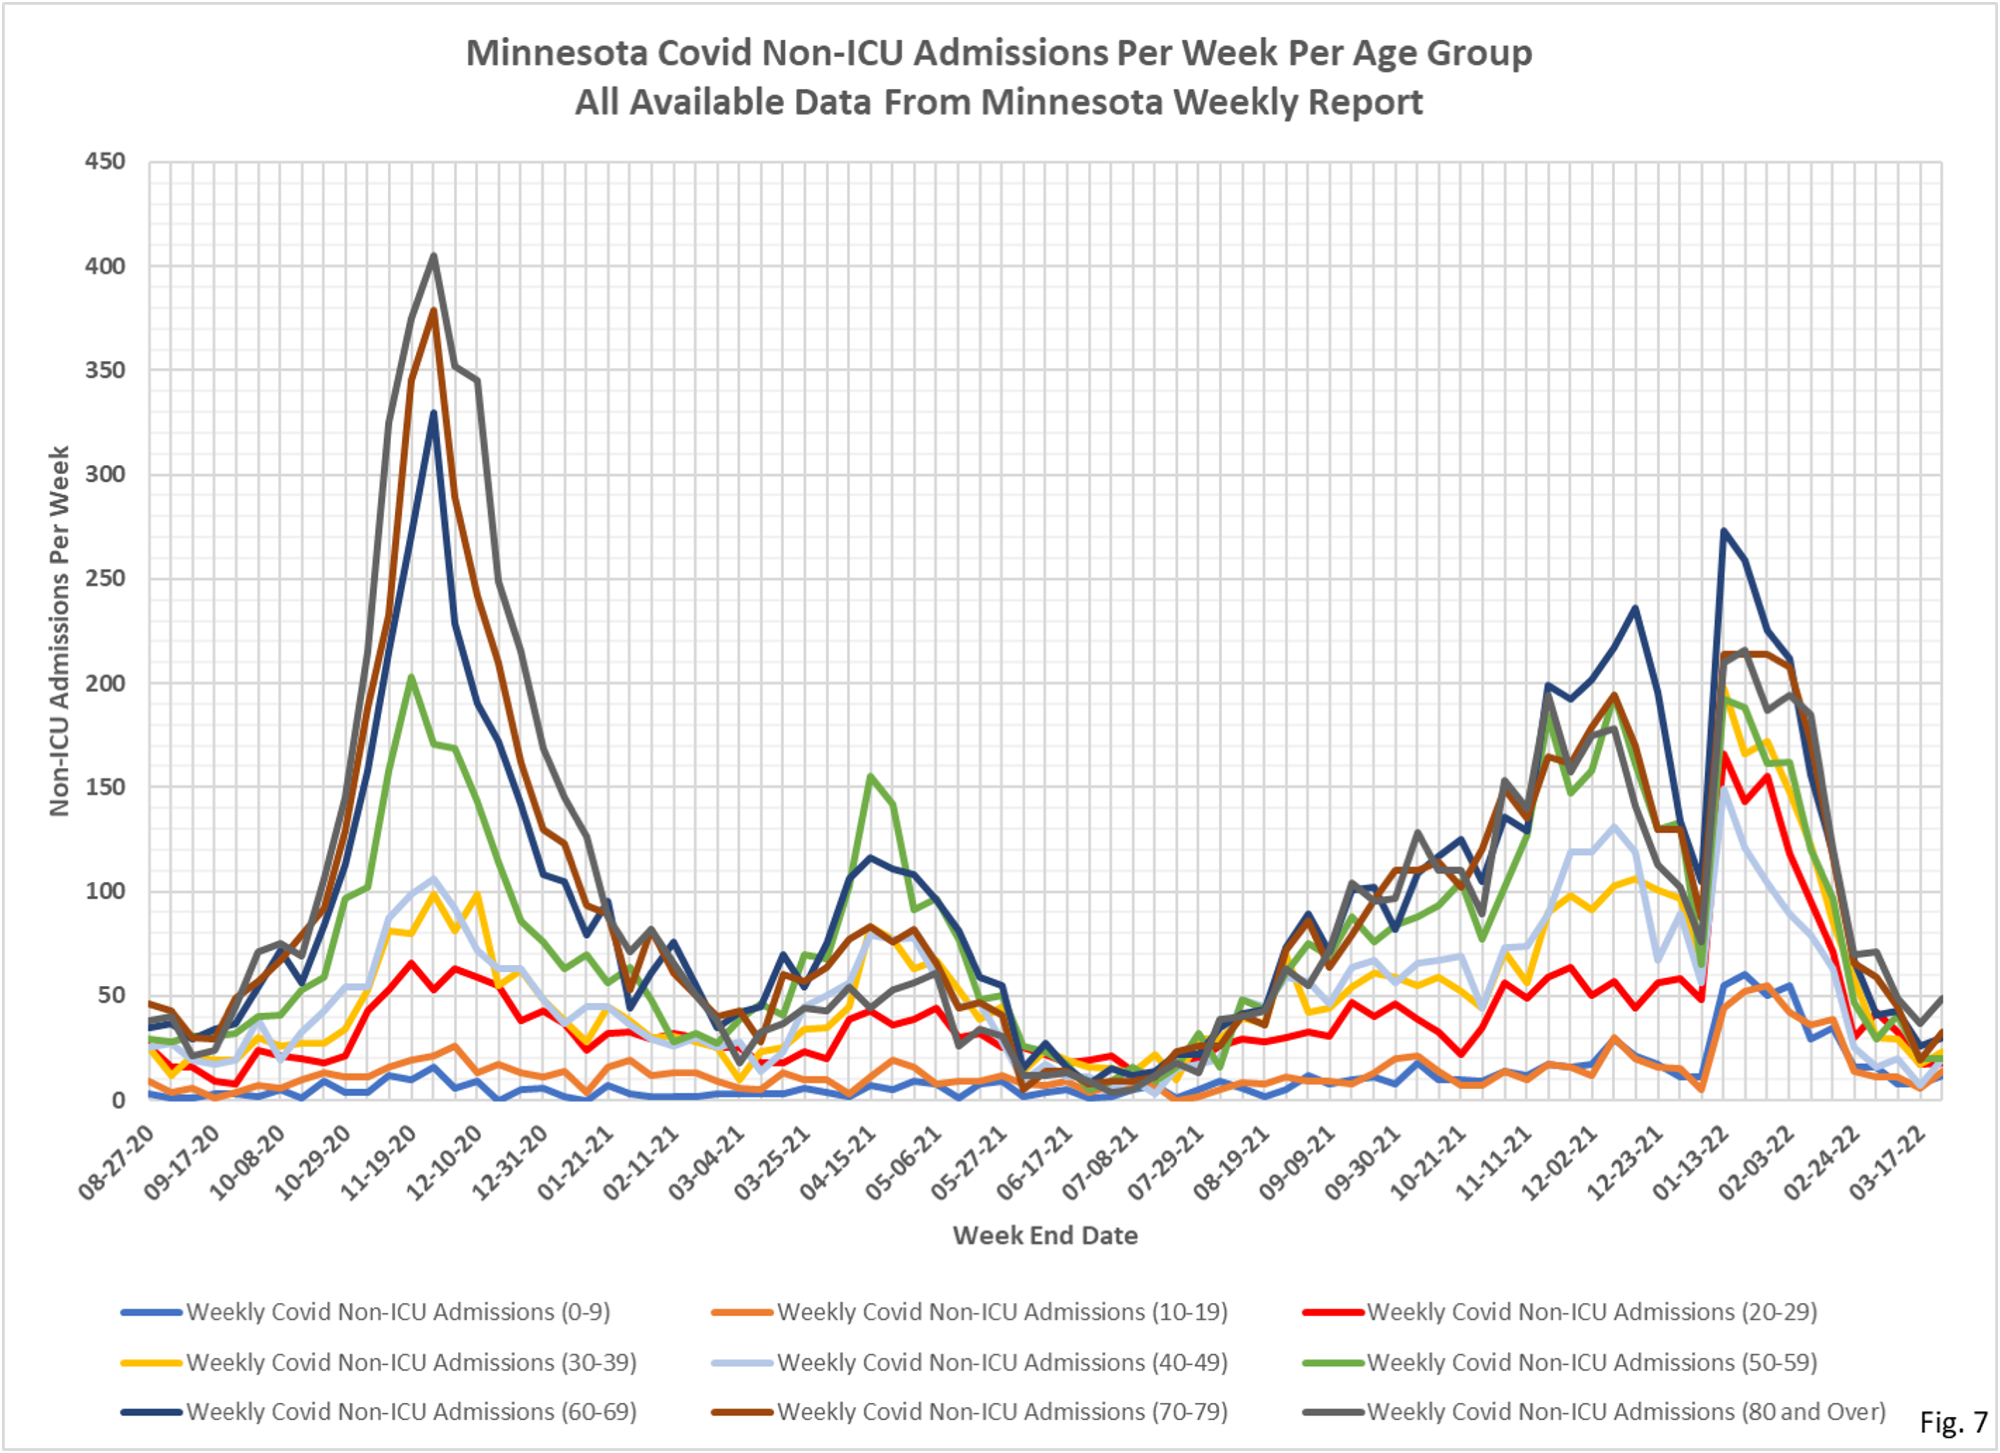
- Fig. 7 and 8: Non-ICU Covid Admissions Per Week. Reported Non-ICU Covid admissions were also somewhat higher this week, similar to ICU admissions. Total Reported Non-ICU Covid admissions for the week were 219, an increase of 62 admissions from the prior week’s total of 157.
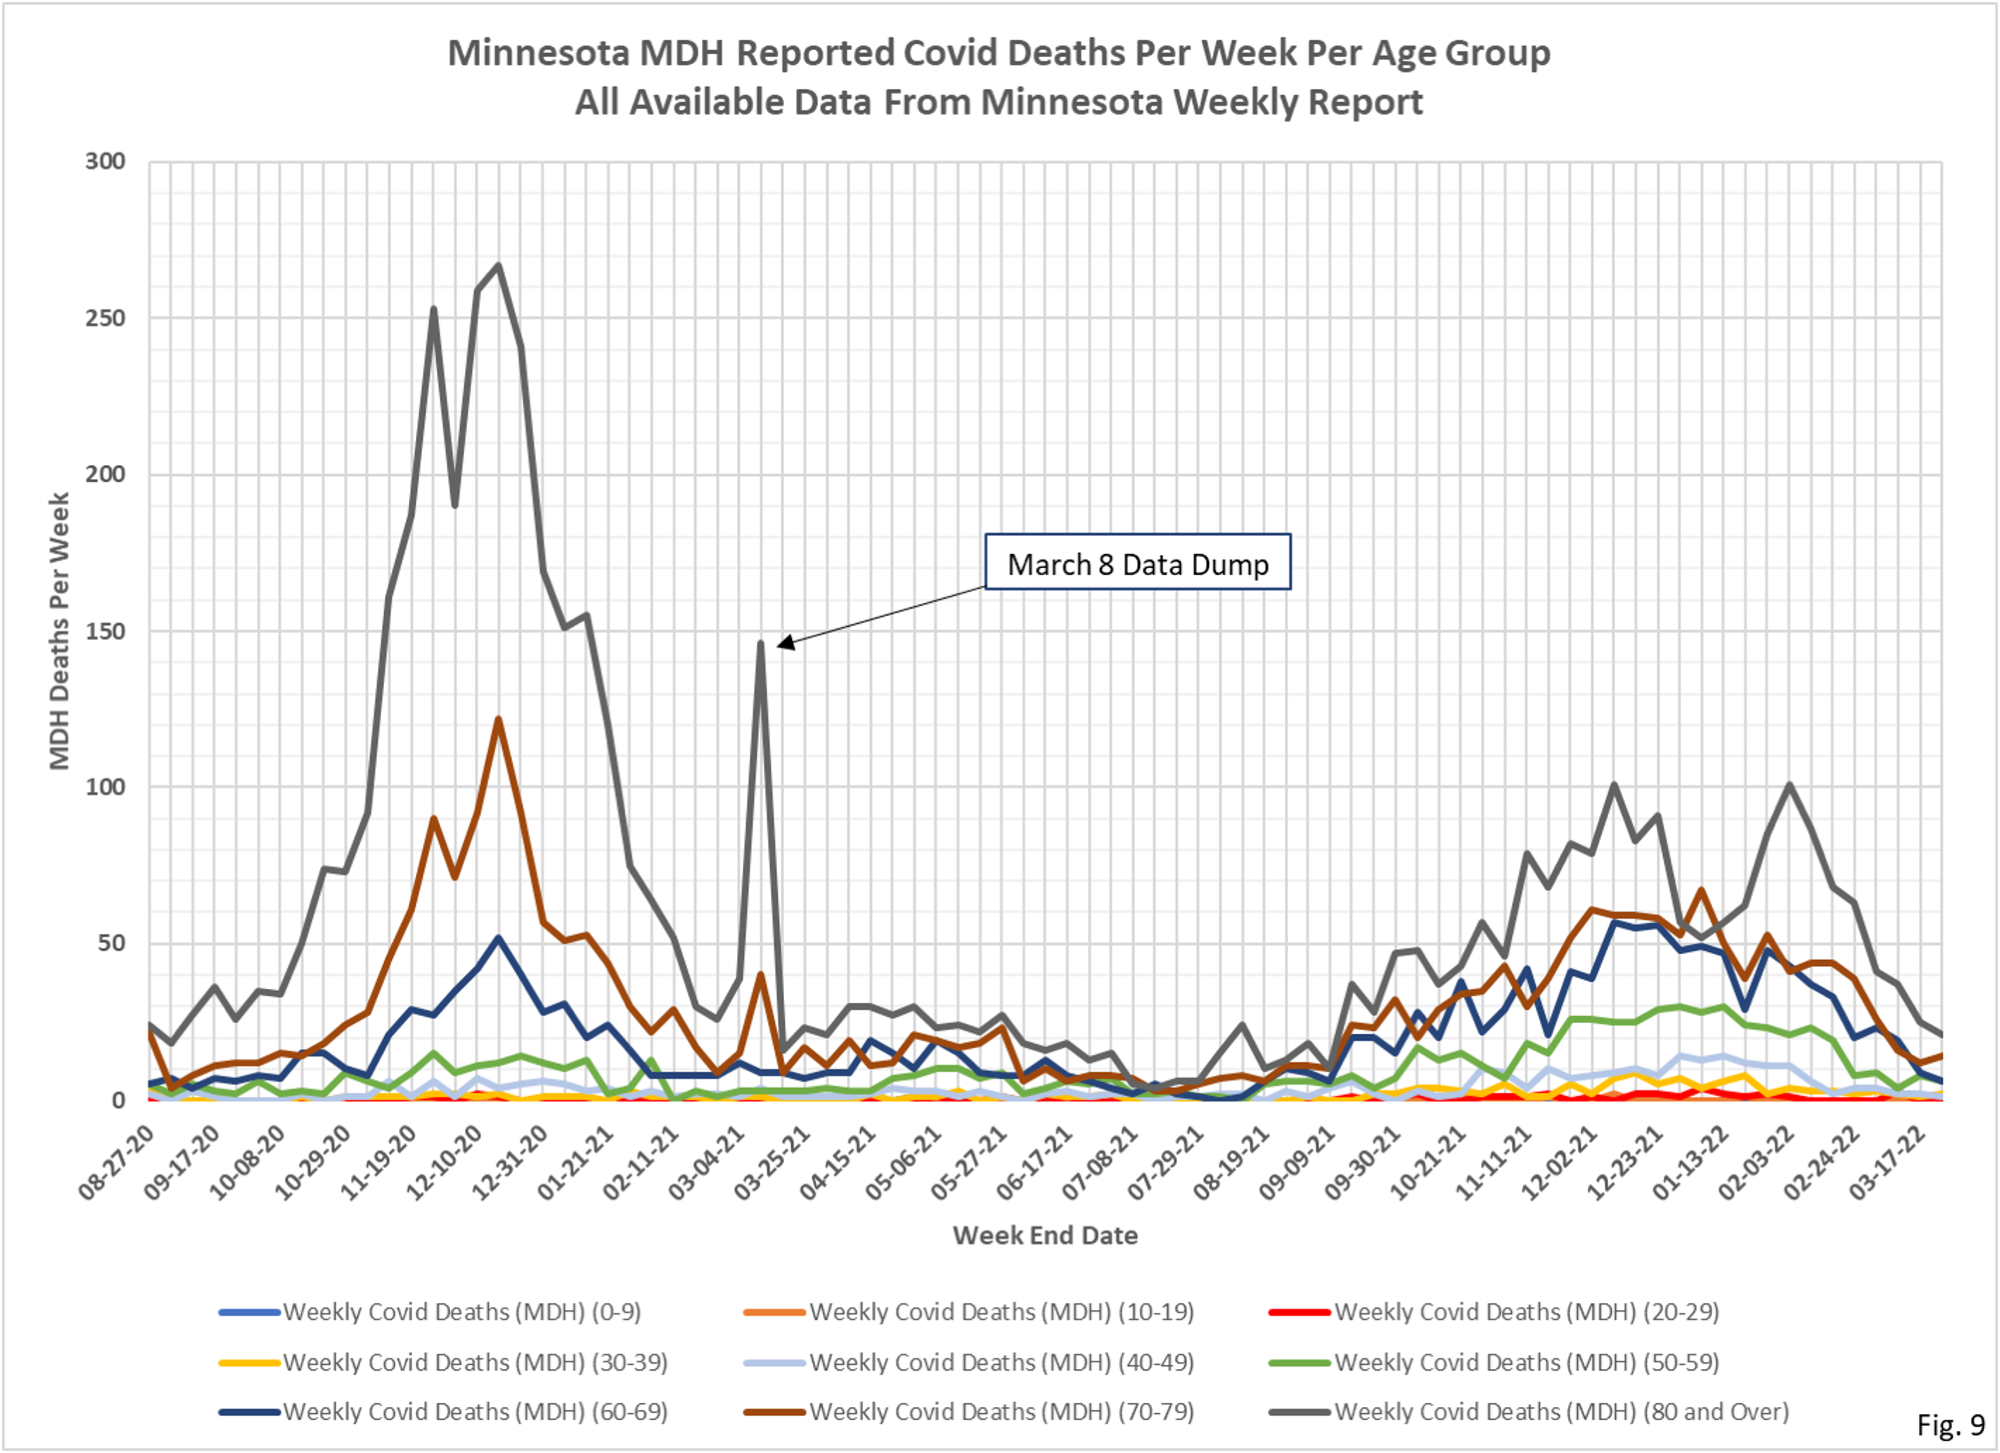
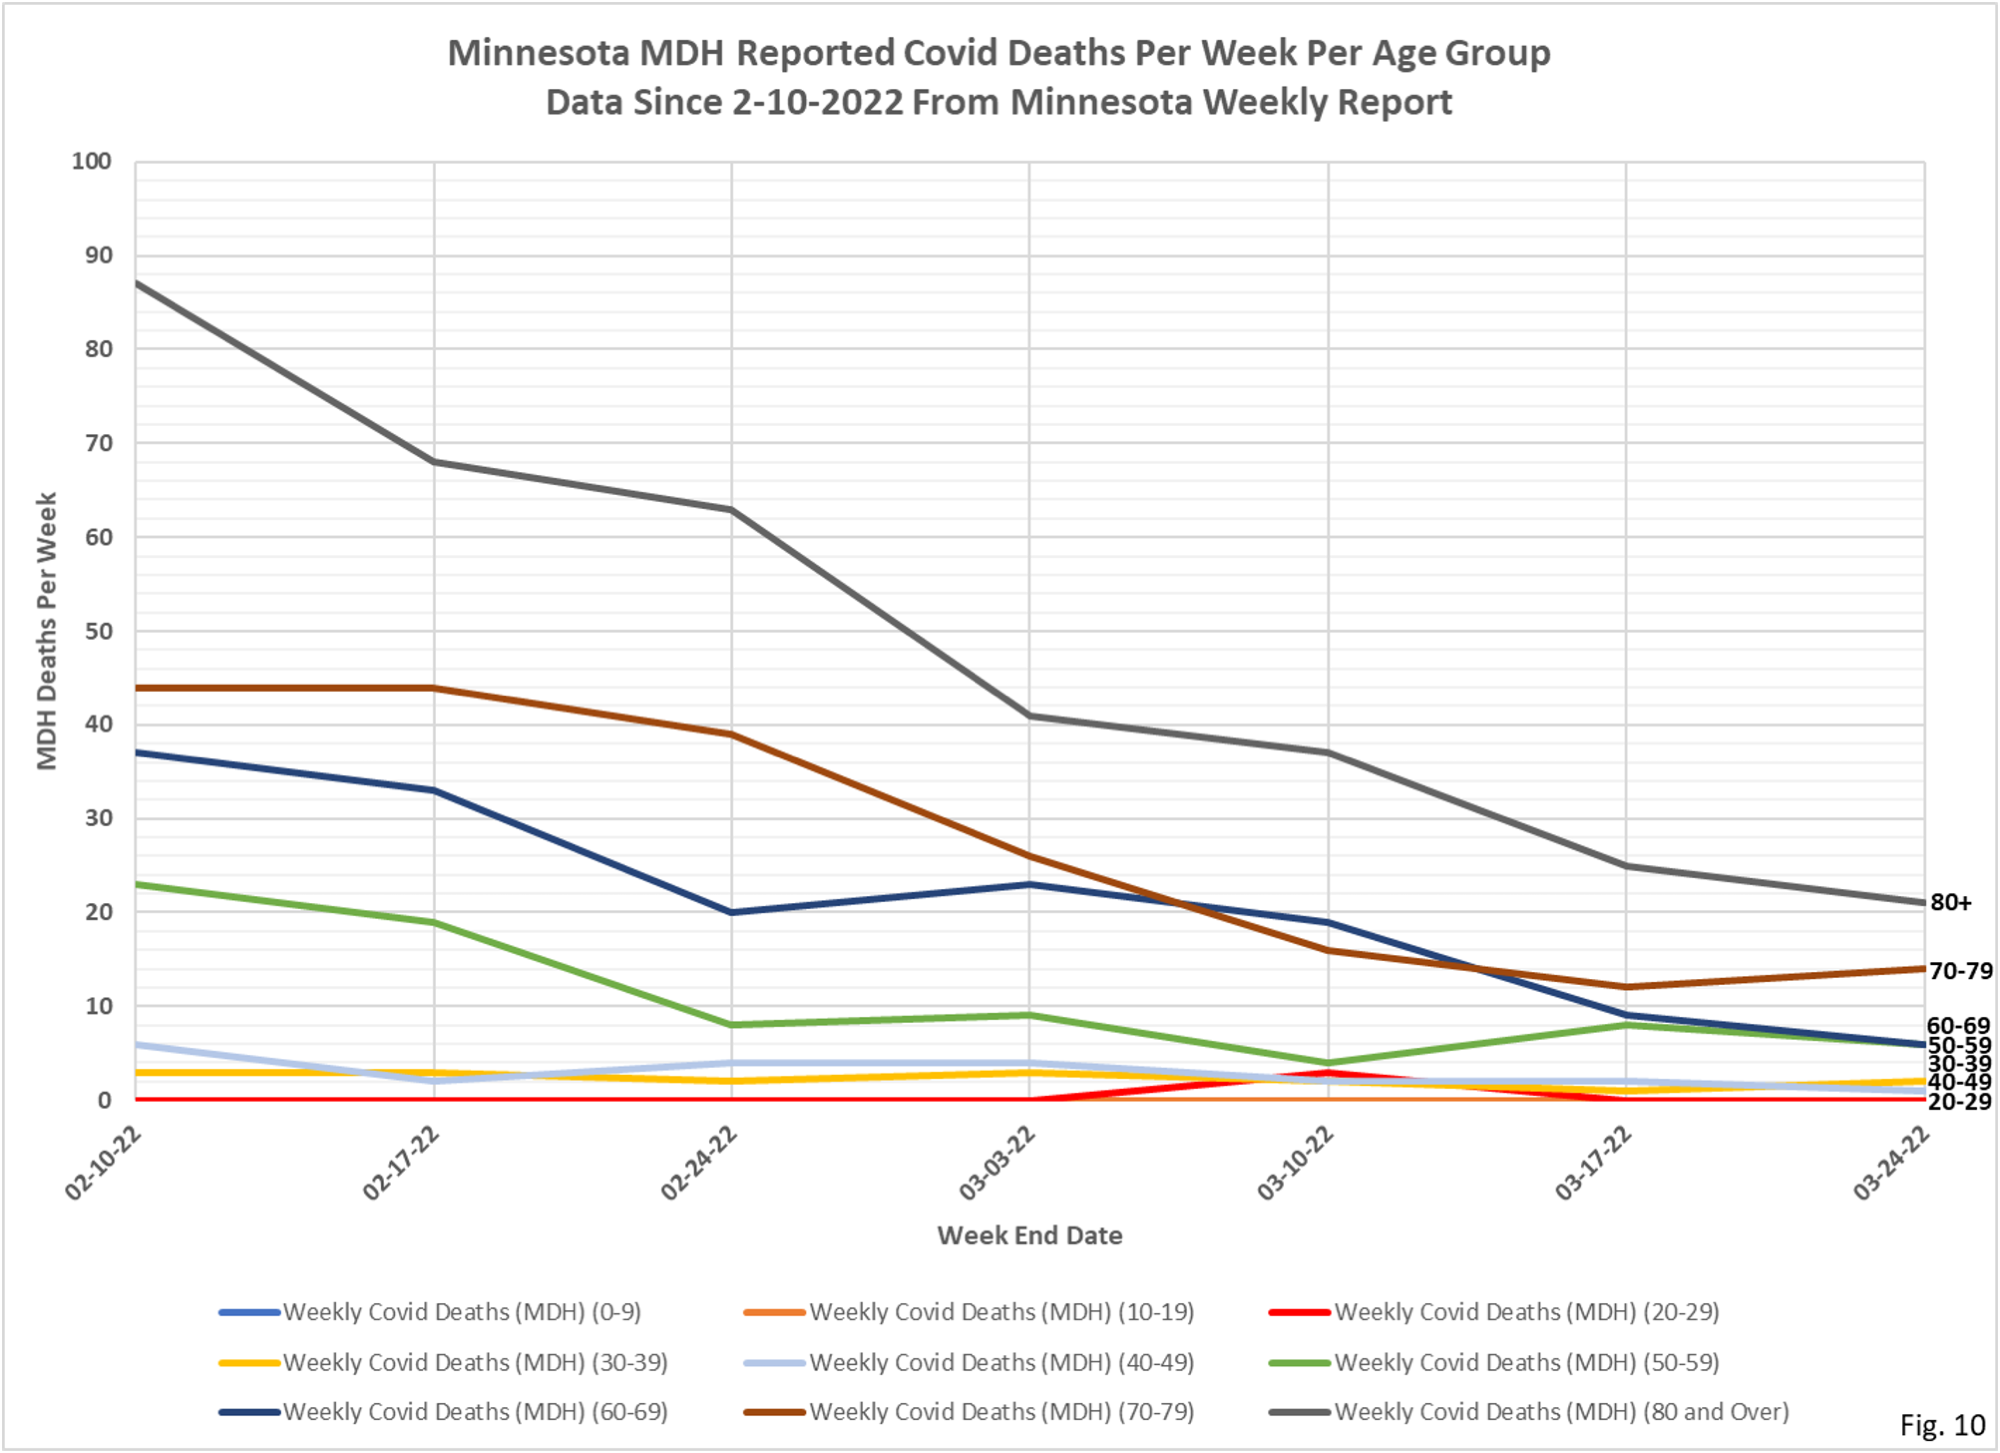
- Fig. 9 and 10: Covid Deaths Per Week. Total reported Covid deaths for the week were 50 a decrease of 7 from the 57 reported deaths the week before.

 Data source notes:
1. The data for the charts on testing, hospital admissions, and deaths comes from the Minnesota Weekly Report (available here: https://www.health.state.mn.us/diseases/coronavirus/stats/index.html). The data in the Weekly Report is presented as cumulative totals for each data type each week. I am taking weekly differences and assembling the data into charts. This data is by date of report, meaning the charts are documenting new events reported this week, even though the underlying event occurred sometime in the past. The data is provided for 5 year age groups, and I am assembling into 10 year age groups to make the charts more readable.
2. The data for the Covid cases per week come from a data file published along with the Minnesota Weekly Report, here: https://www.health.state.mn.us/diseases/coronavirus/stats/index.html#wagscd1 This data is published by date of specimen collection, rather than by date of report as the other data is. The data is provided as cases per week in 5 year age groups. I am compiling the data into 10 year age groups in order for the charts to be more readable. This data is updated by date of specimen collection, so it is possible that past week’s data will be updated.
