In this post on breakthroughs, events are looked at by age group. Note that although the 12-17 group is not heavily vaxed, it has a high proportion of vaxed events.
 Dave’s notes:
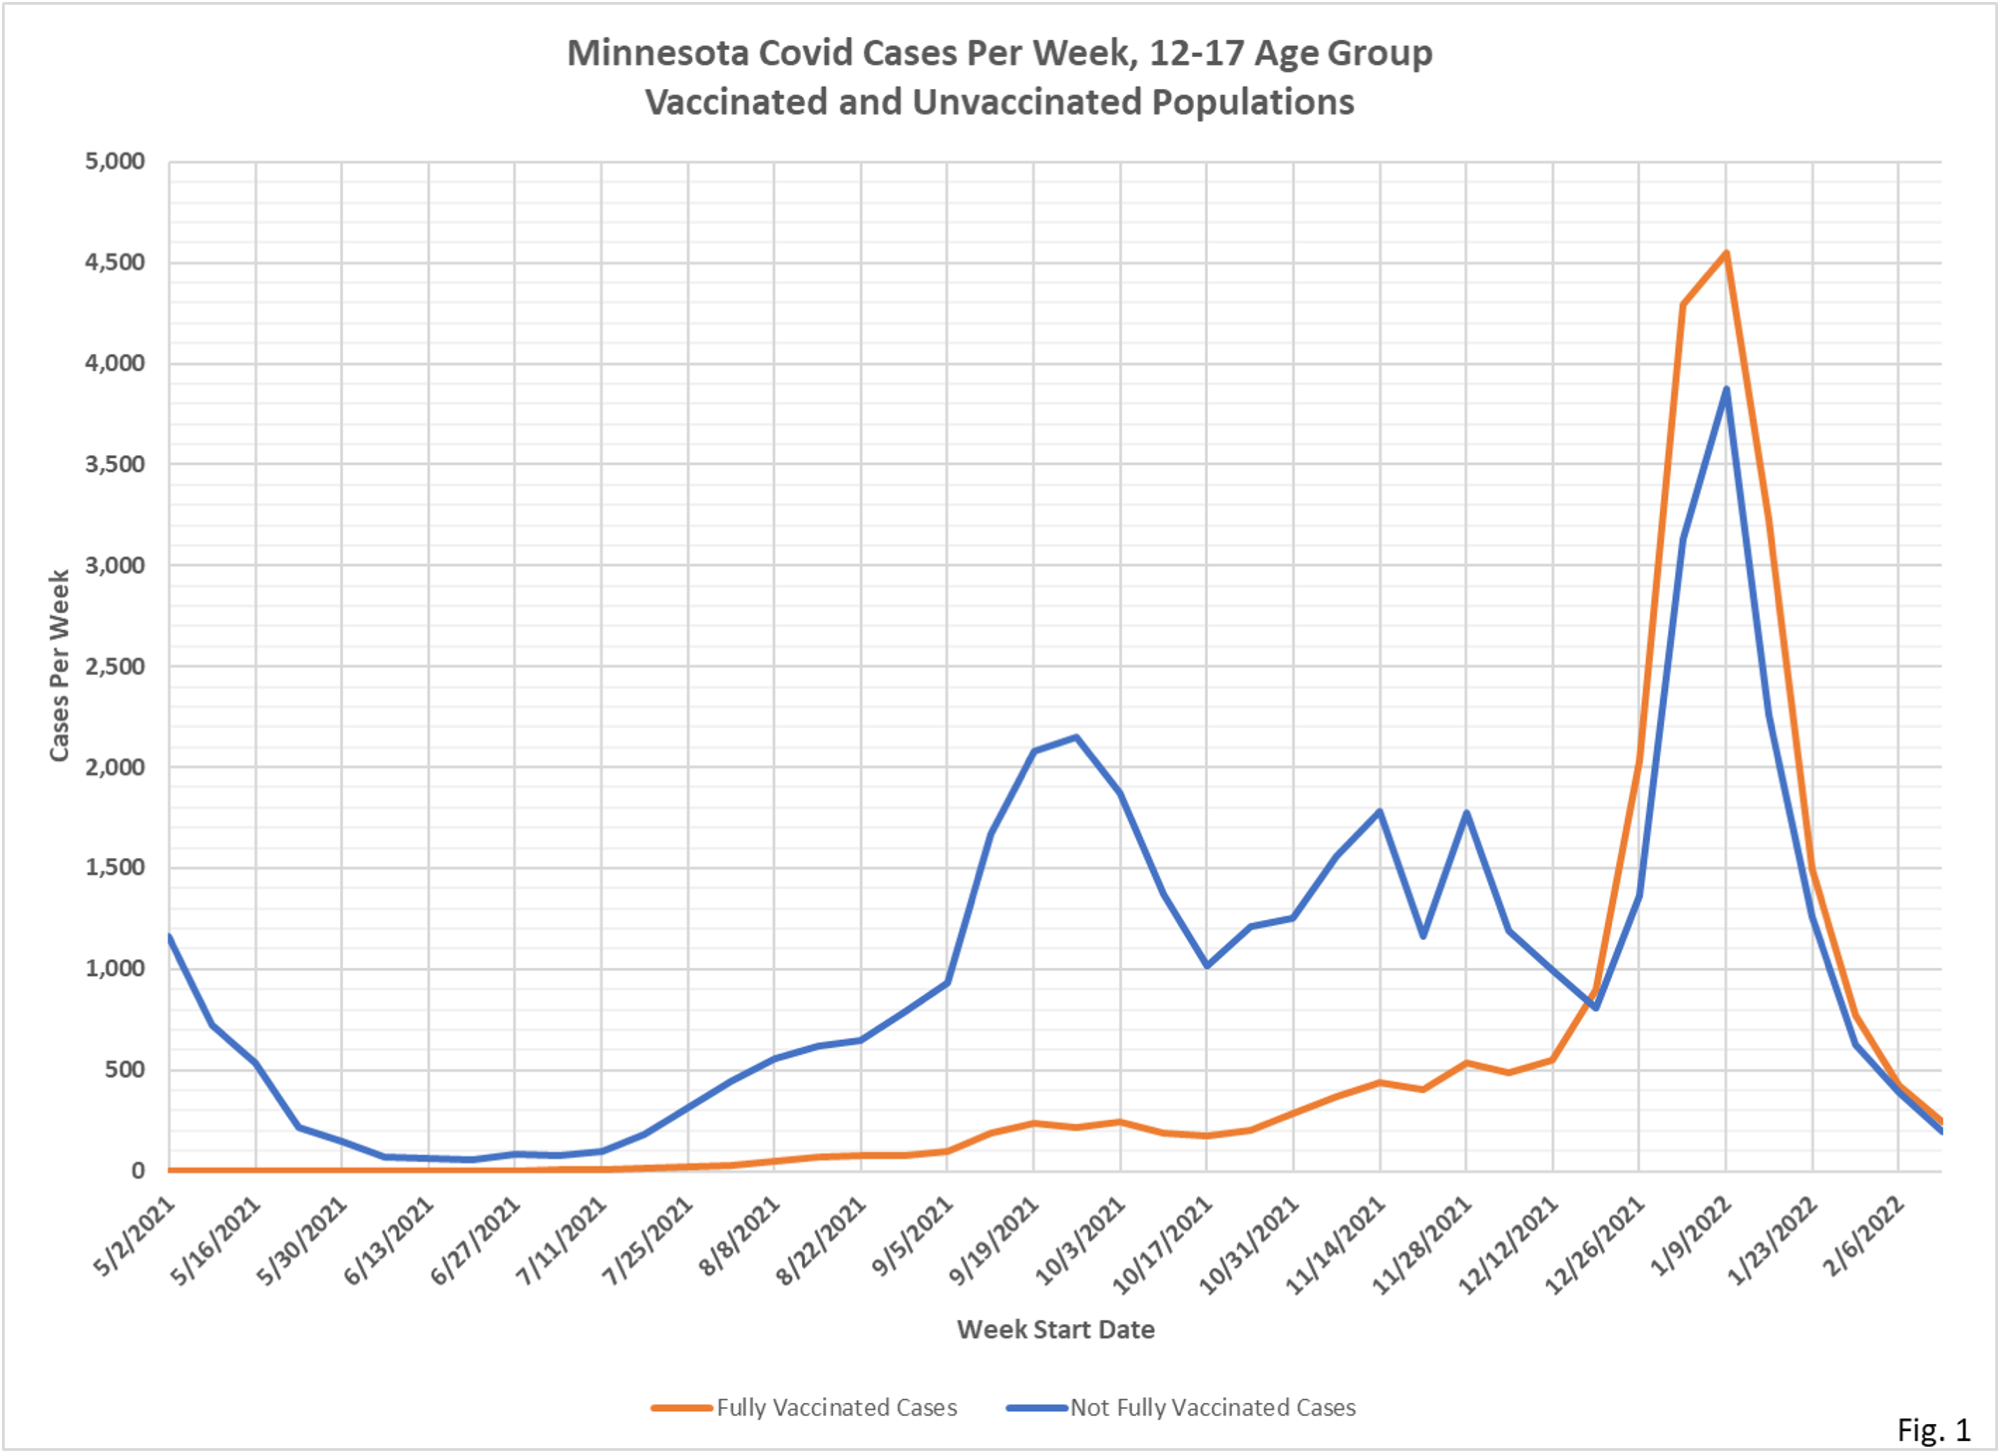
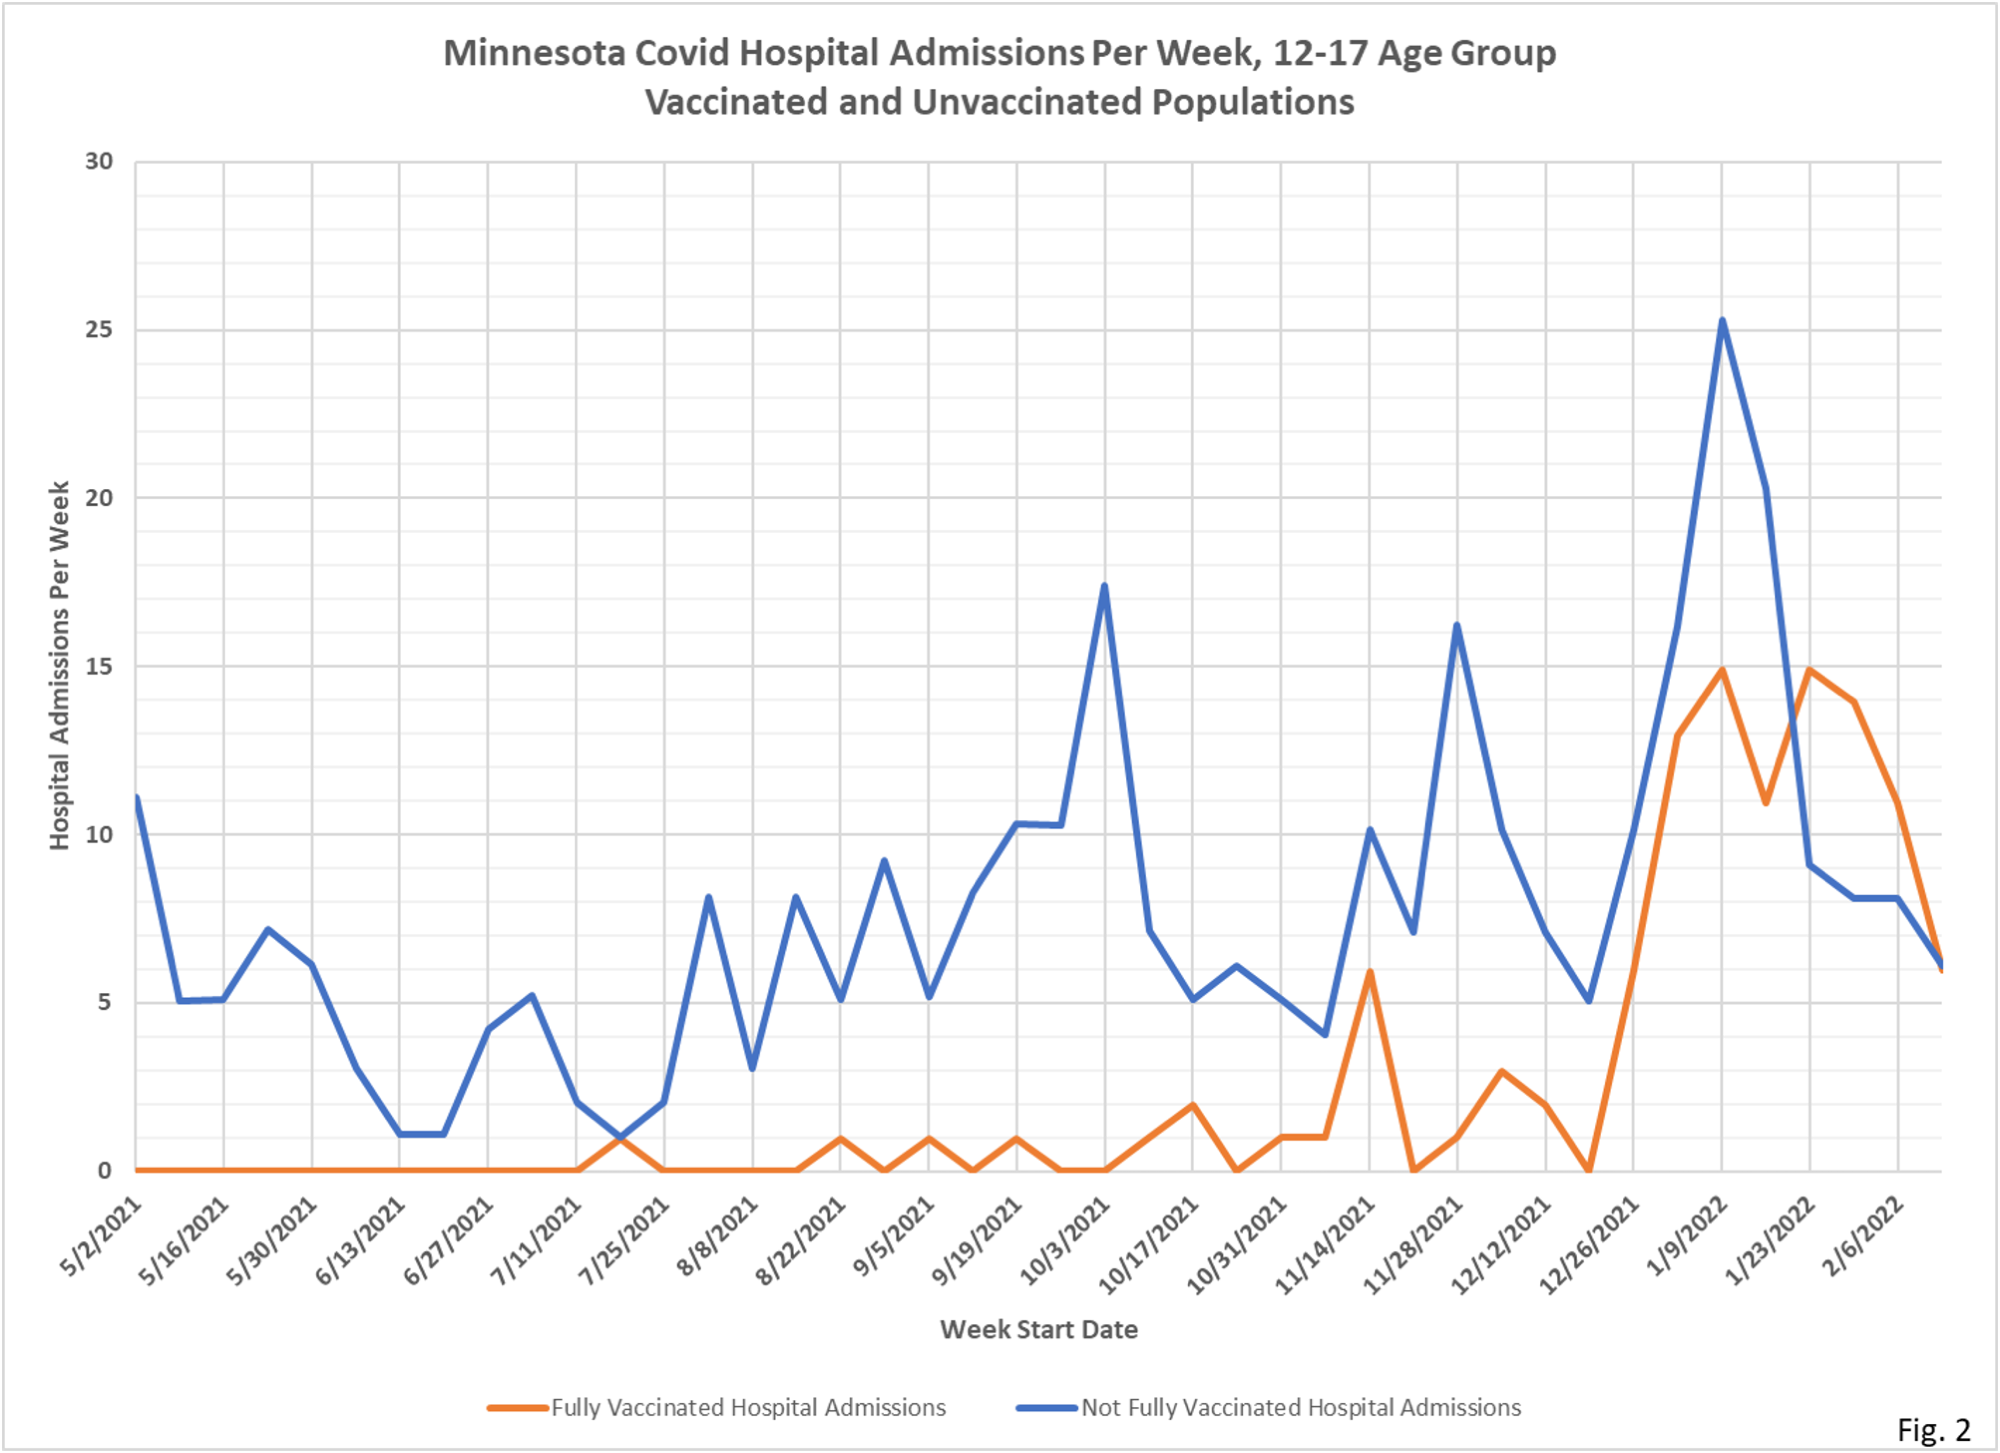
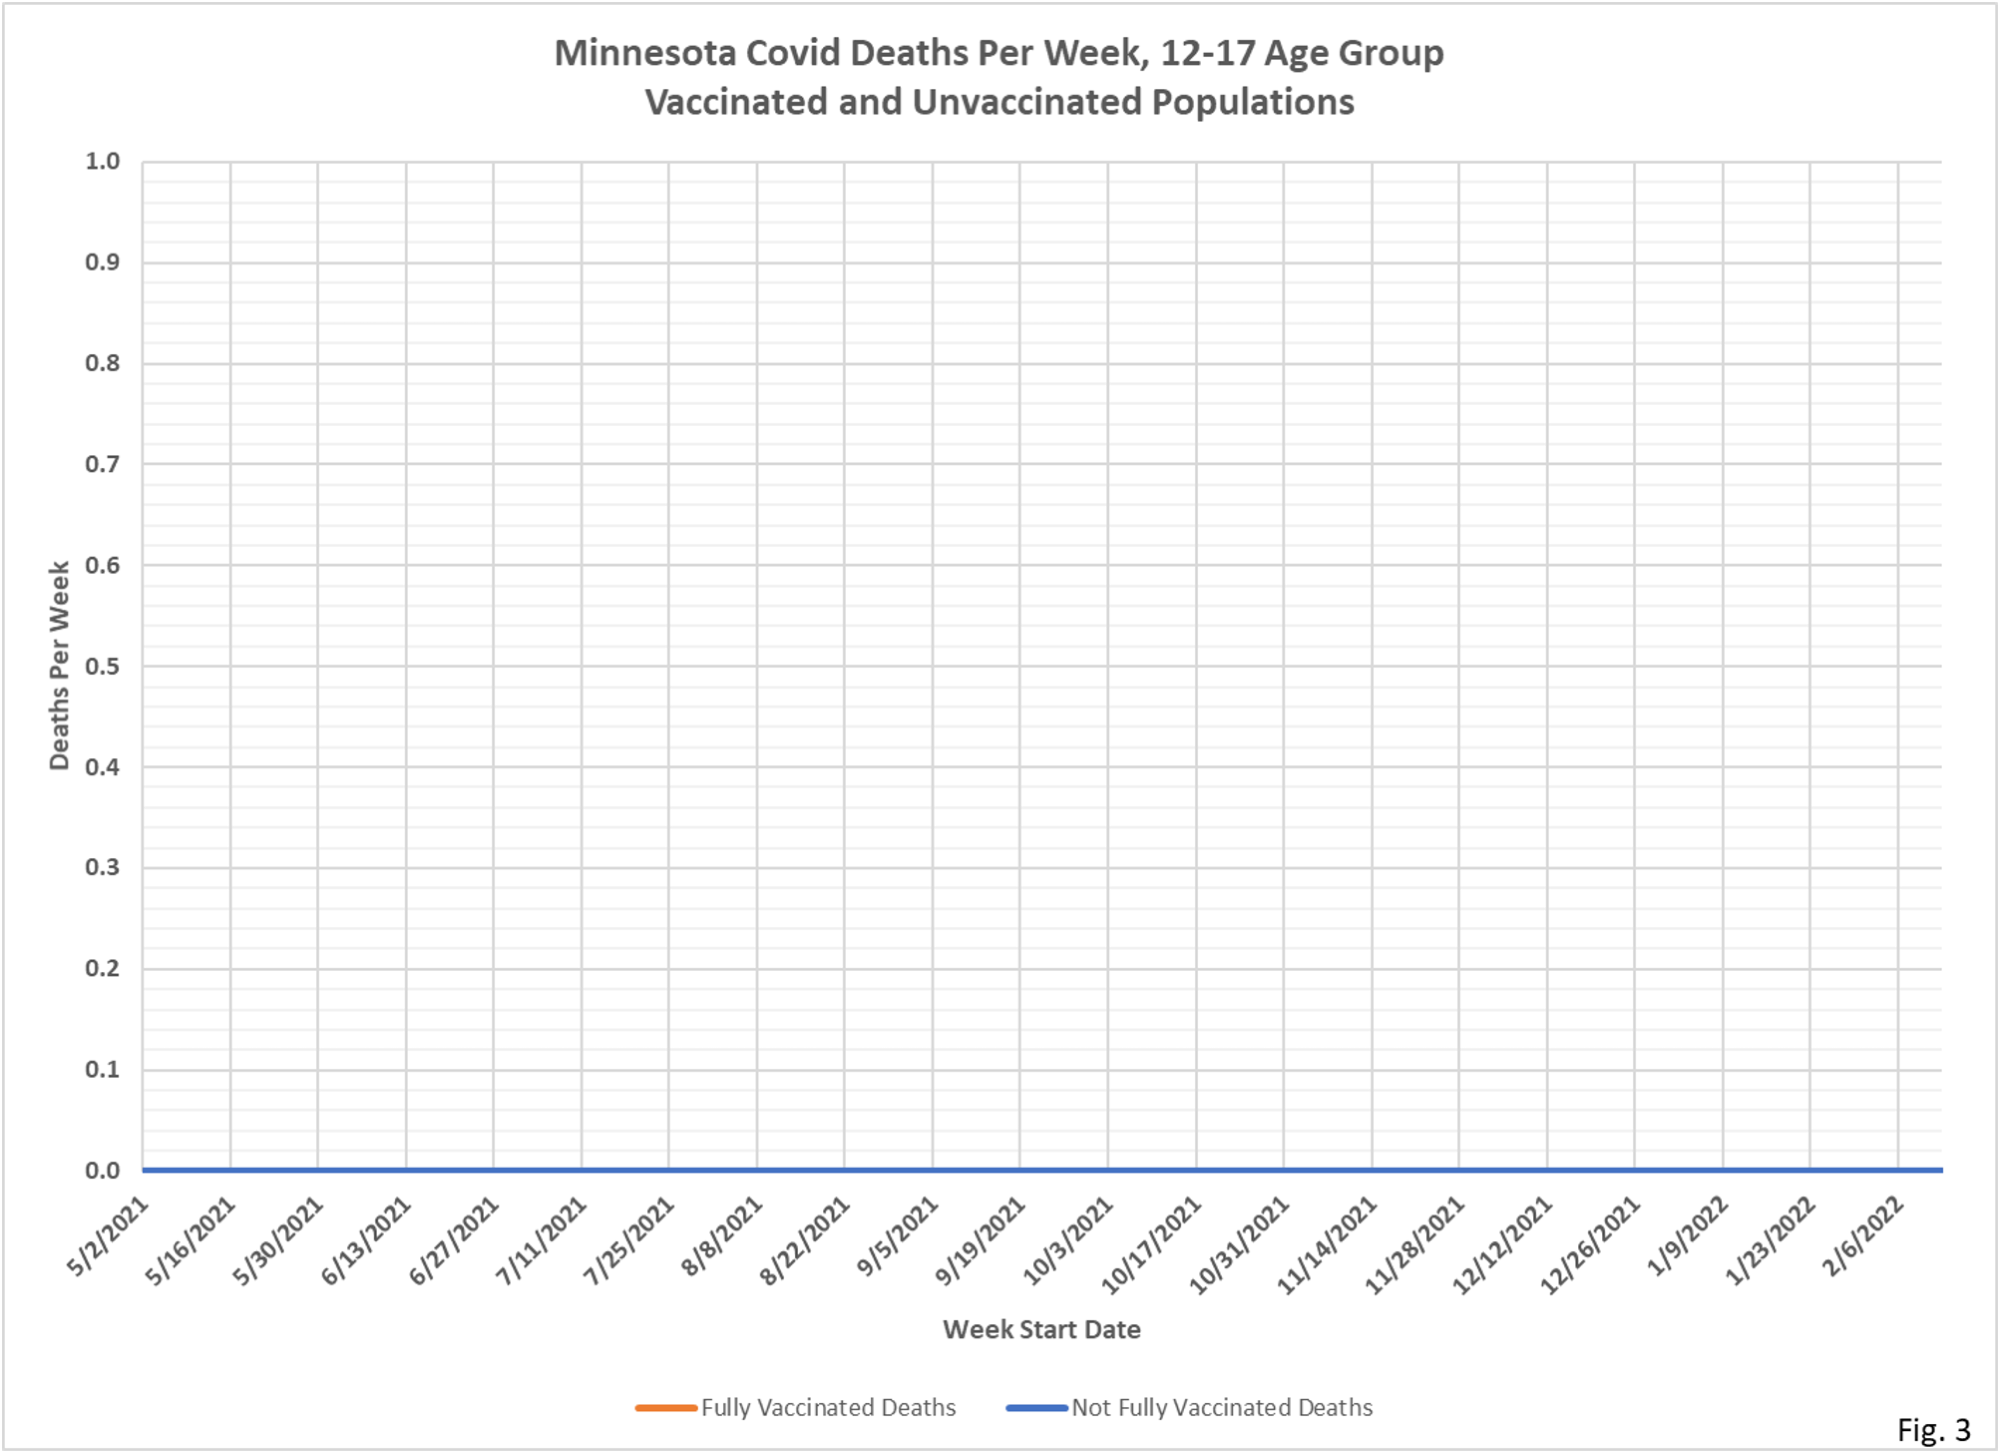
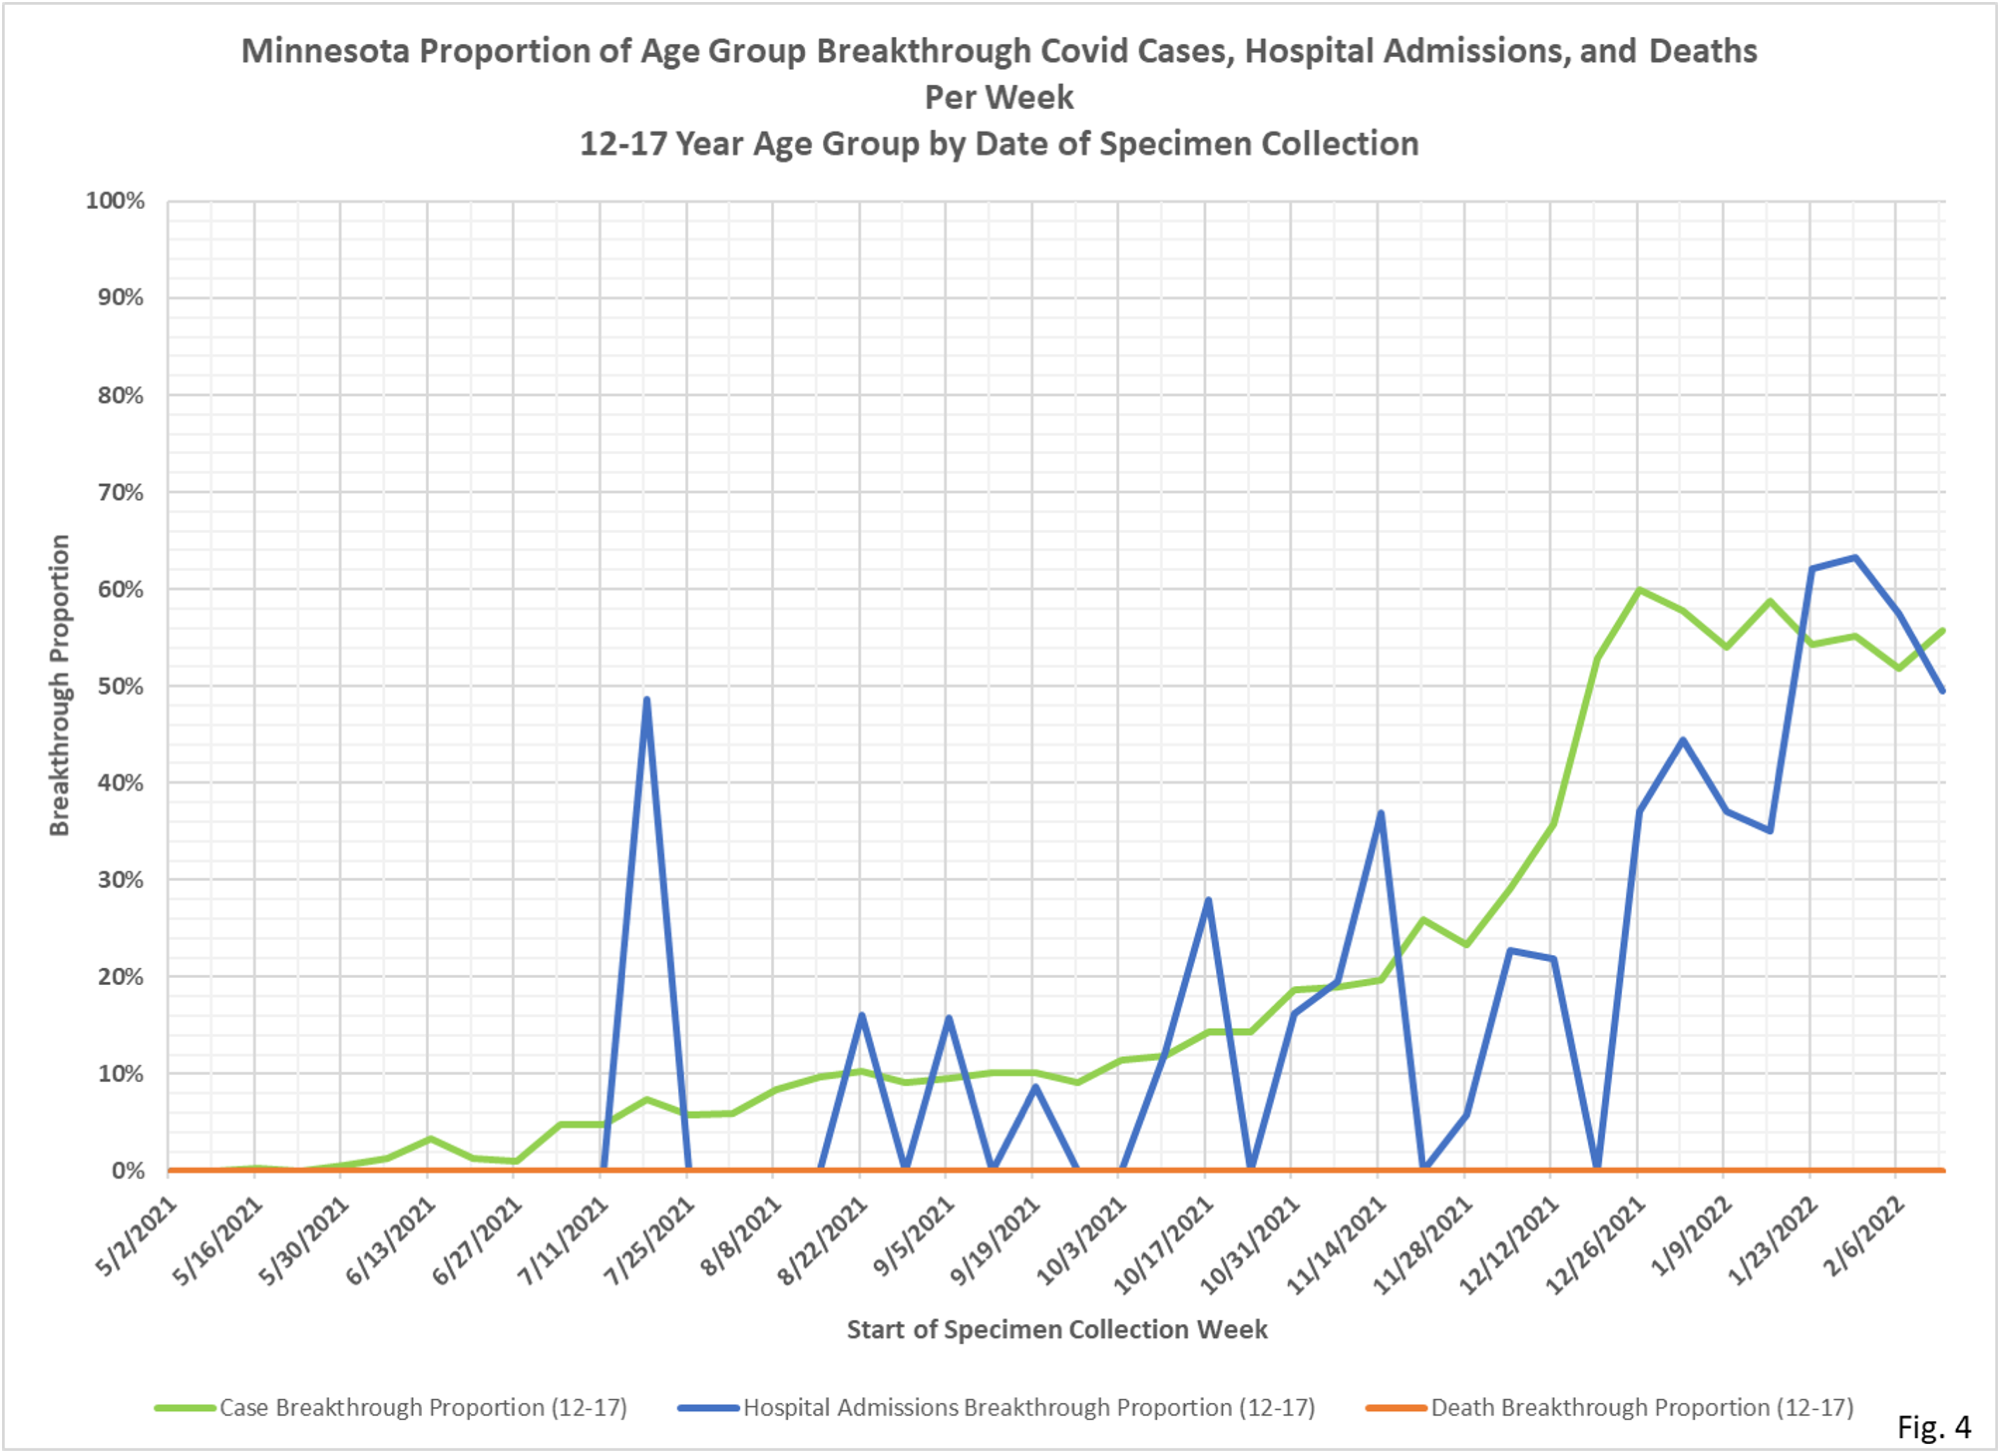
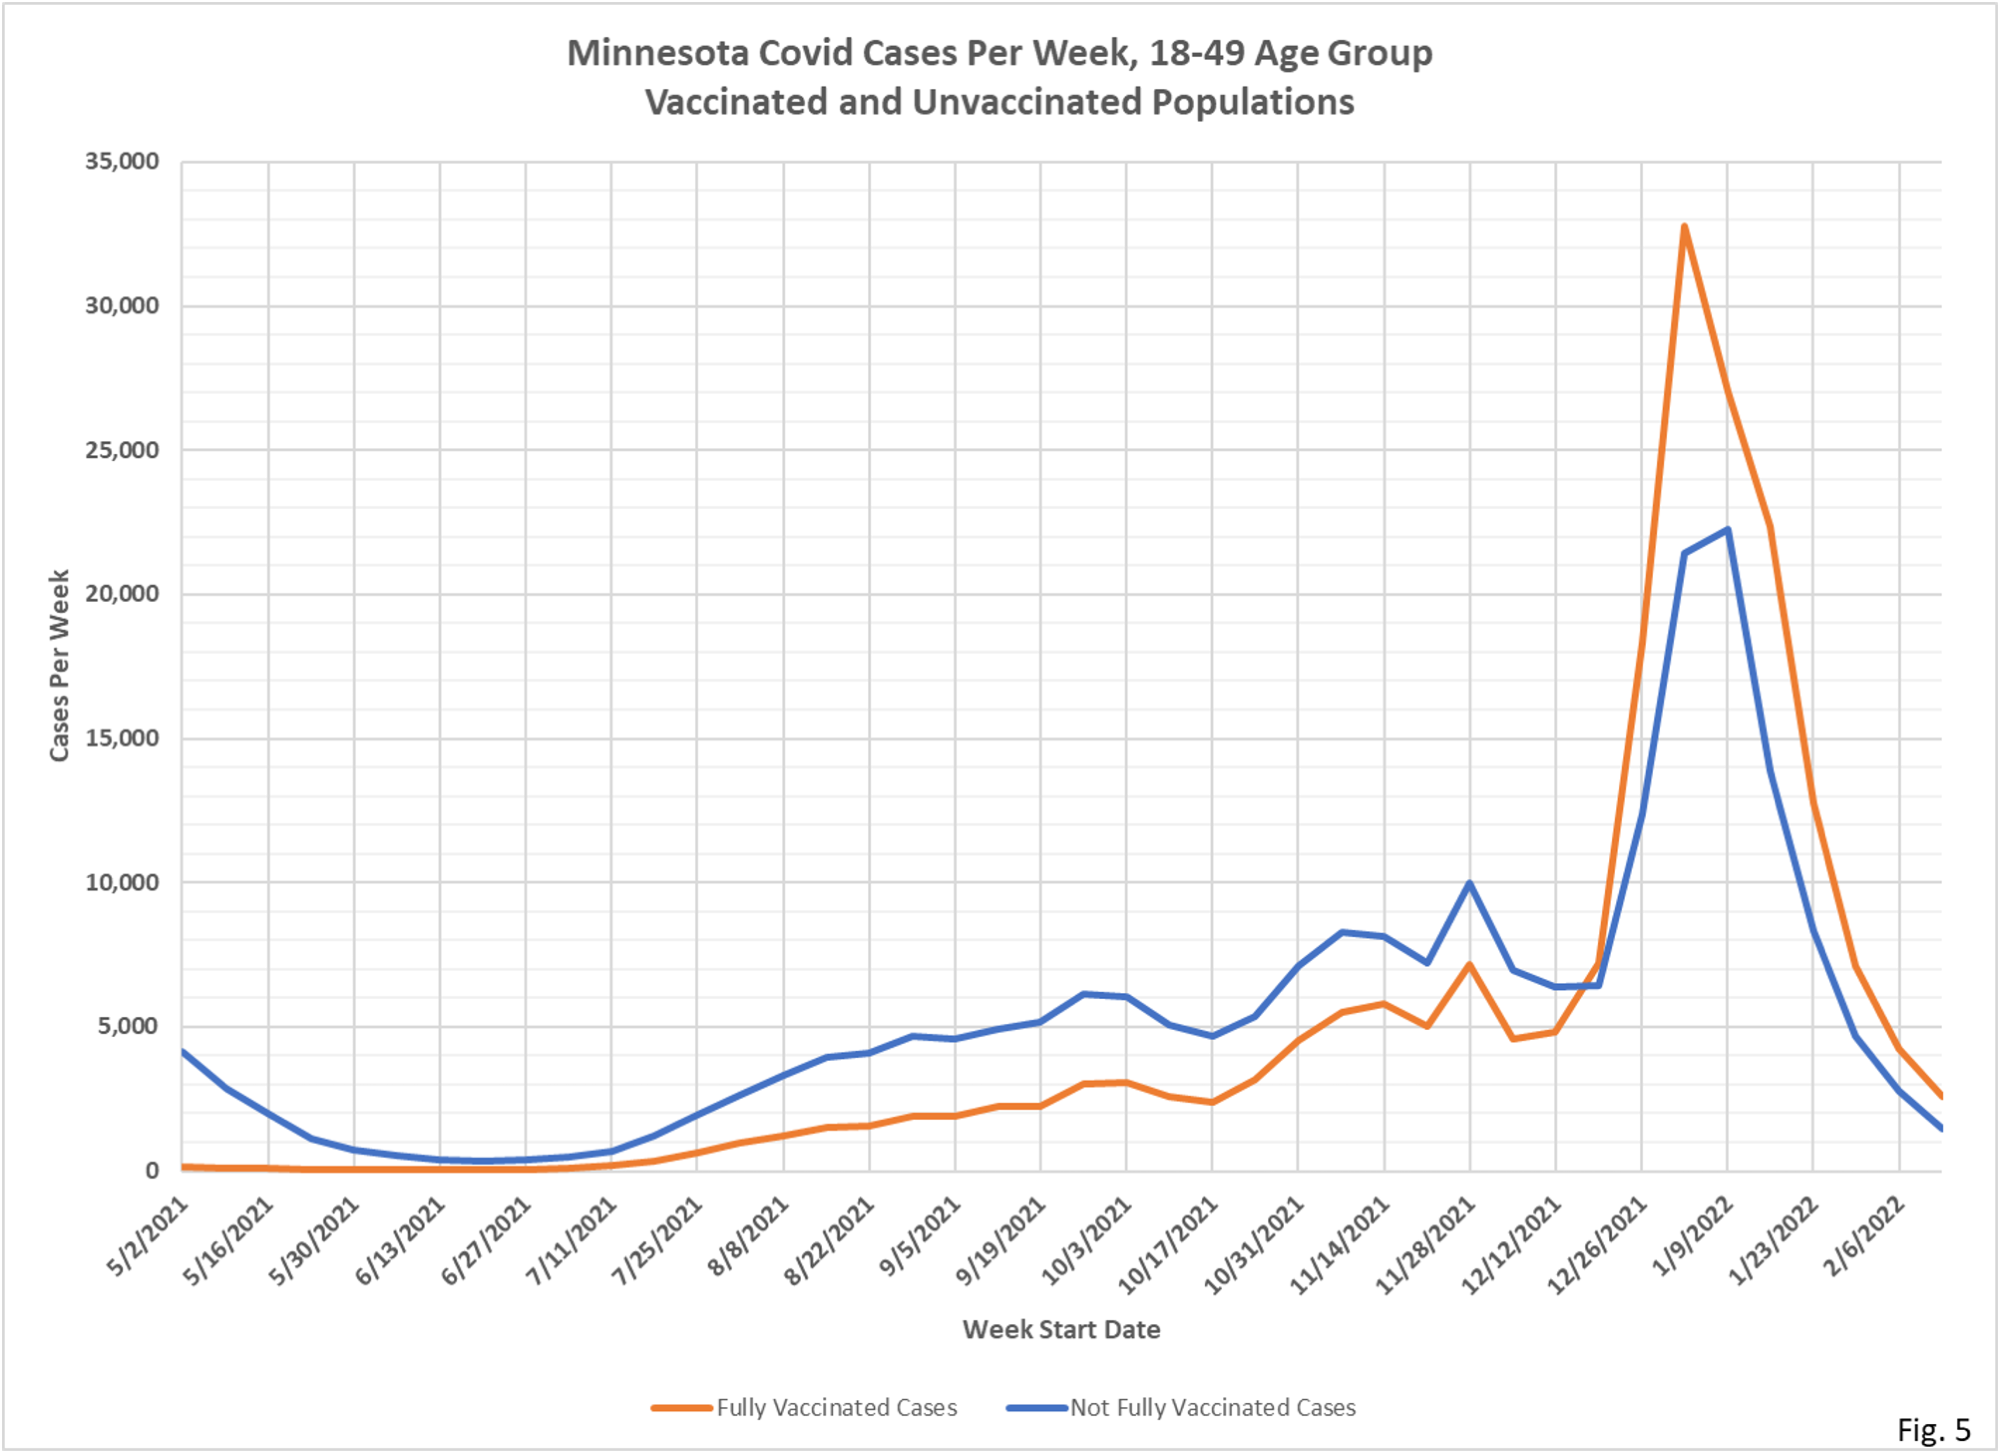
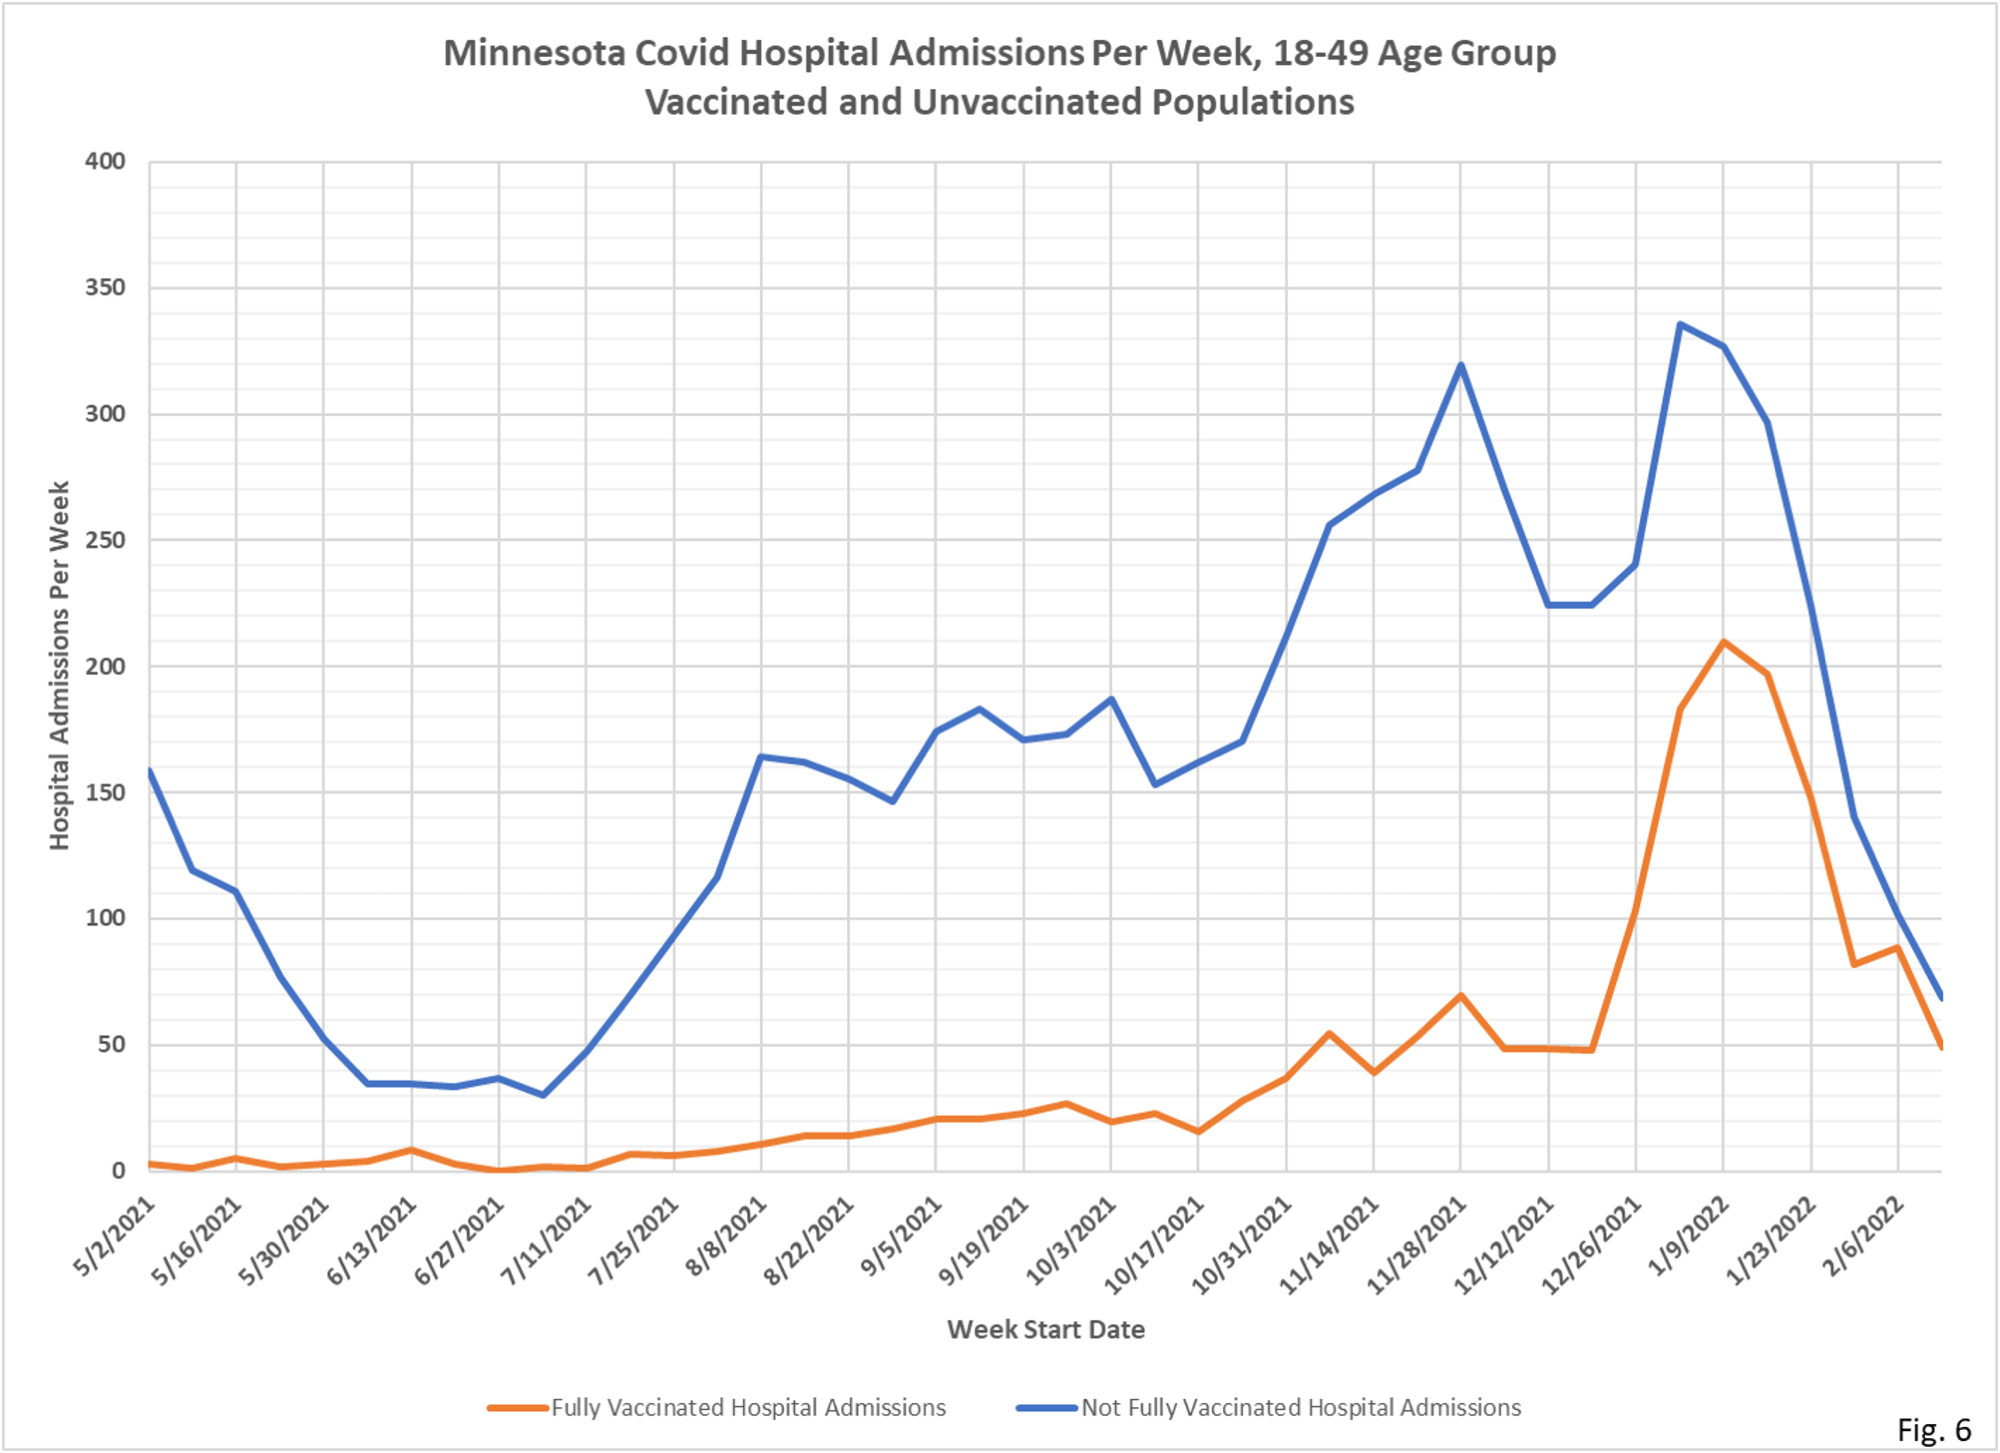
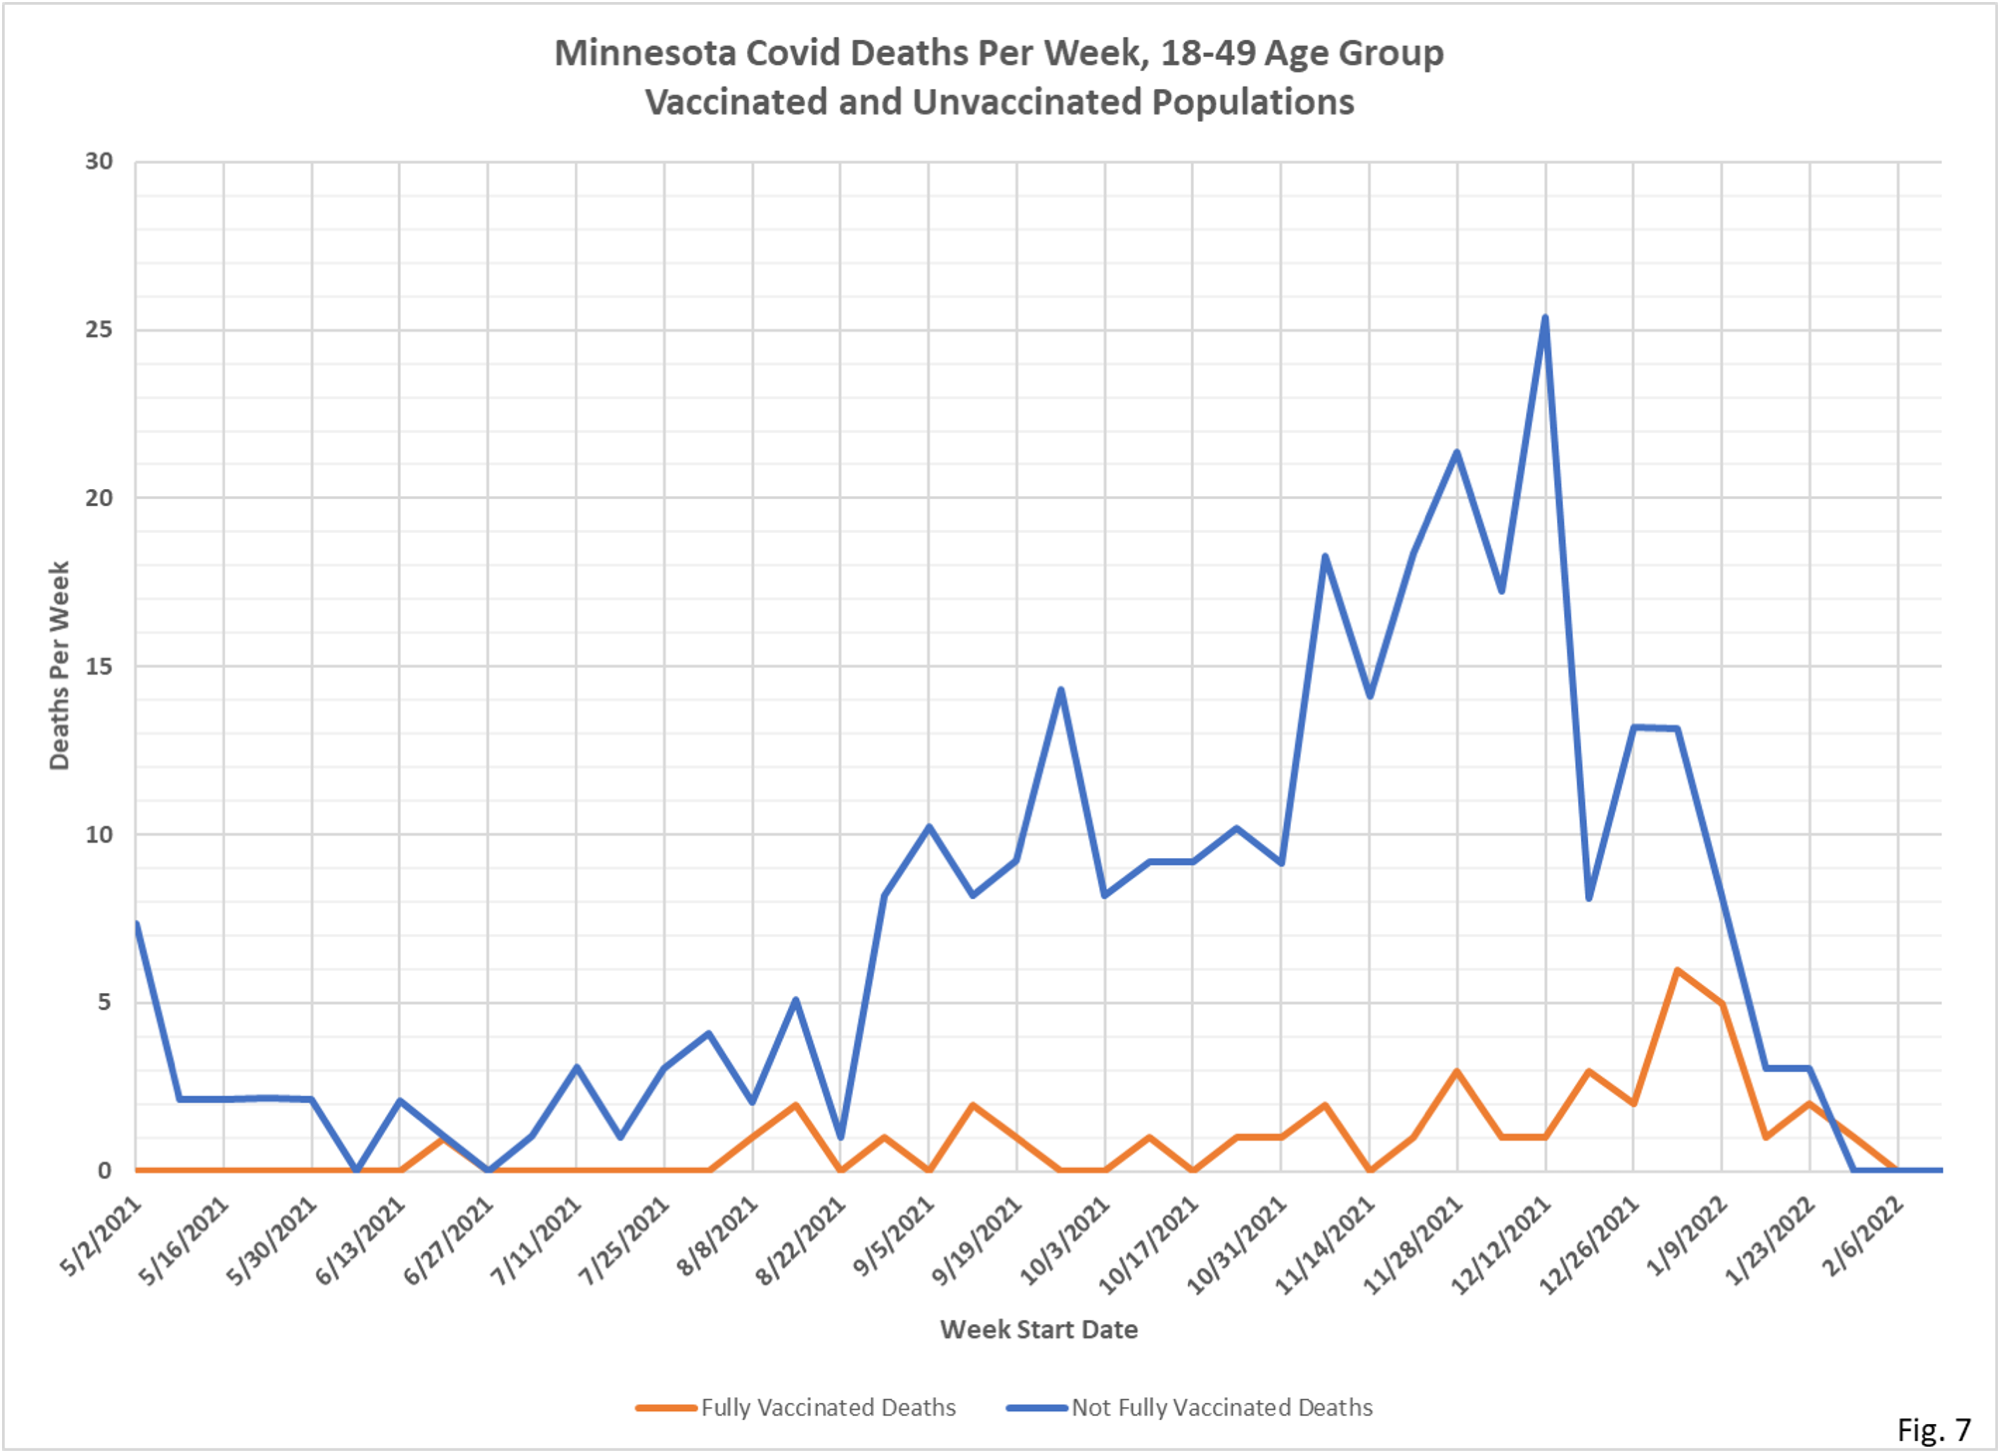
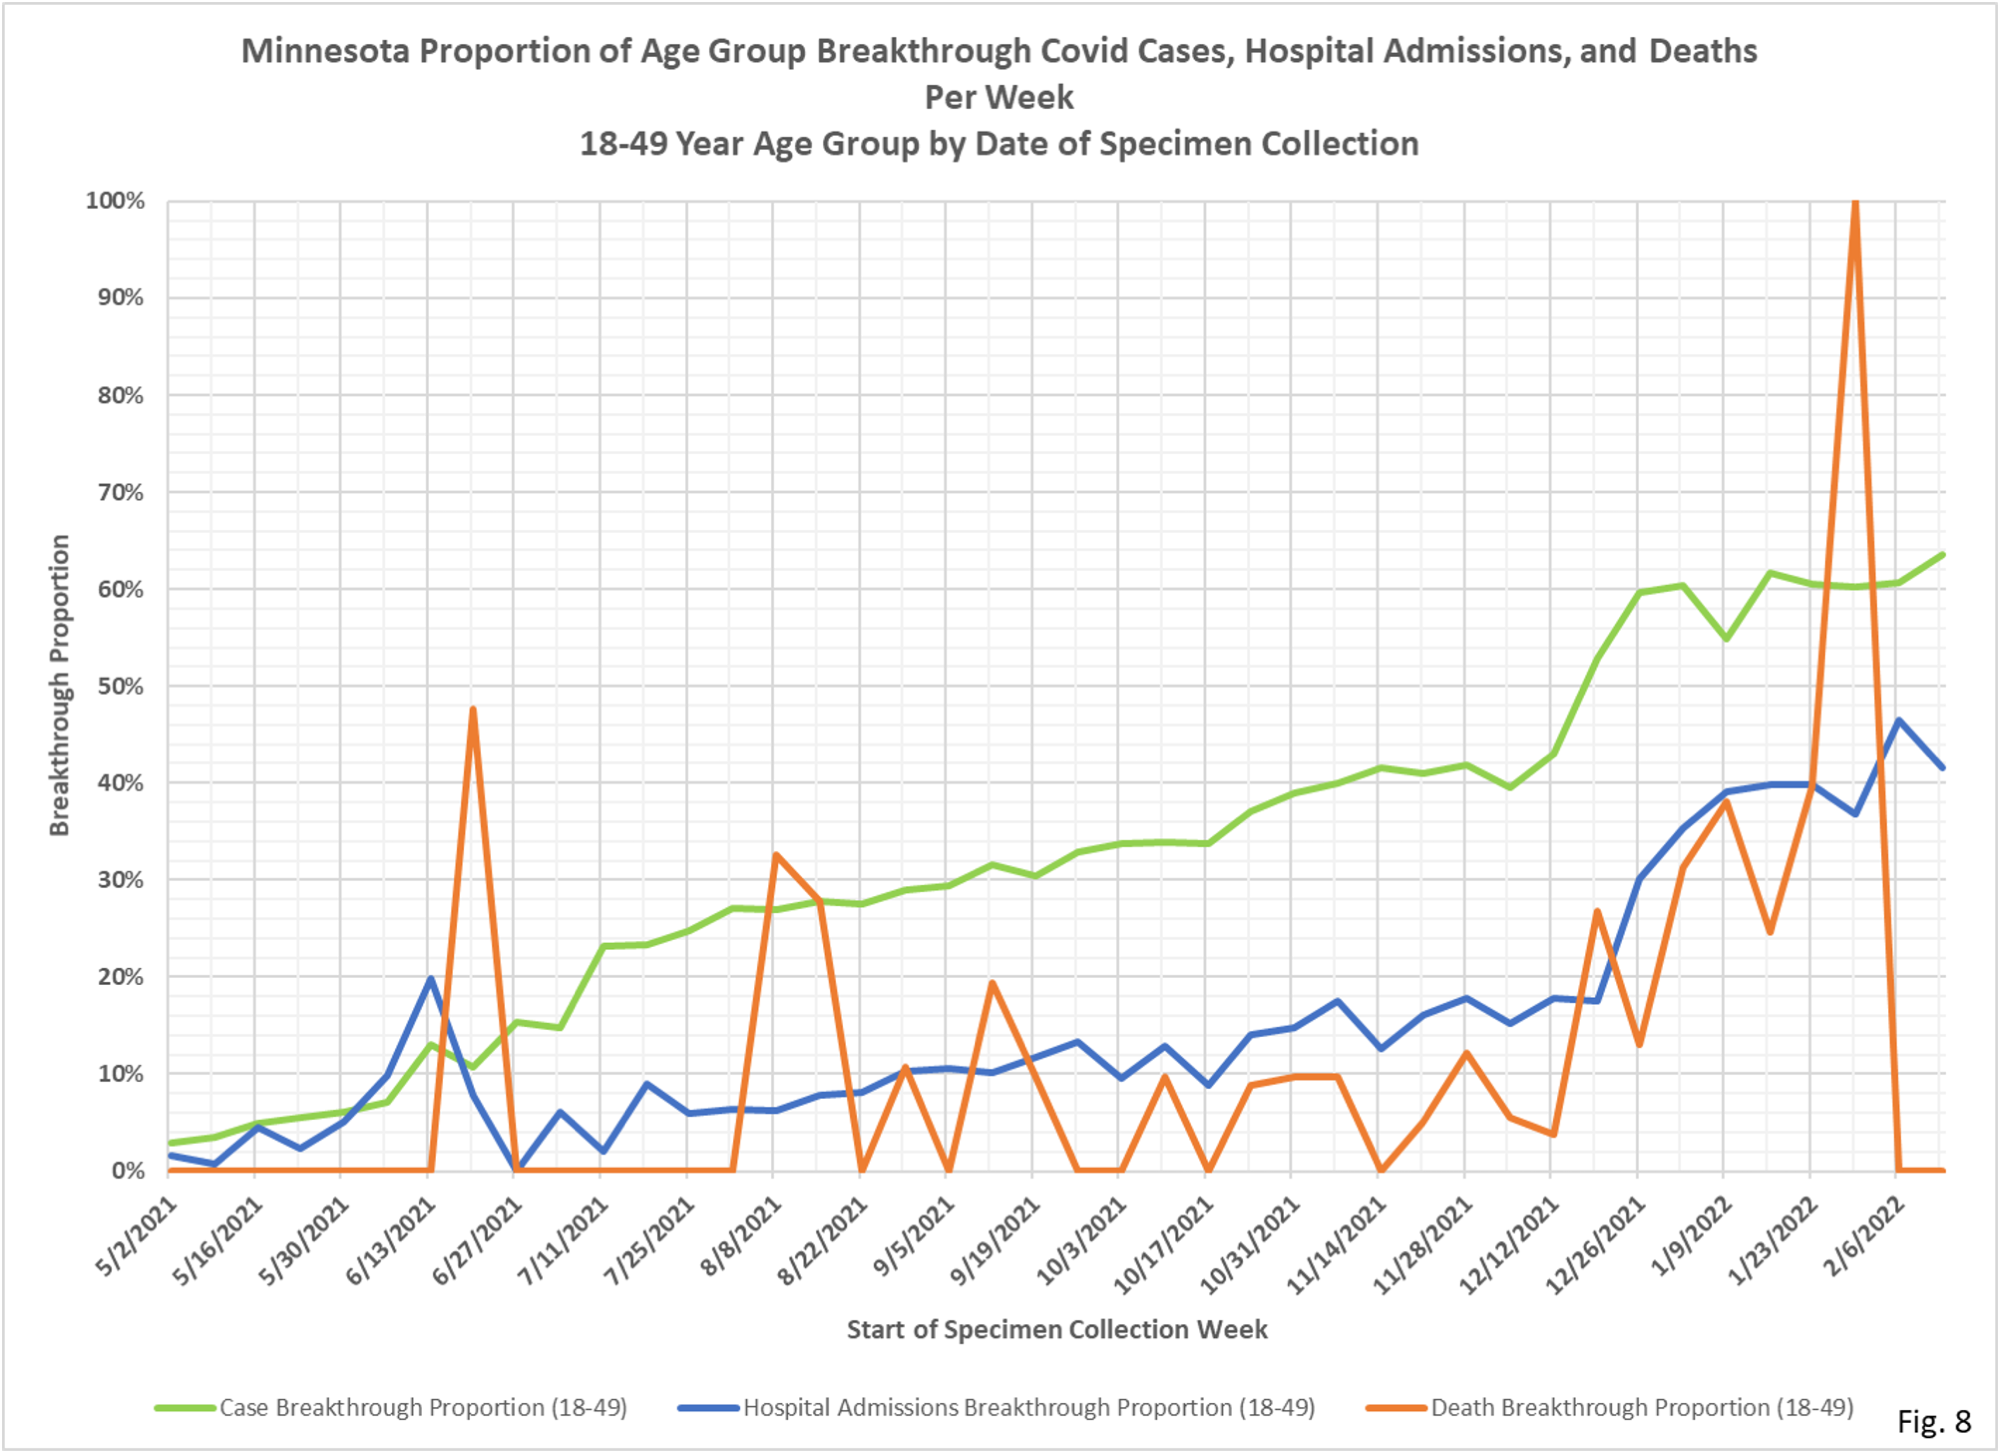
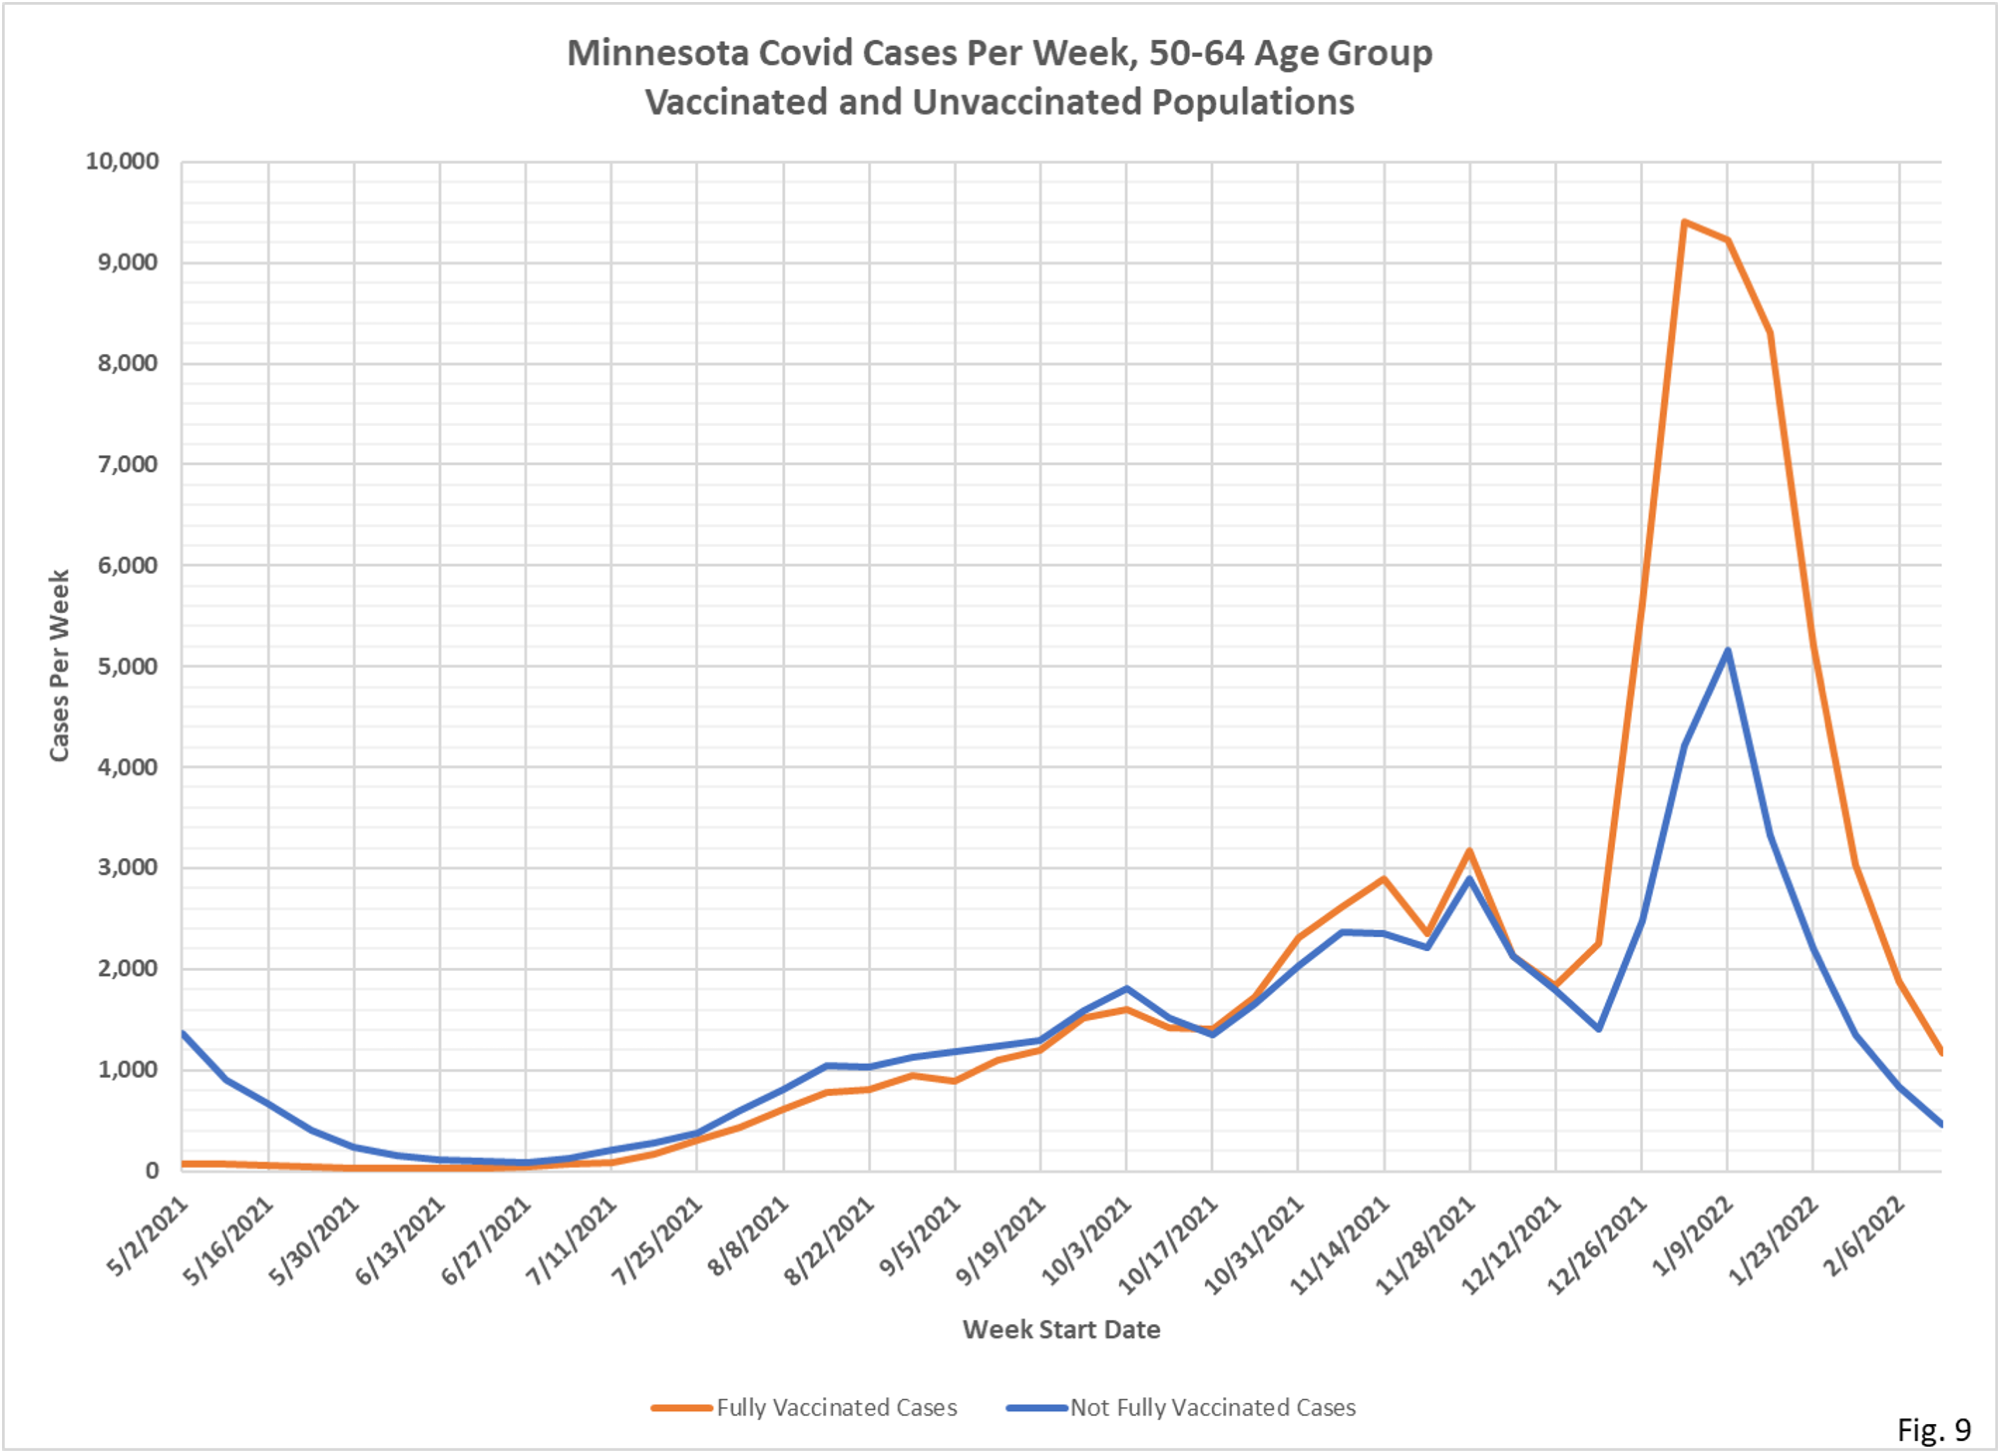
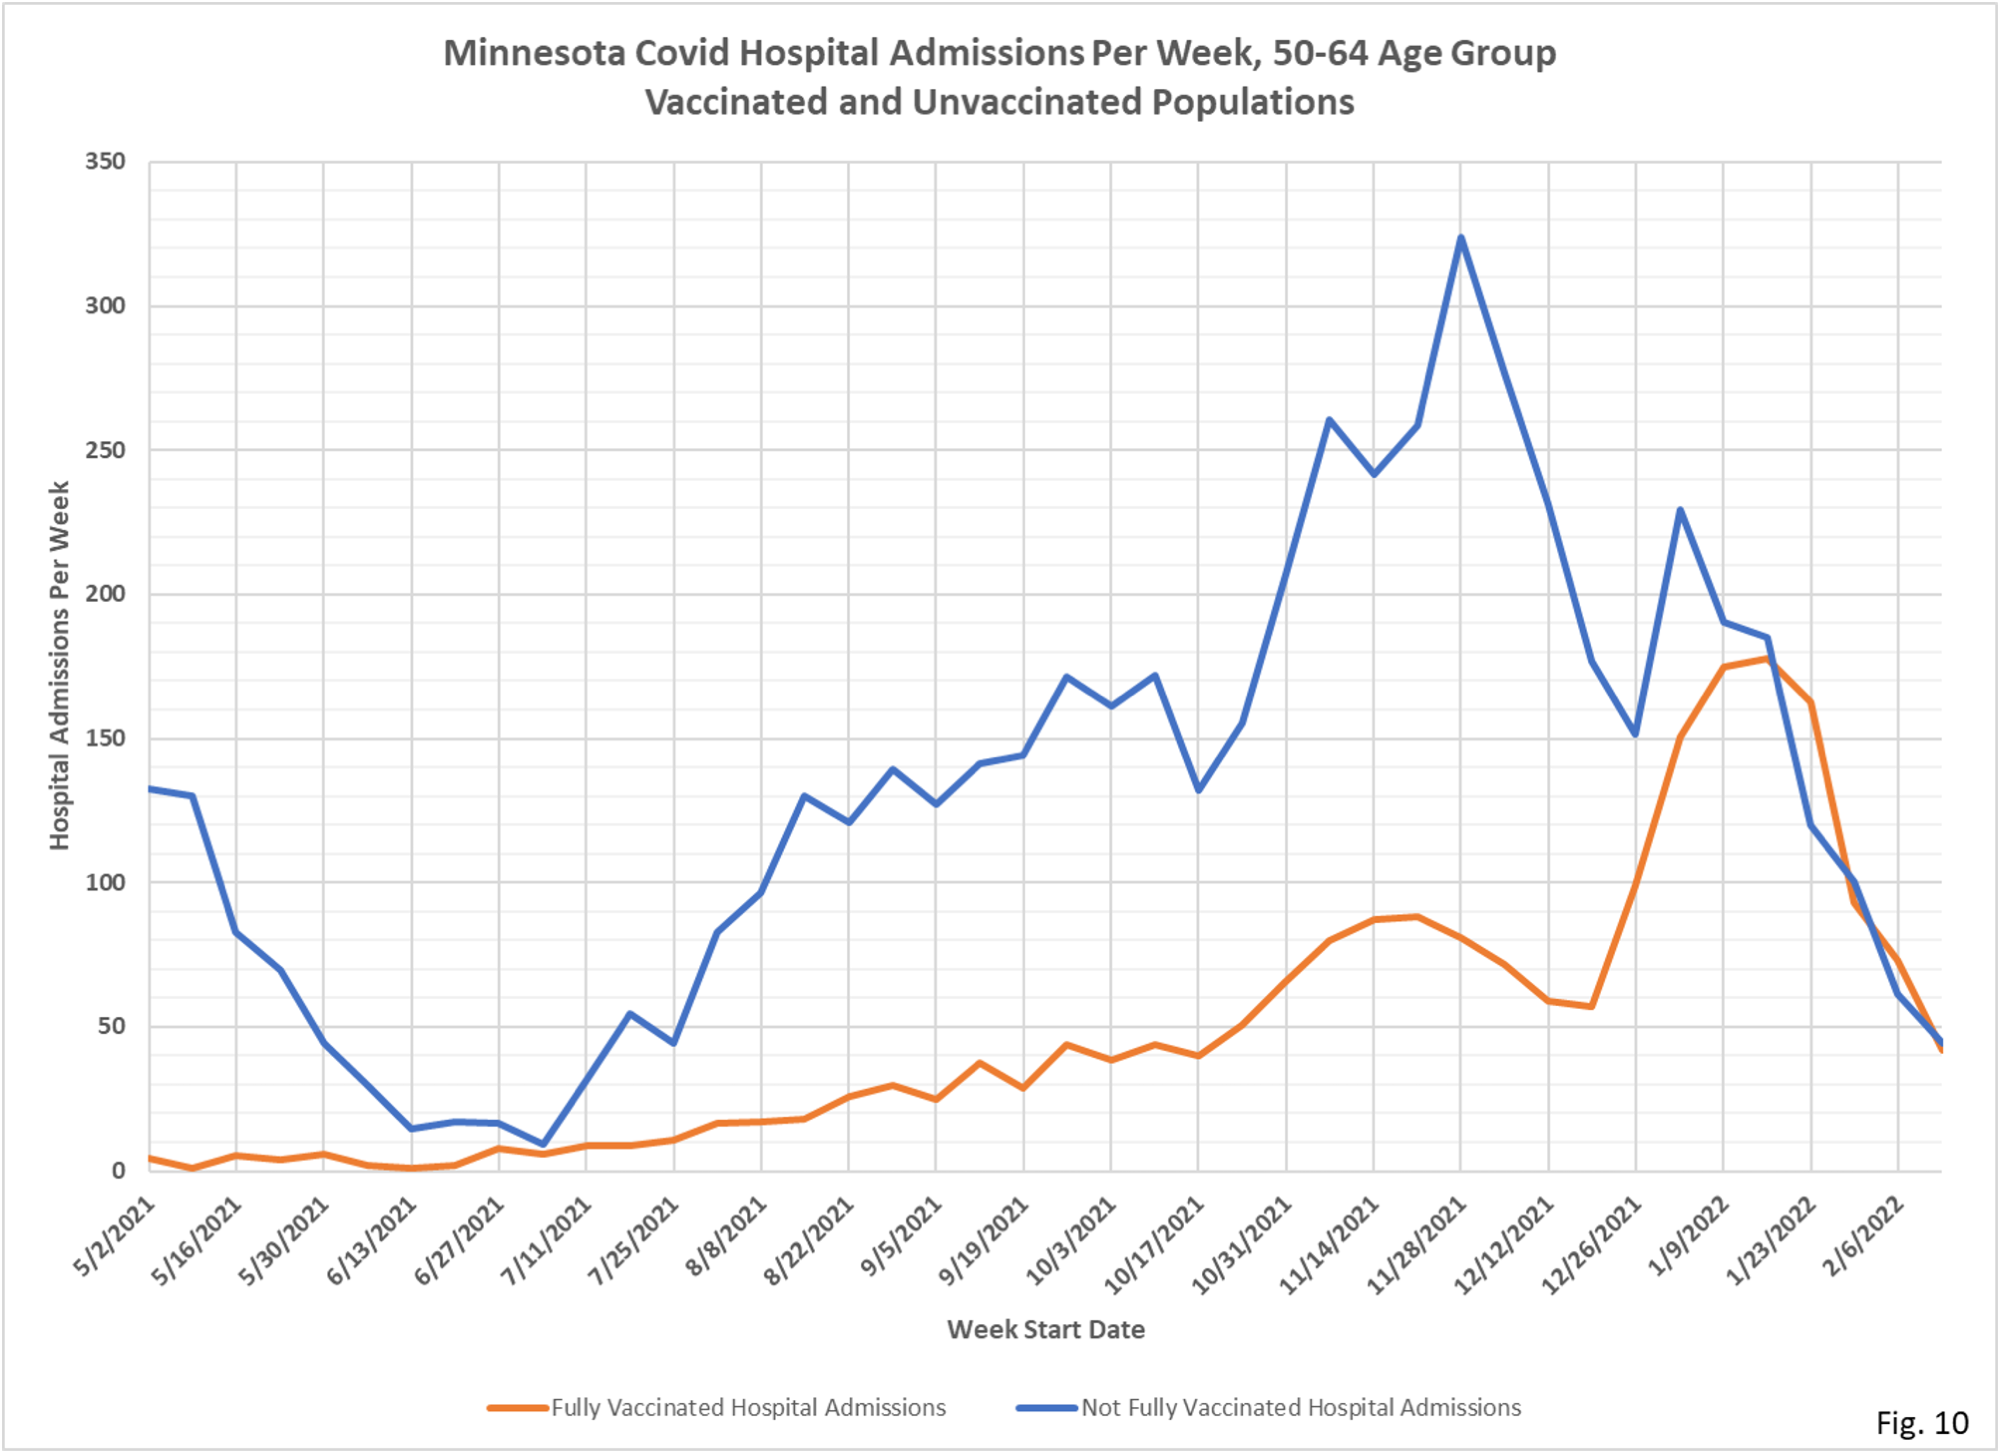
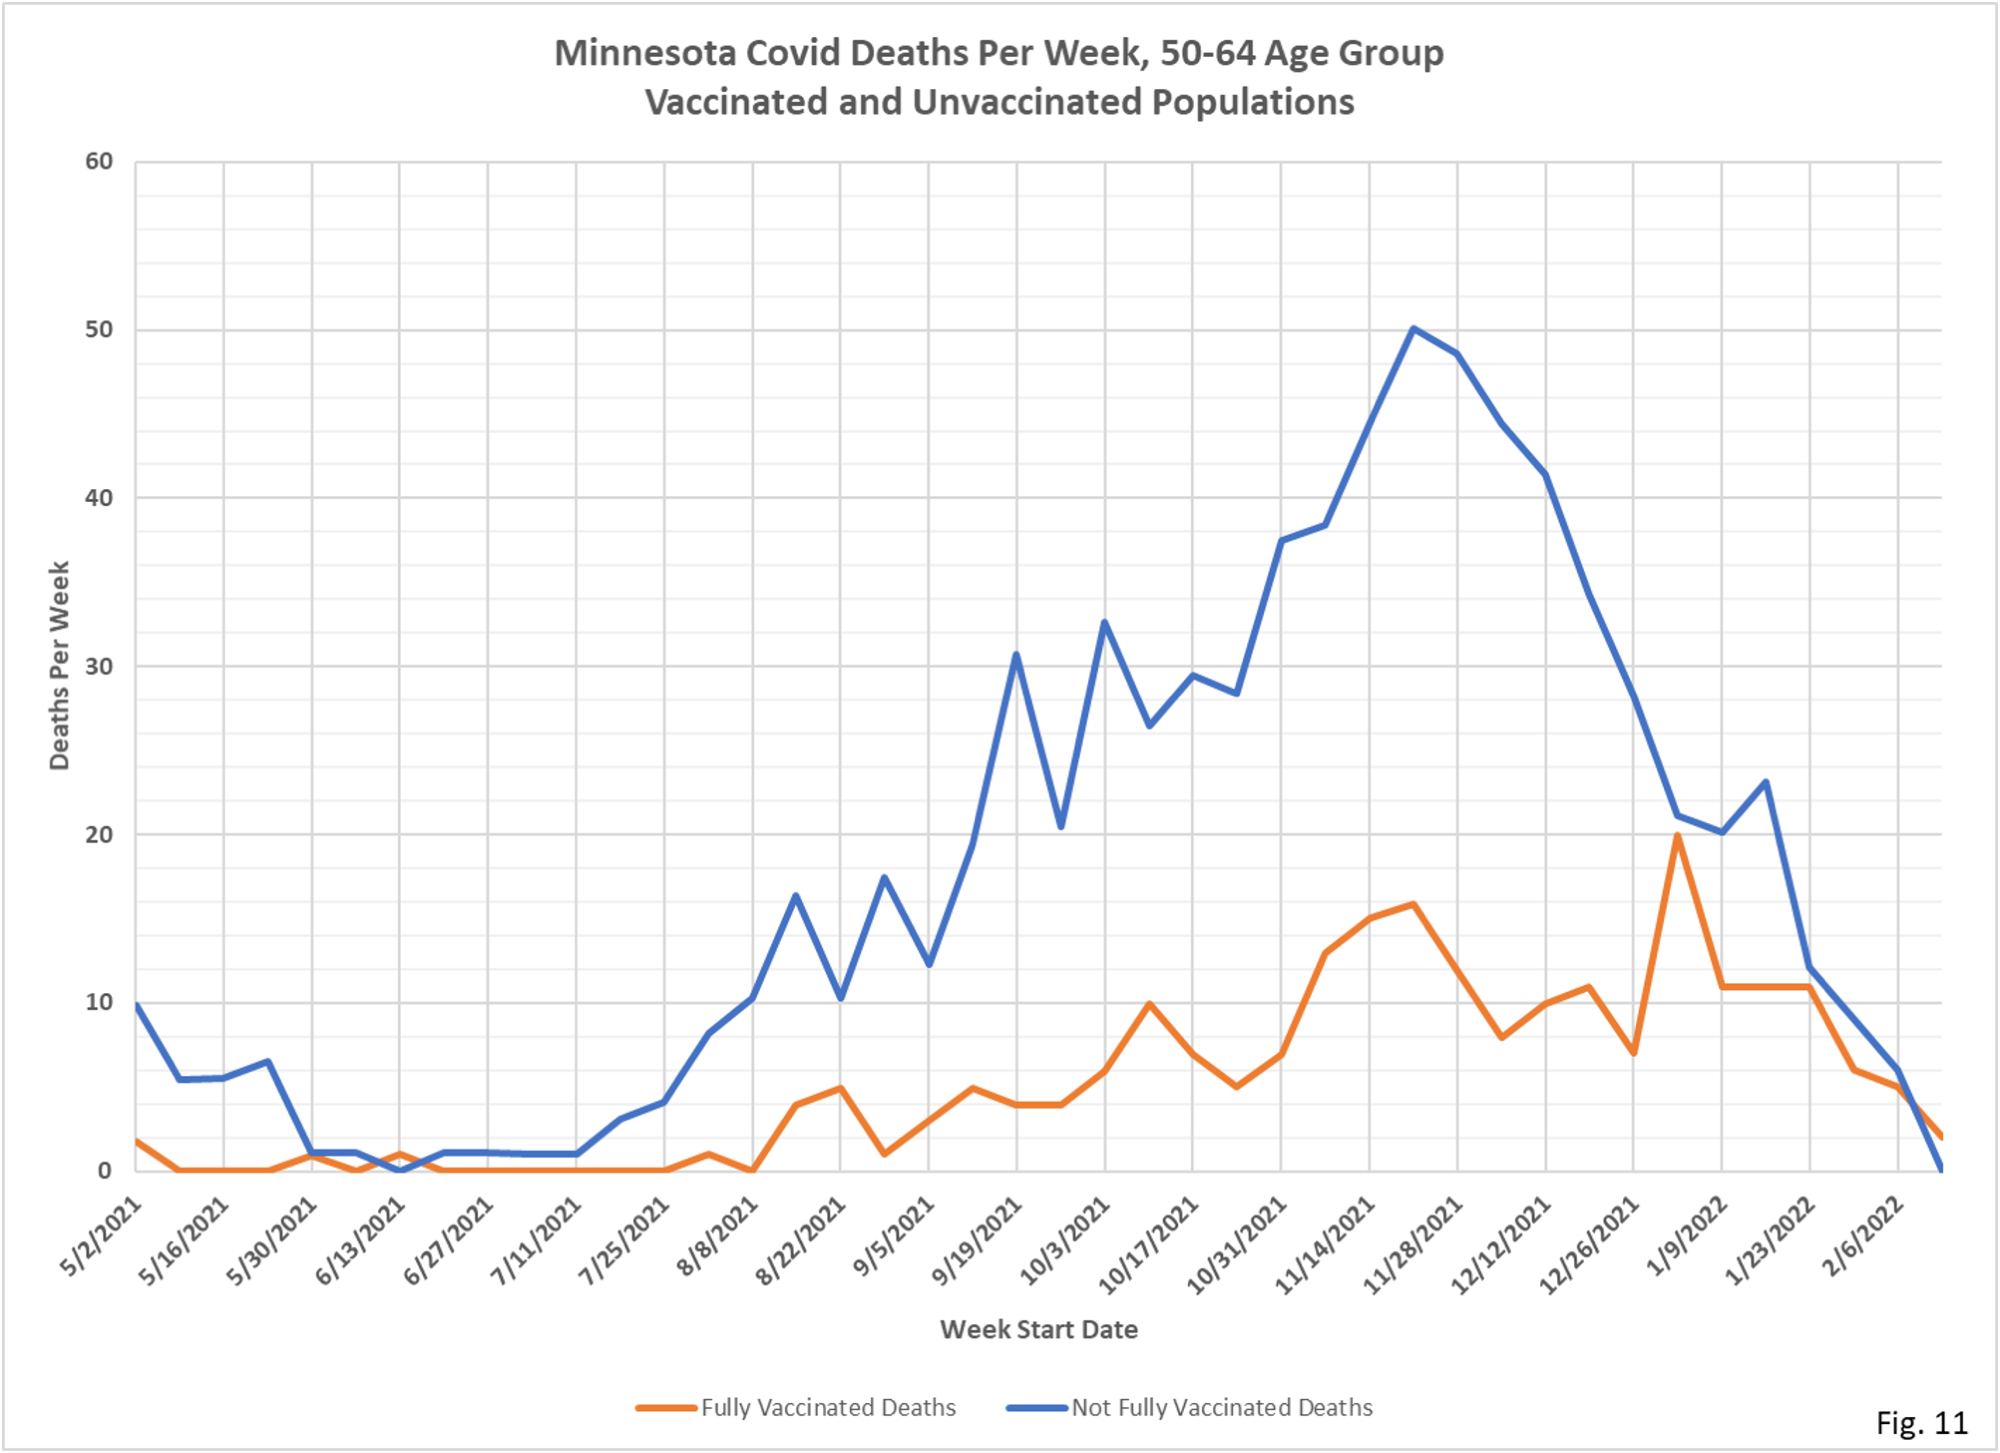
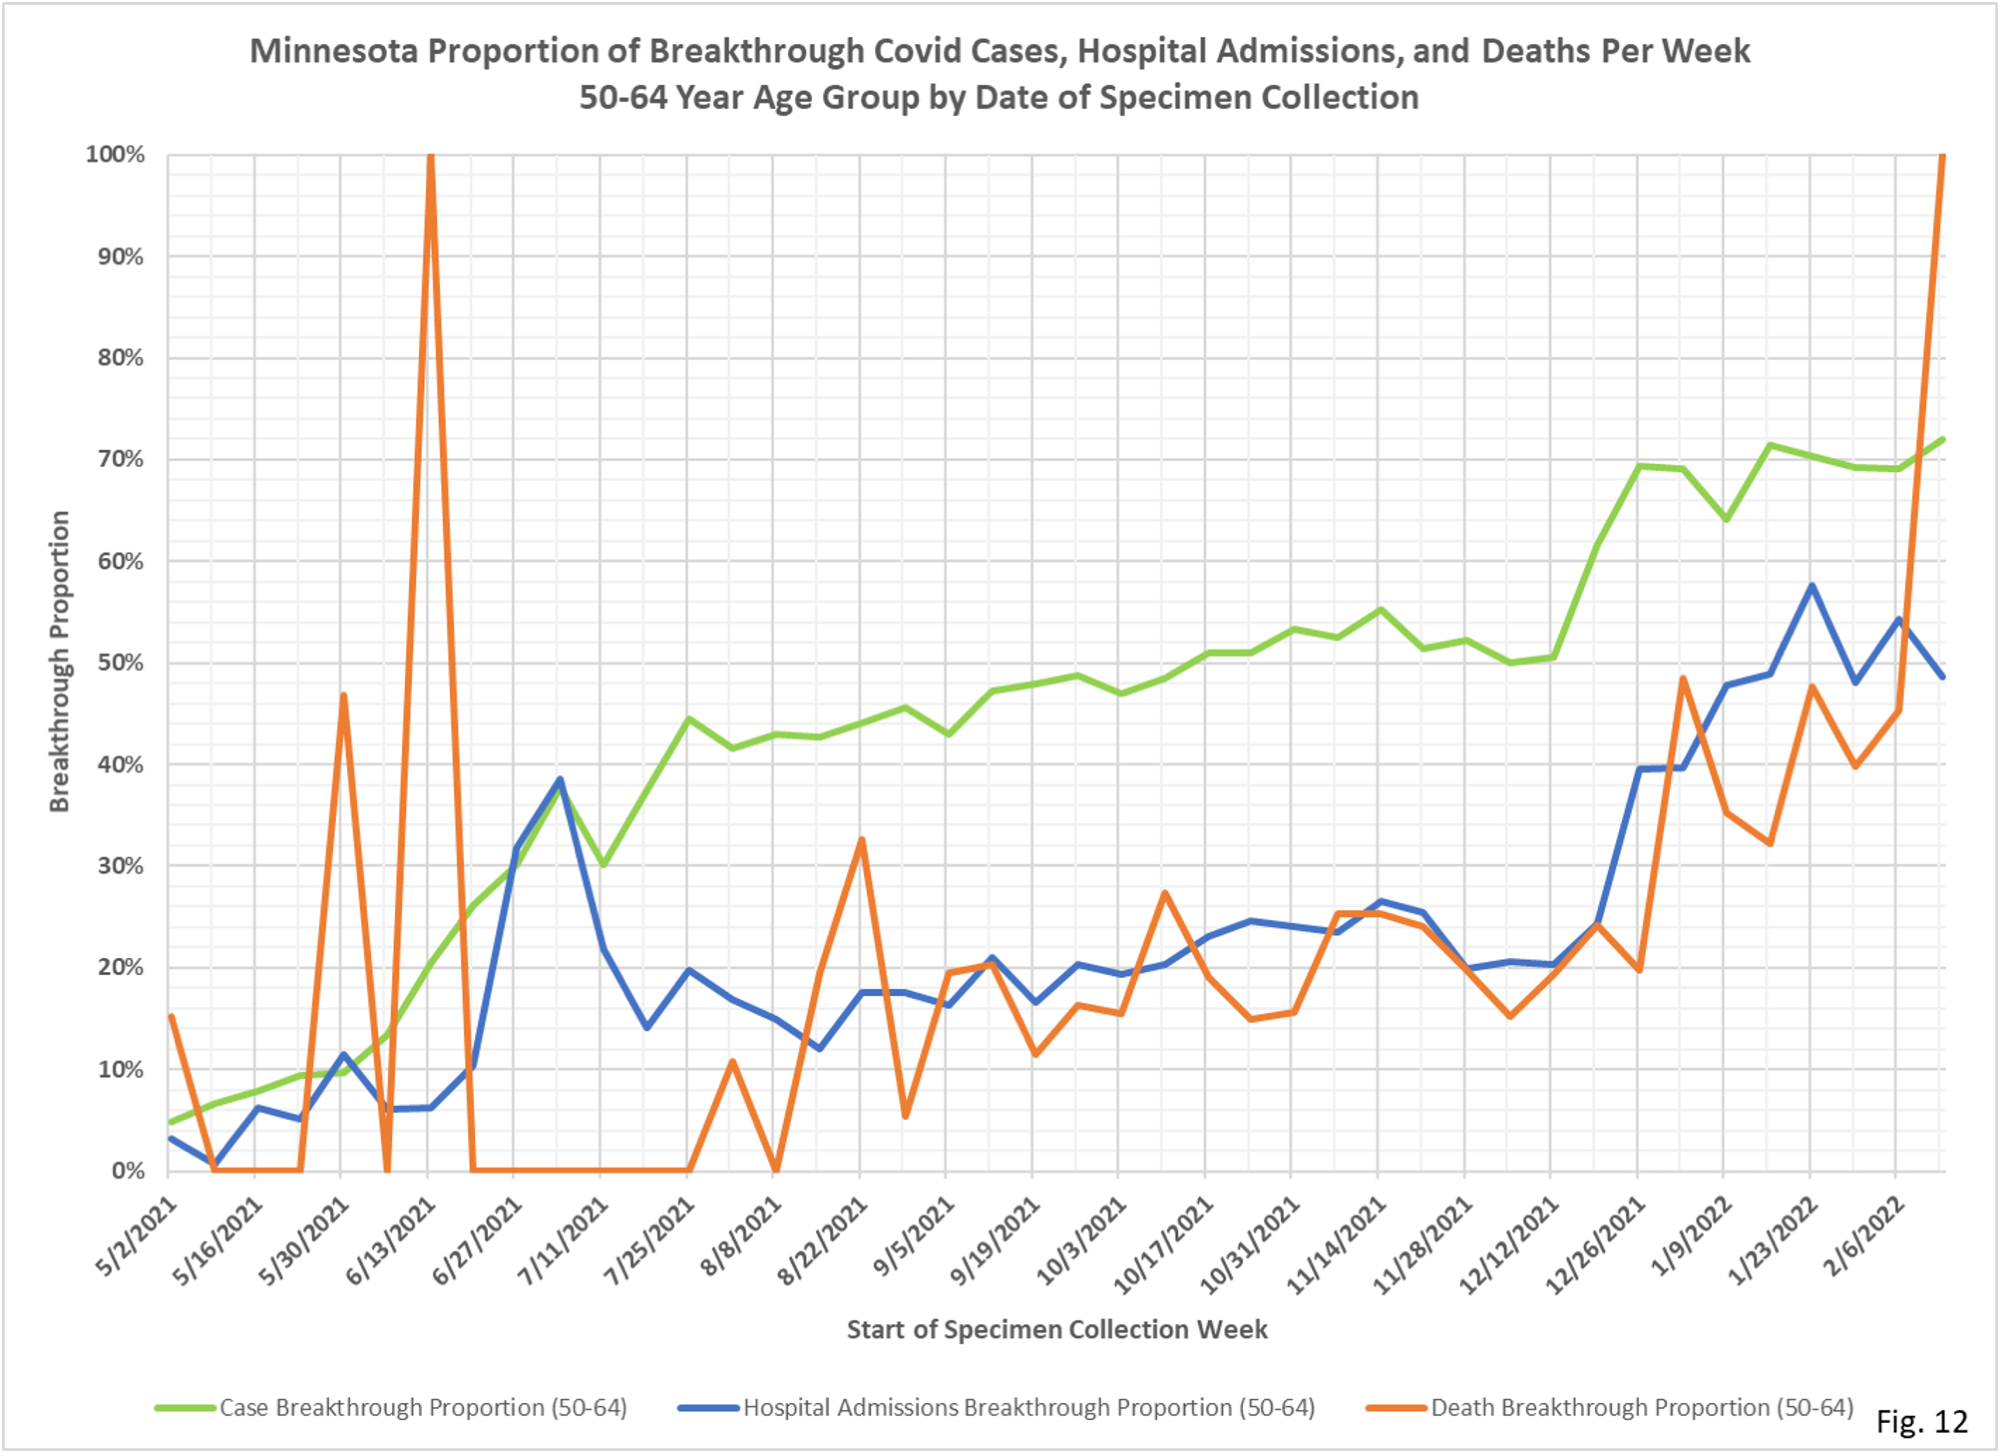
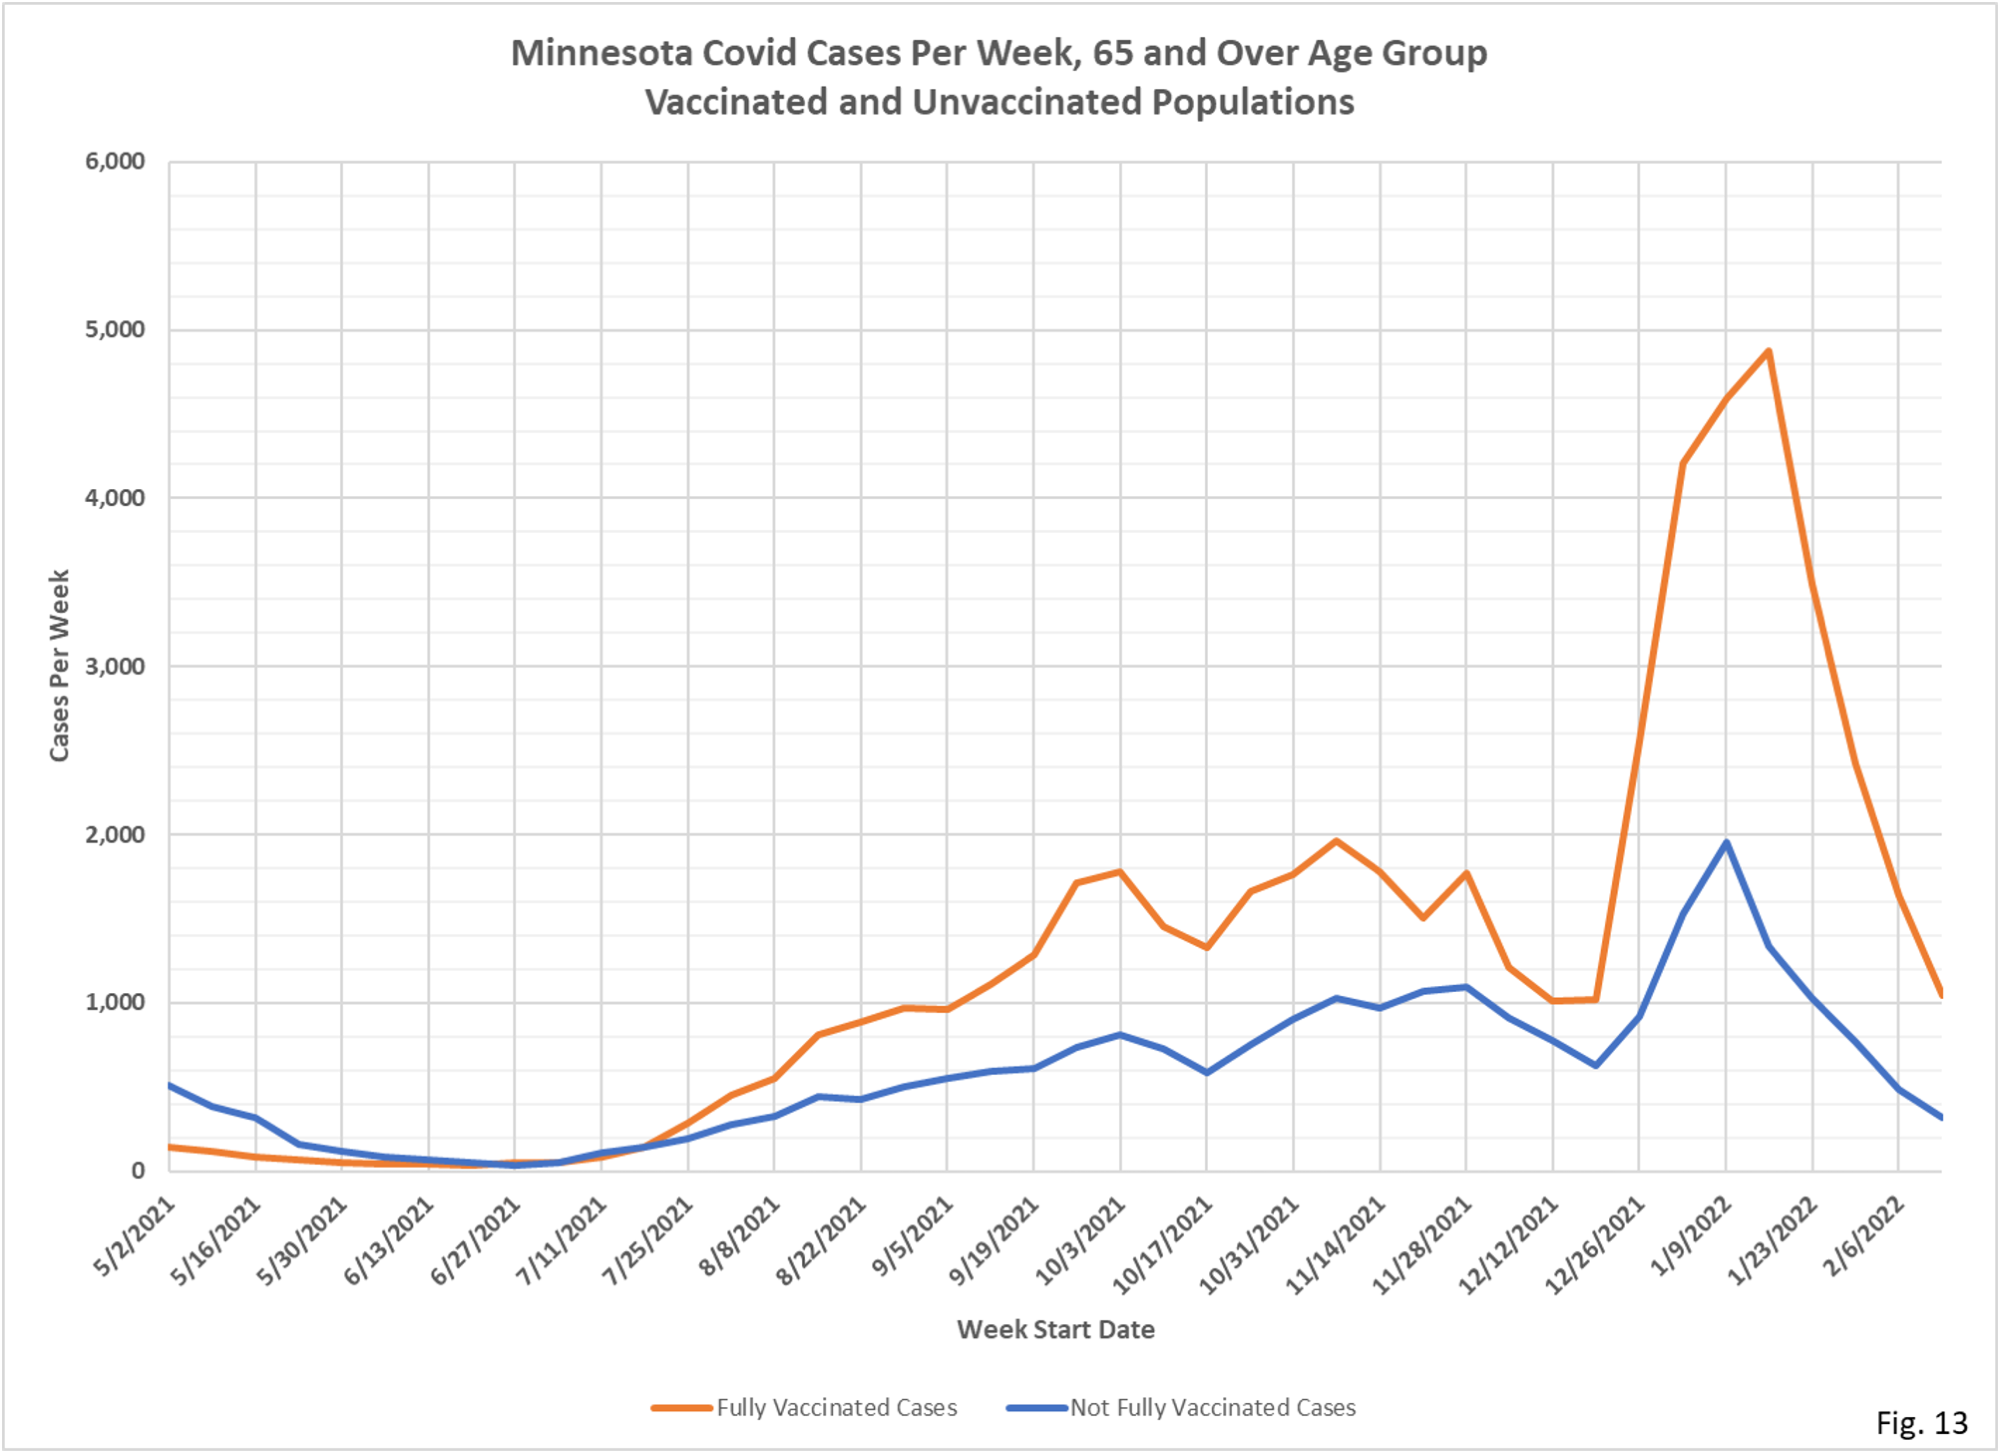
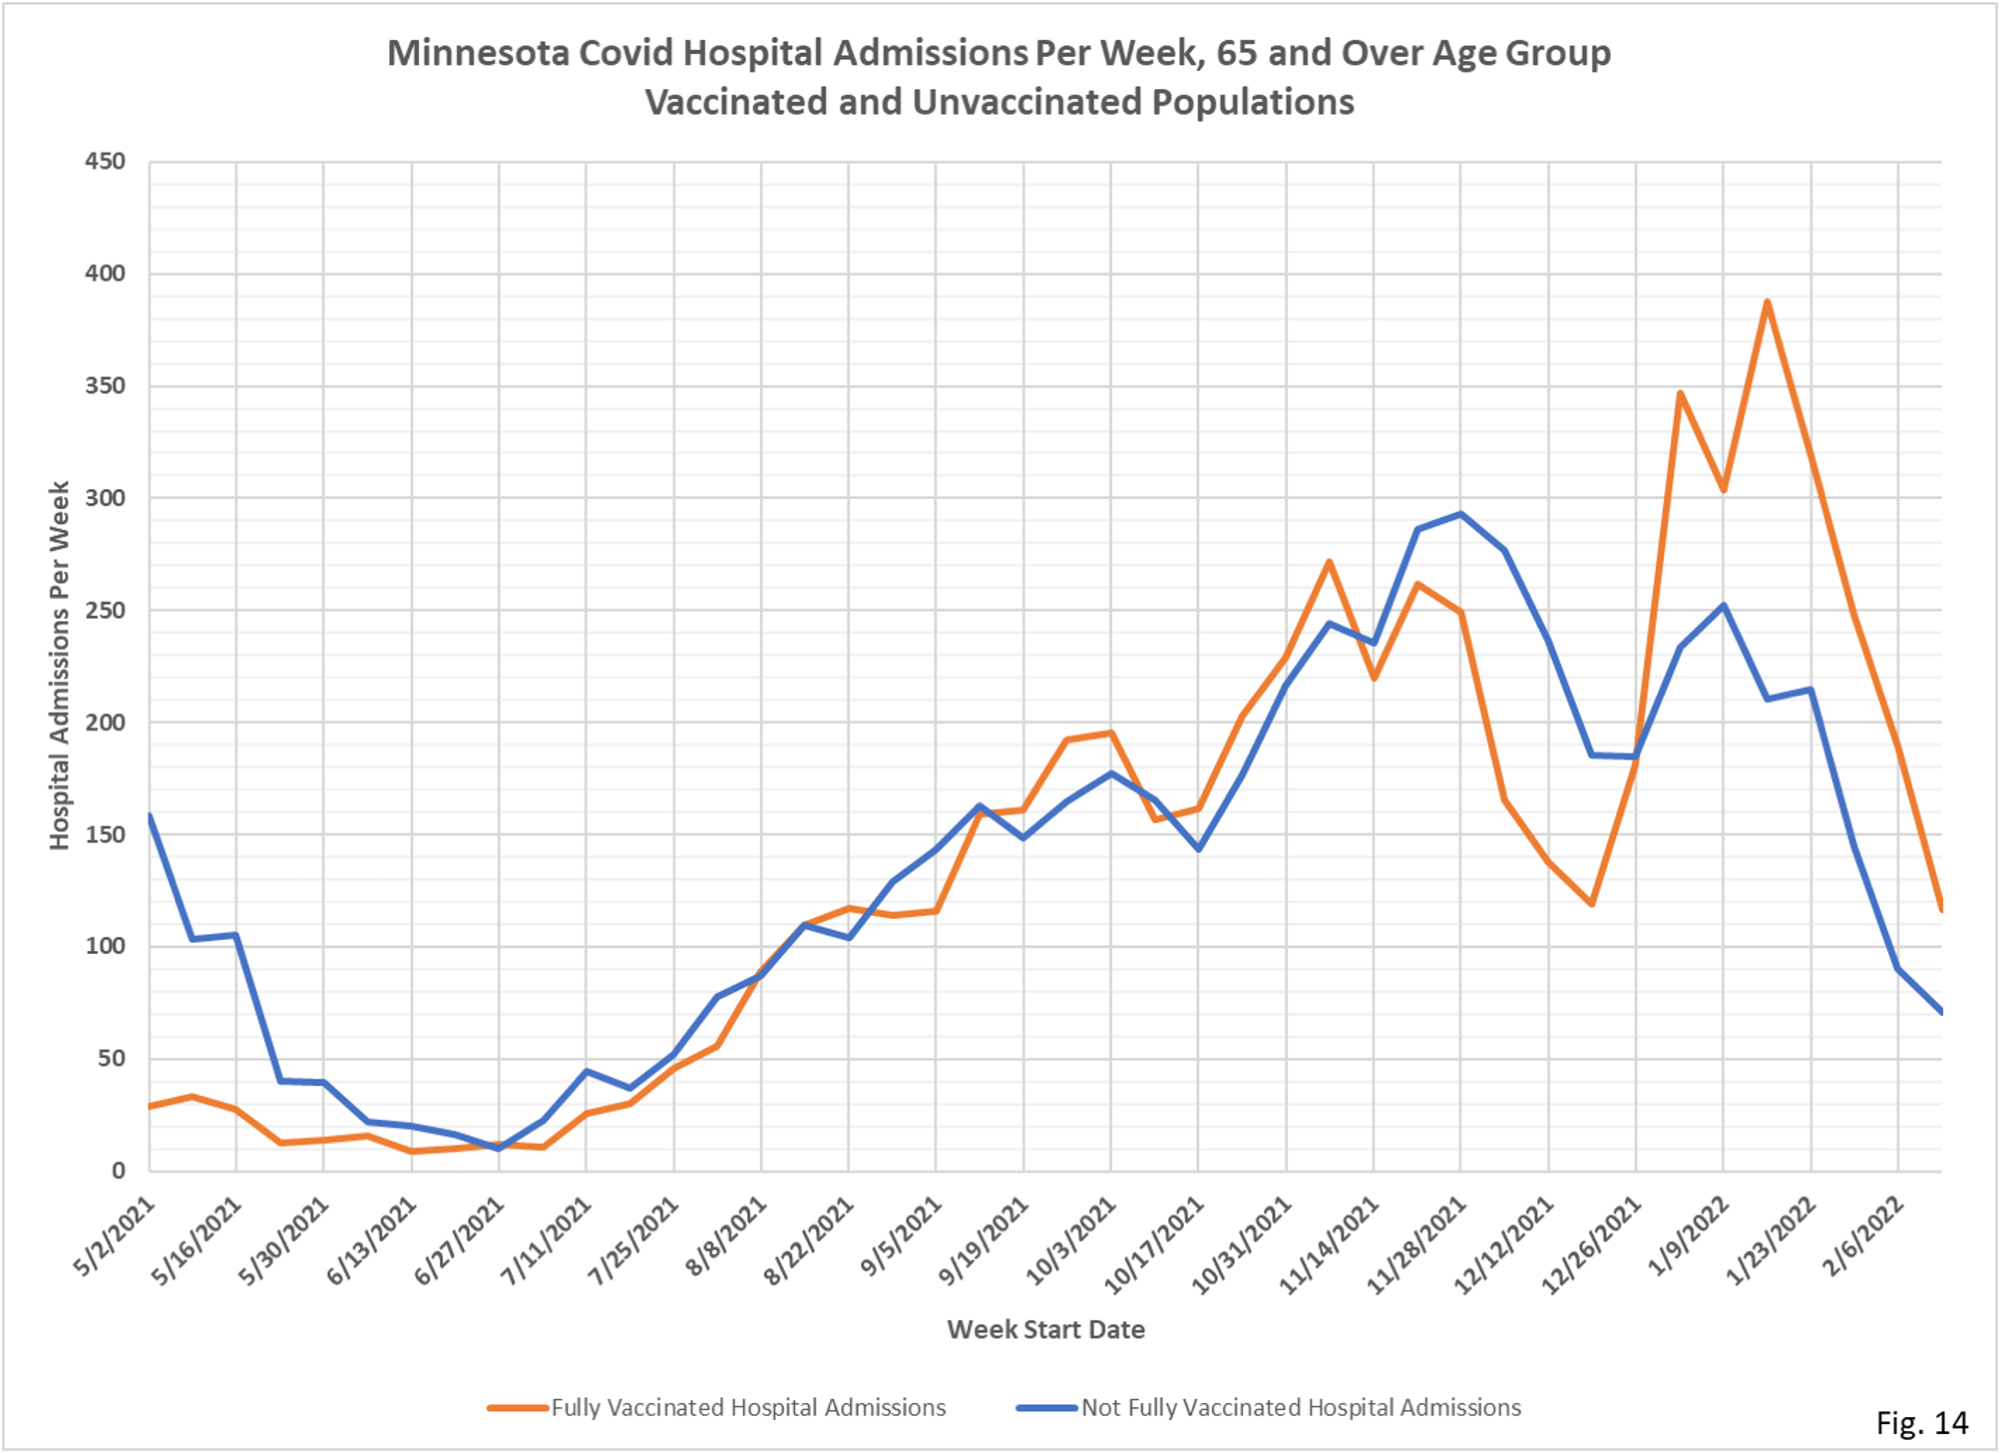
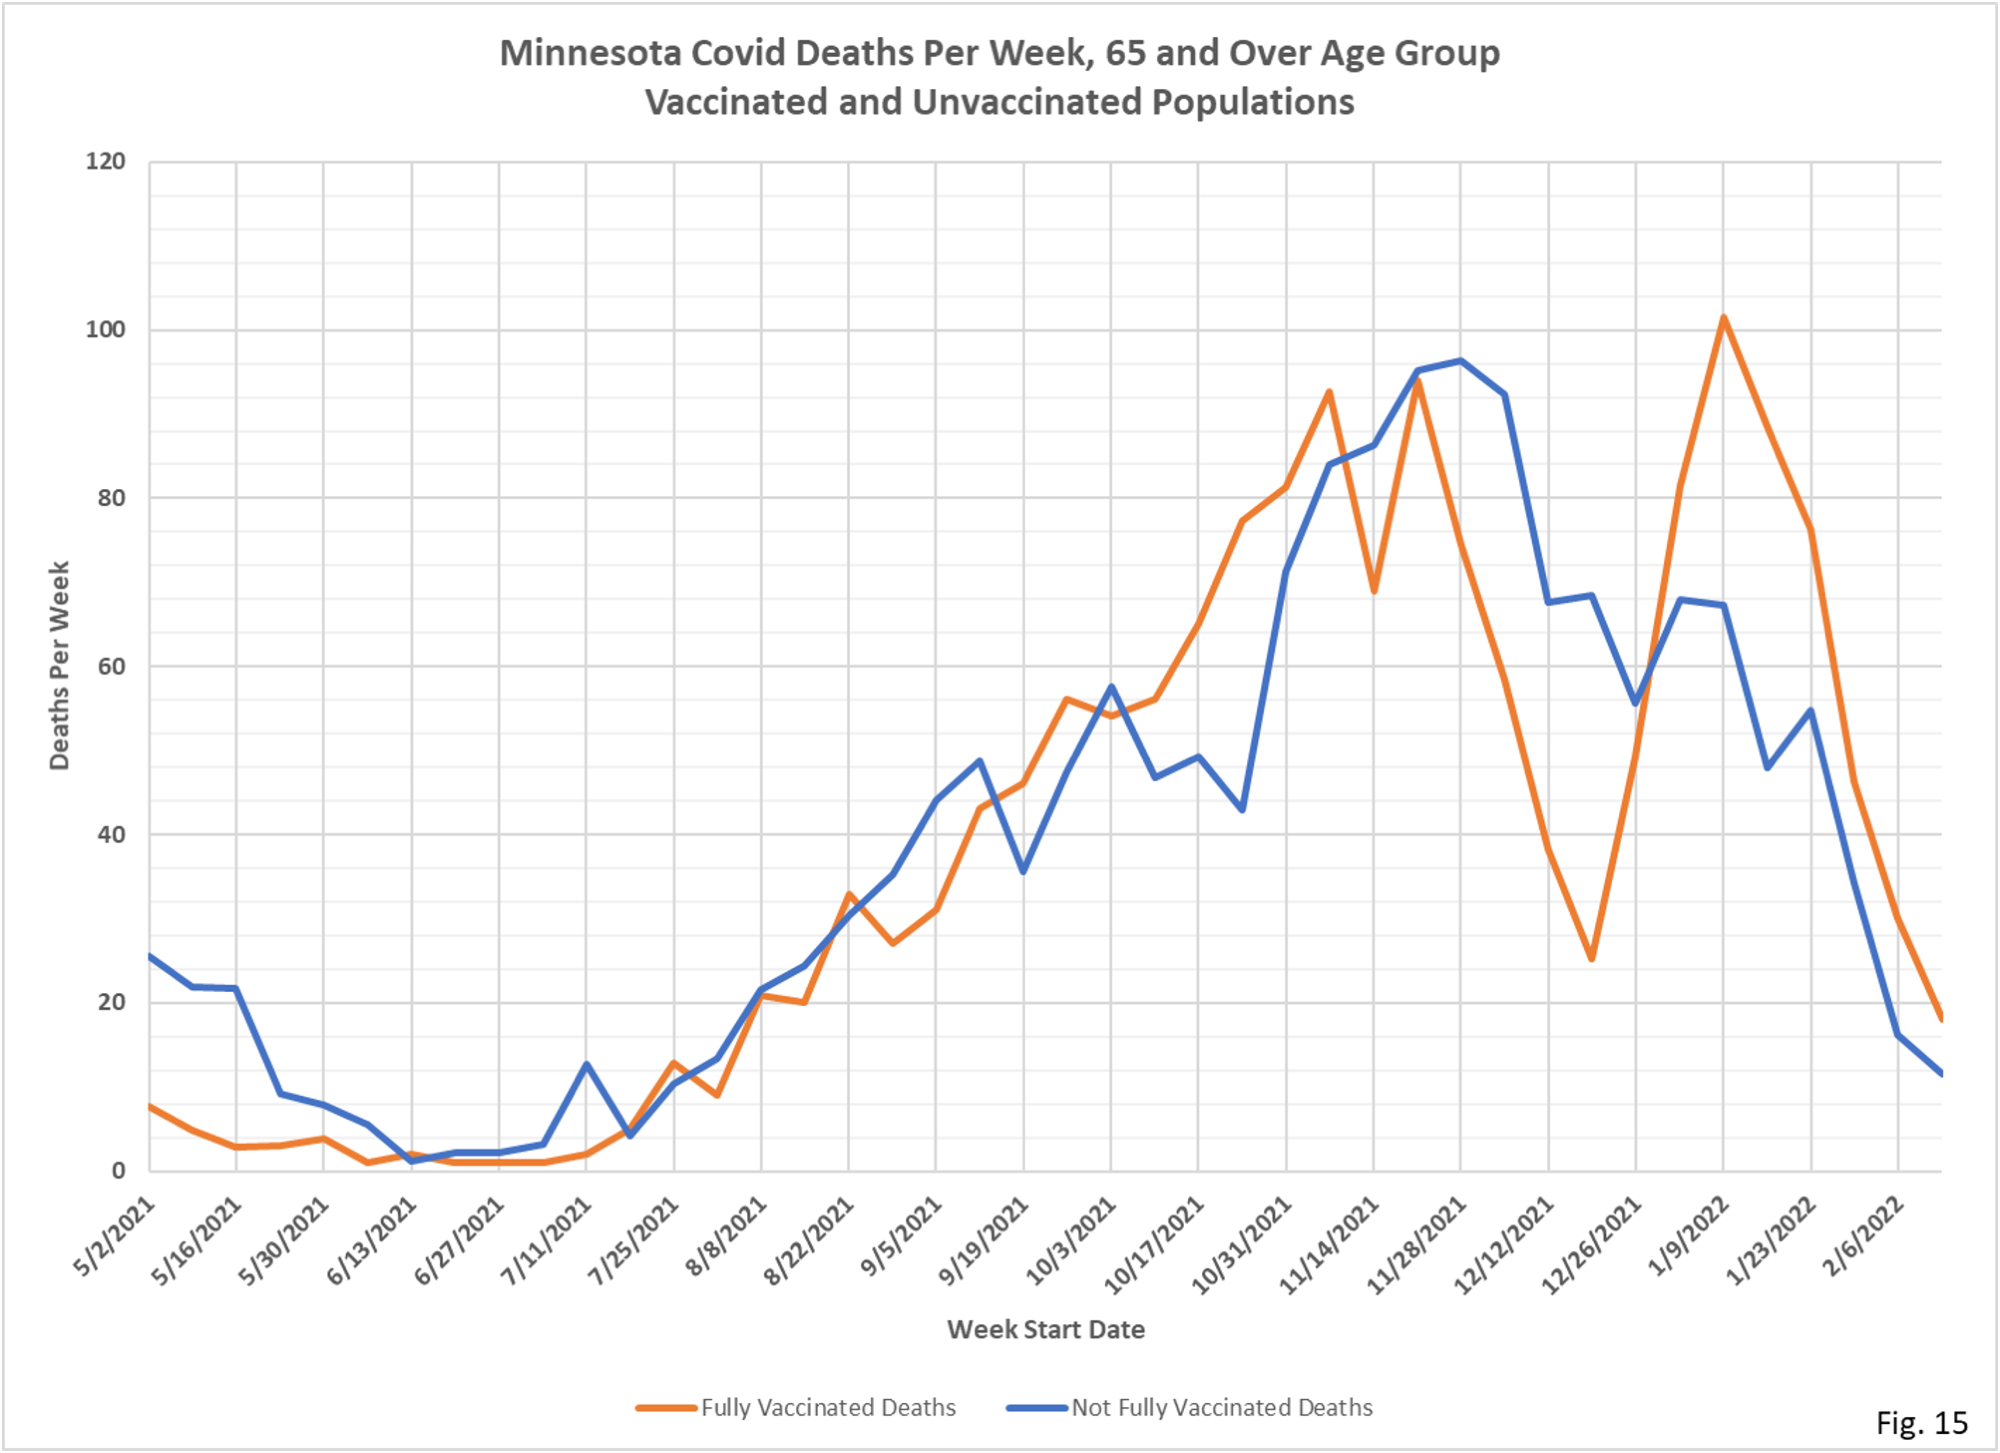
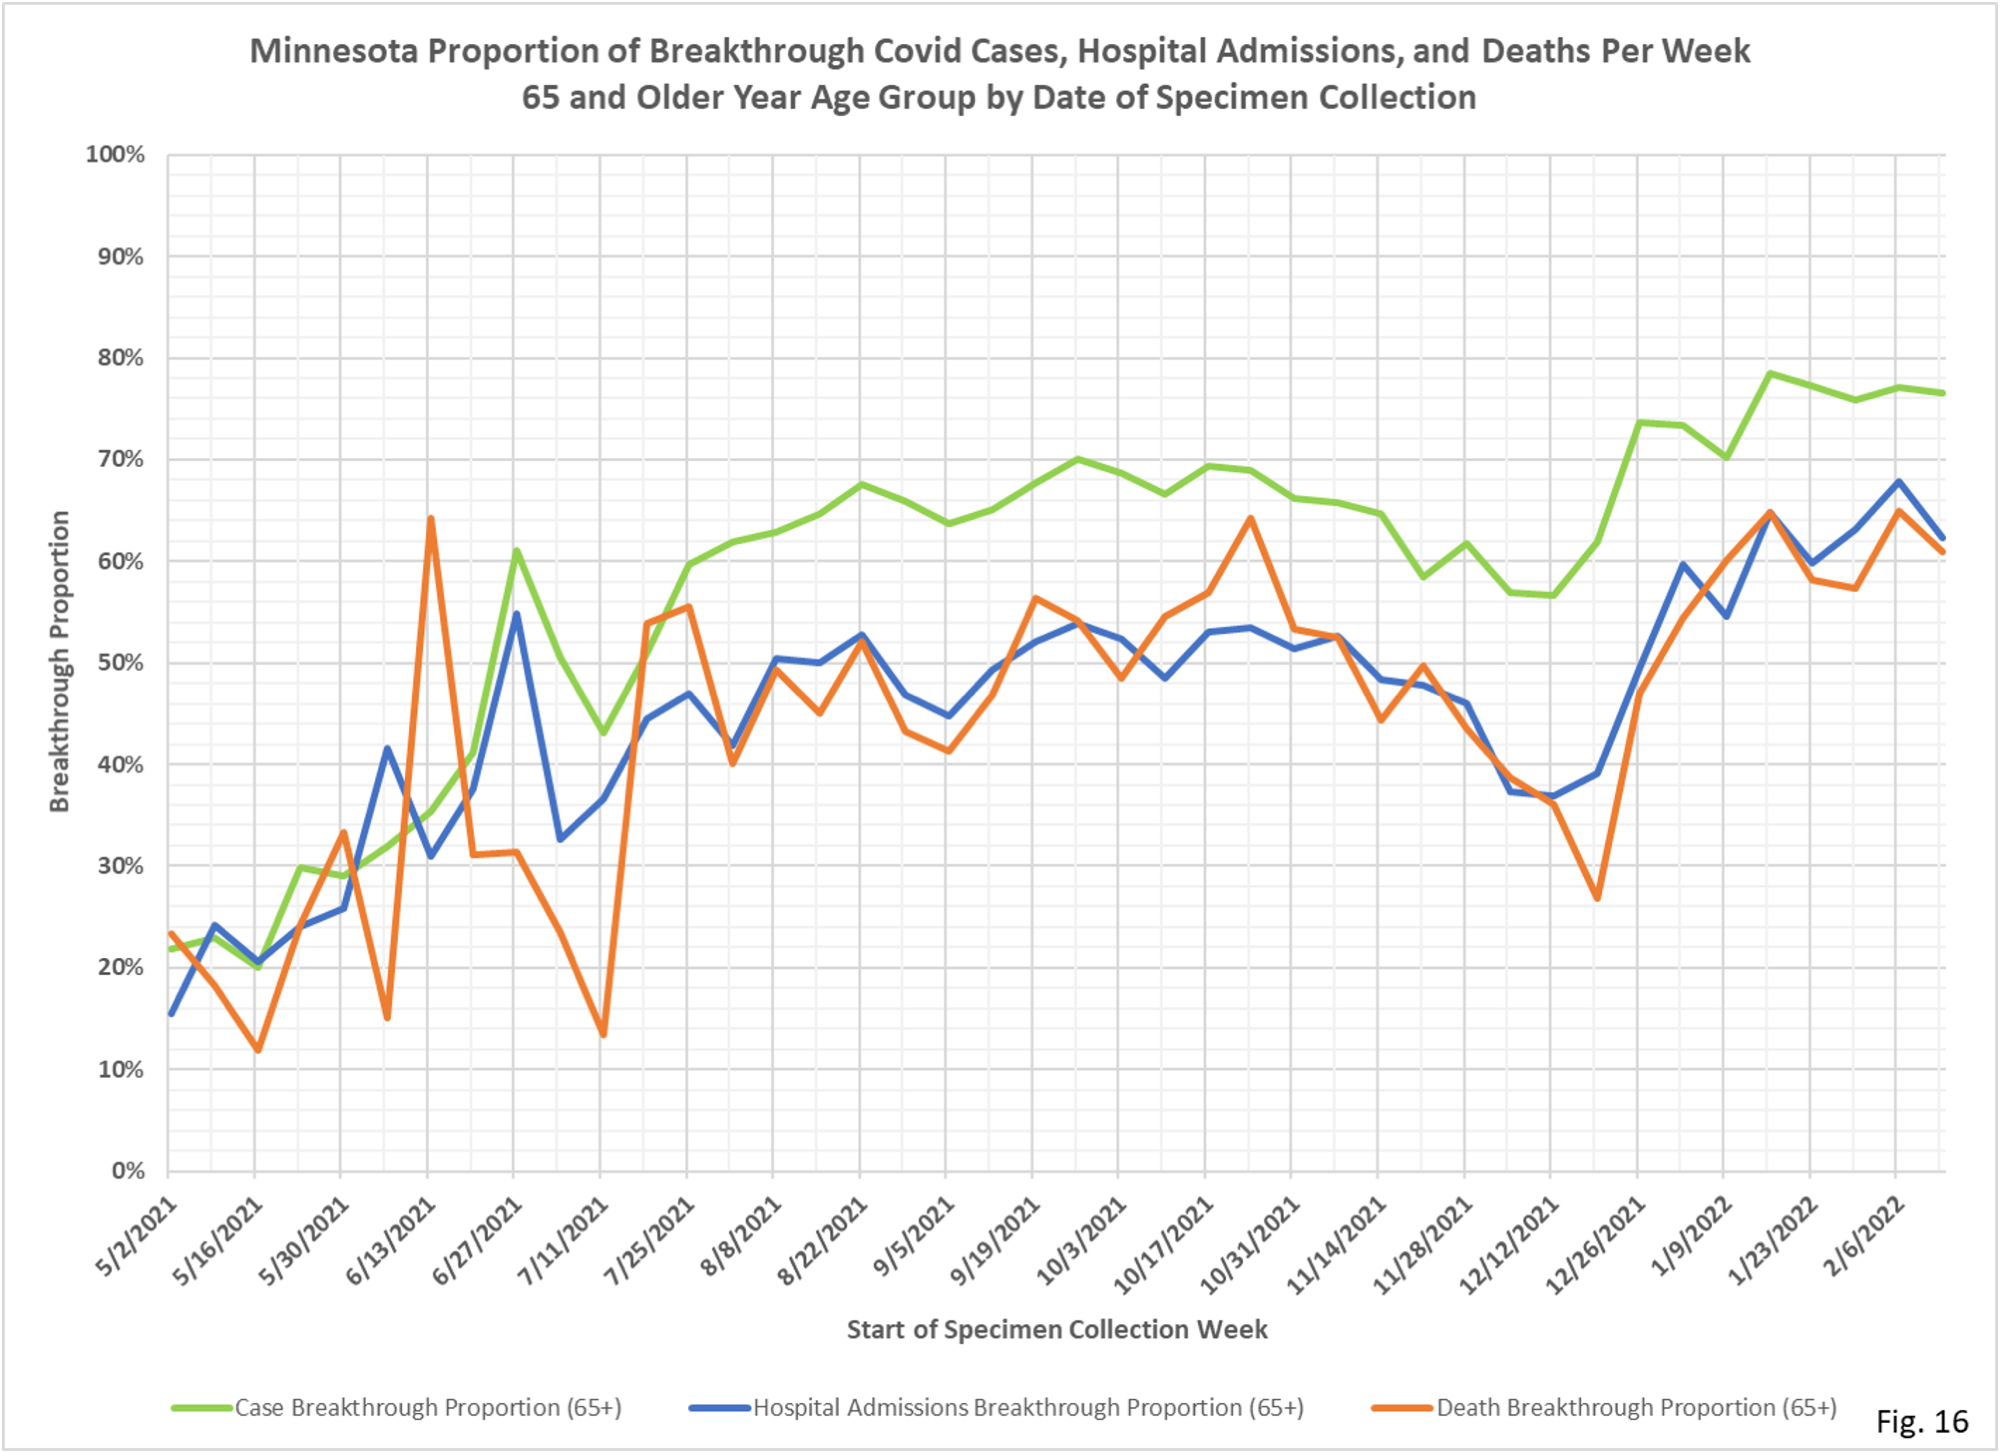
- In the charts that follow there are 4 slides for each age group; cases, hospital admissions, and deaths for the vaccinated and unvaccinated populations each week, and a single chart showing the breakthrough proportions each week.
- Fig. 1 thru 4, 12-17 Age Group: Vaccinated cases exceed unvaccinated since 12/19/2021, but vaccinated admissions exceed unvaccinated only starting 1/23/2022. The breakthrough proportion in Fig. 4 exceeds 50% starting on these dates.
- Fig. 5 thru 8, 18-49 Age Group: The case curves look quite similar to the 12-17 case curves, but vaccinated admissions are proportionally lower. Vaccinated deaths are proportionally lower than vaccinated admissions or cases.
- Fig. 9 thru 12, 50-64 Age Group: Vaccinated cases exceed unvaccinated by a large margin throughout the Omicron surge stating in late 2021. Vaccinated admissions and deaths roughly equal unvaccinated admissions and deaths only starting on the tail end of Omicron in mid-January 2022.
- Fig. 13 thru 16, 65 and Over Age Group: Vaccinated cases exceed unvaccinated cases since July 2021, partly because the vaccinated population is much larger, and waning vaccine immunity probably contributes as well. There is quite a dramatic lull in admissions and deaths in late 2021 just before the start of Omicron.
- The data source for all charts is the data file vbtcirates.xlsx, found on the Minnesota Department of Health (MDH) web page: https://www.health.state.mn.us/diseases/coronavirus/stats/vbtcirates.xlsx . This data file gives the rates per 100k of cases, hospitalizations, and deaths in full vaccinated and not fully vaccinated people, broken out by age group. The rates per 100k in vbtcirates.xlsx are converted into cases, hospitalizations, and deaths by multiplying by the appropriate population. The number of vaccinated people by age group can found on the Vaccine Data page, https://mn.gov/covid19/vaccine/data/index.jsp , in the data file People Vaccinated by Age. The unvaccinated population is found by taking the US Census American Community Survey 5-Year Estimate (Data Table S0101, https://data.census.gov/cedsci/table) and subtracting the vaccinated population. The breakthrough proportion is then found by dividing the breakthrough events by the total of the breakthrough and non-breakthrough weekly events.
- MDH defines a breakthrough event as a Covid case, hospital admission, or death that occurs 14 or more days after completing the vaccination series (not including boosters).
