A little different look this week allowing for a look at the absolute number and percent change in cases and hospitalizations on the same chart.
 Dave’s notes:
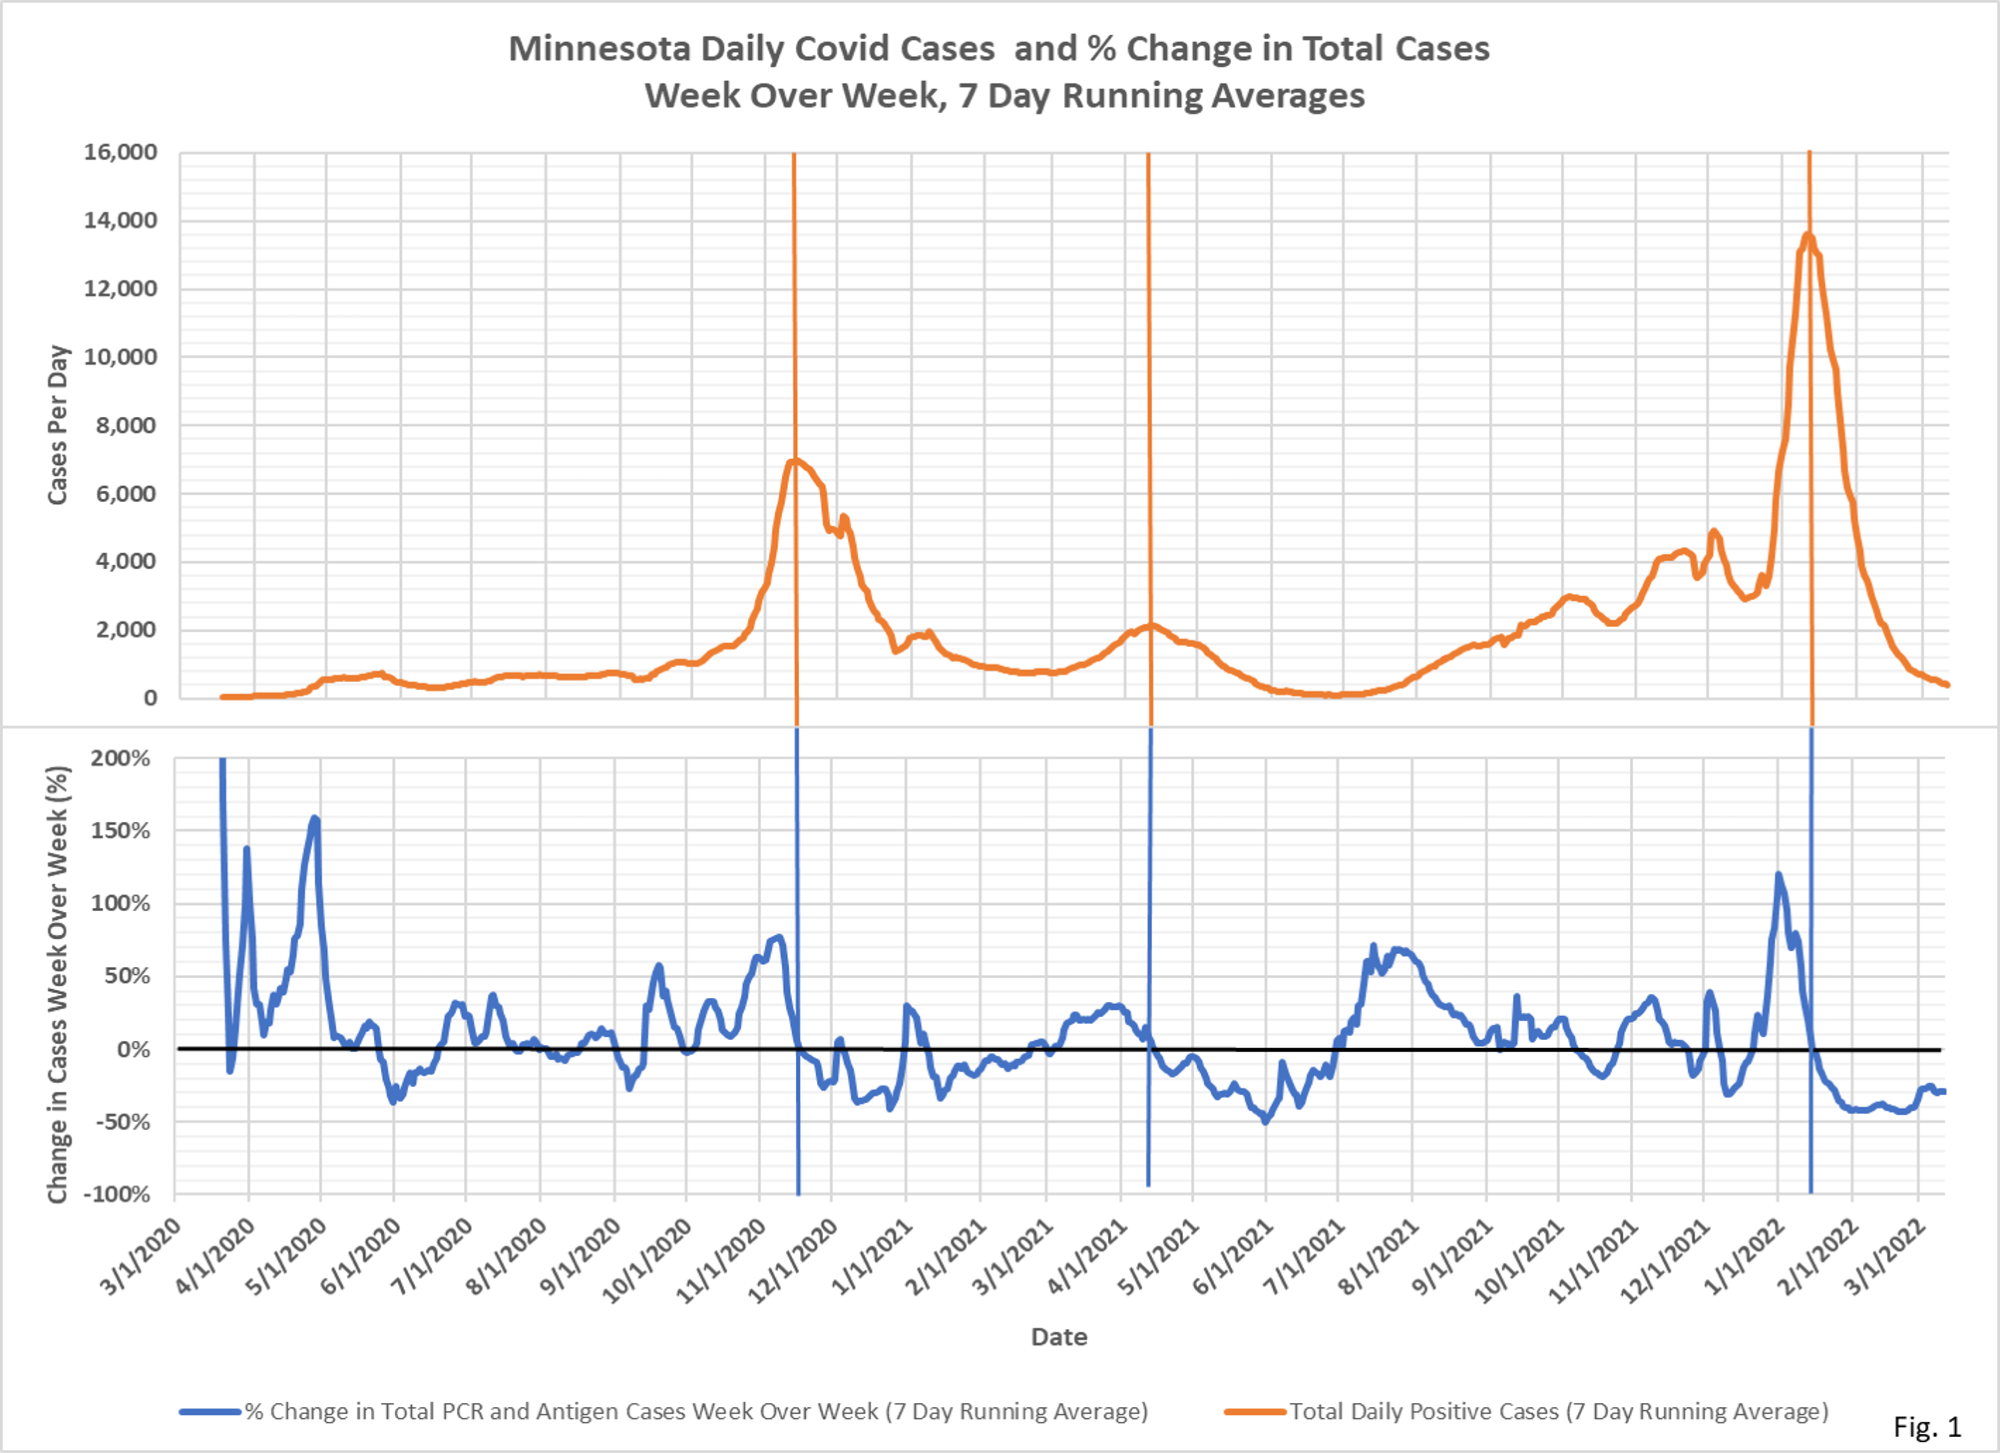
- These charts display the total daily new cases and daily hospital admissions (red curves) along with the percent change in the cases and admissions from 7 days earlier (blue curves).
- Daily case data is downloaded from the Minnesota Department of Health (MDH) Situation Update for COVID-19 web page https://www.health.state.mn.us/diseases/coronavirus/situation.html. The daily PCR and antigen case data is added together and then a 7 day running average is computed. The last 7 days of data is excluded from the chart to avoid plotting incomplete data. The percent change week over week is computed as the percent change in the 7 day running average from 7 days earlier.
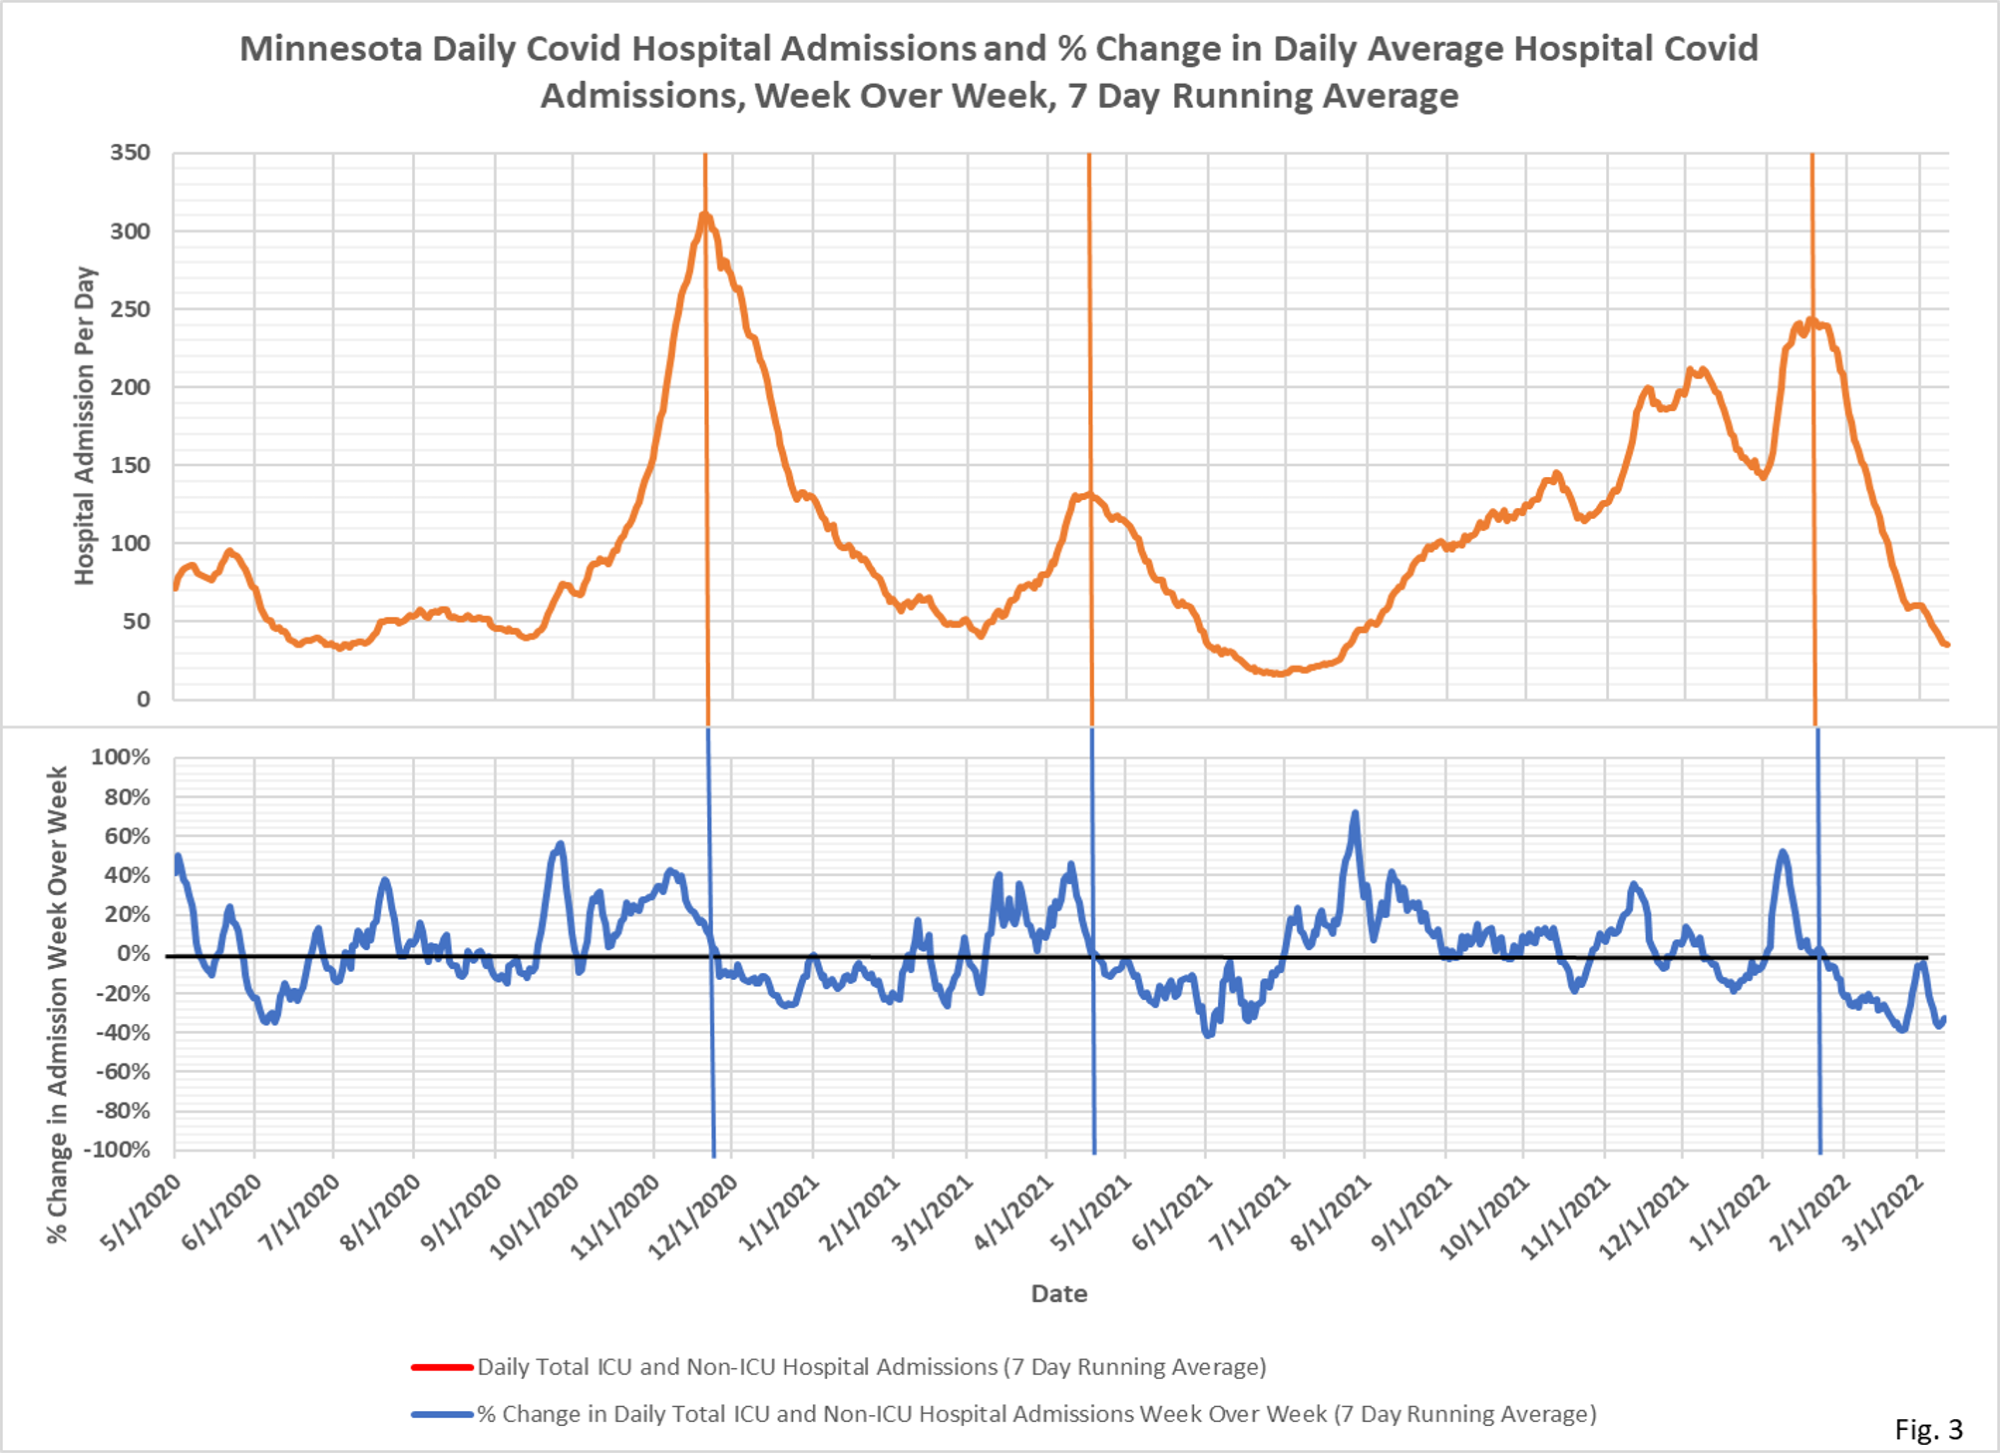
- Daily hospital admissions data is also downloaded from the Situation Update web page. The daily ICU and Non-ICU admission data is added together and then a 7 day running average is computed. The last 7 days of data is excluded from the chart to avoid plotting incomplete data. The percent change week over week is computed as the percent change in the 7 day running average from 7 days earlier.
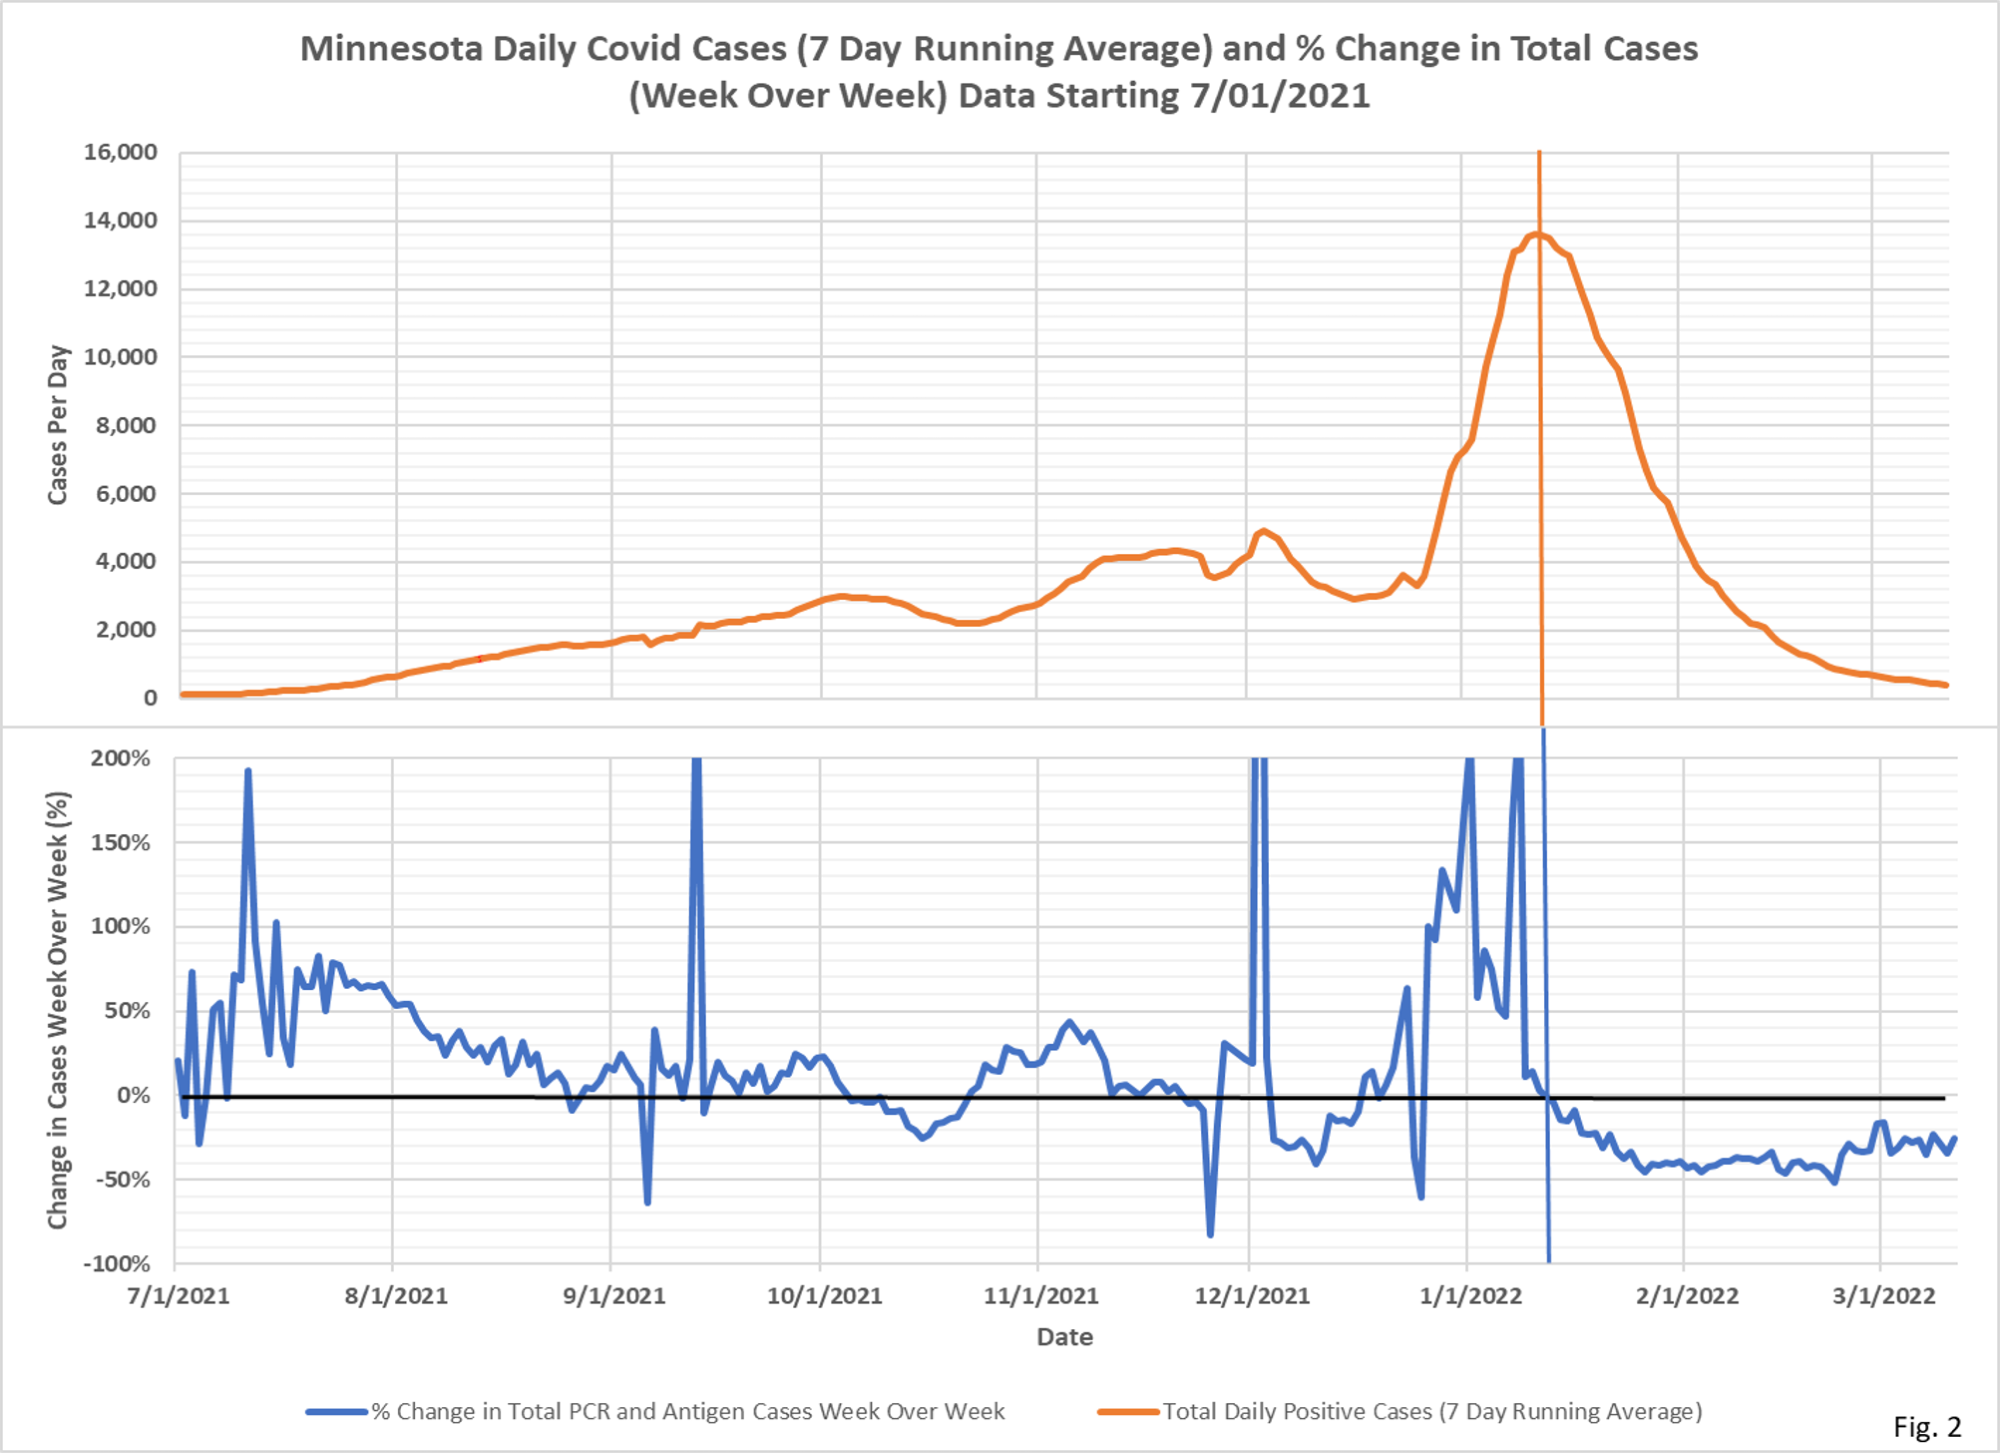
- Fig. 1 displays the 7 day running average cases and weekly % change over the entire pandemic, and Fig. 2 displays data since 7/1/2021. The vertical lines mark the peak cases. Note that the peak cases correspond with the change in cases week over week turning negative. Of note the peak in % change in cases week over week is earlier than the peak in cases, as the rate of change in cases reduces toward zero as the peak is reached.
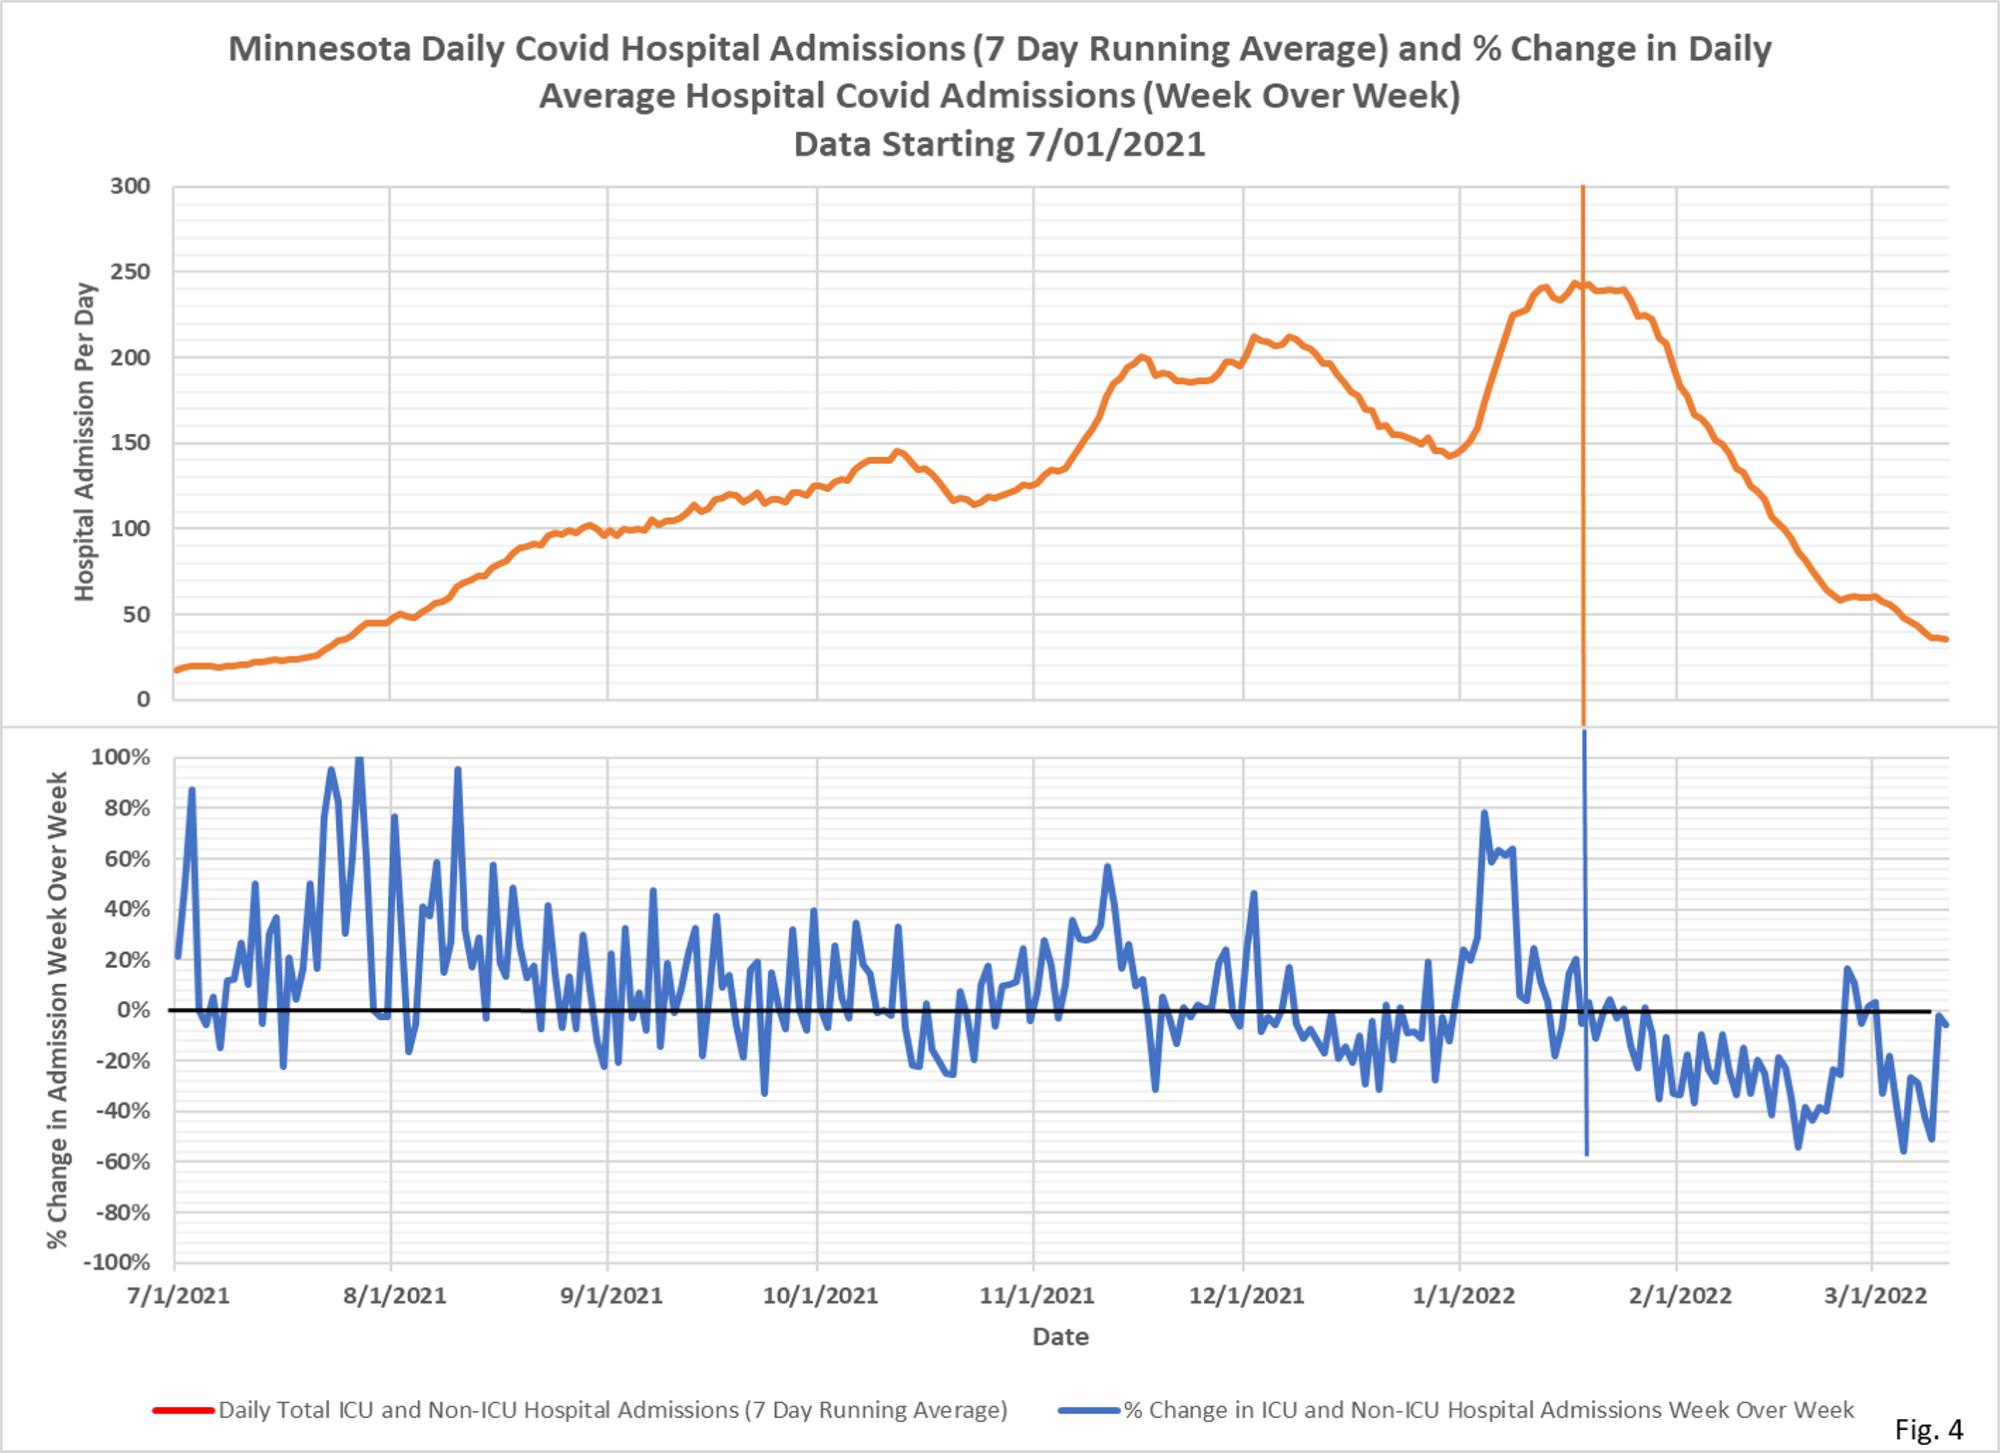
- Fig. 3 displays the 7 days running average daily Covid hospital admissions and percent change over the entire pandemic, and Fig. 4 displays data since 7/1/2021. As with cases, the vertical lines mark the peak in admissions, which occur where the % change in admissions week over week turns negative. Also as with cases, the % change week over week peaks earlier than the peak in admissions.
- There are multiple issues that need to be considered when thinking about the relationships between cases and hospital admissions: 1). Positive cases are heavily dependent on testing rates, with high testing rates potentially generating lots of false or asymptomatic cases. 2). A large fraction of hospital admissions are for non-Covid afflictions, with an incidental positive test then causing the patient to be classified as Covid. MDH has not released data on incidental positive admissions despite a Data Practice Act request.
