You may recall that Dave put together tables from the data sheets he got from DOH, comparing case rates of hospitalizations and deaths in the vaccinated and unvaxed populations. Recall that there are likely issues here with lagged identification of events in vaxed persons, failure to identify all the vaxed persons, whether or not the rate of undetected infections is the same in the vaxed and unvaxed populations and the effect of prior infection in each sub-group. I think the net effect of these issues would likely be to make the vaxed rate look a little higher and the unvaxed a little lower, although there would still be a substantial gap.
Over time, these rates have changed, but far more among the vaxed than the unvaxed, probably because to the extent Omicron was milder, that seems to largely be picked up in the seriousness of cases among the vaxed. It may also reflect that during Omicron, many vaxed people did not get tested or tested at home and don’t show up in the figures. But this latest chart shows a 2.57% overall hospitalization rate among the vaxed versus 4.83% in the version a few weeks ago, while the unvaxed rate only dropped from 4.96% to 4.46%. The difference in case rates continues to be starkest among the younger age groups. The overall death rate for the vaxed went from .76% to .45% while barely moving for the unvaxed, .73% to .71%. Dave’s notes:
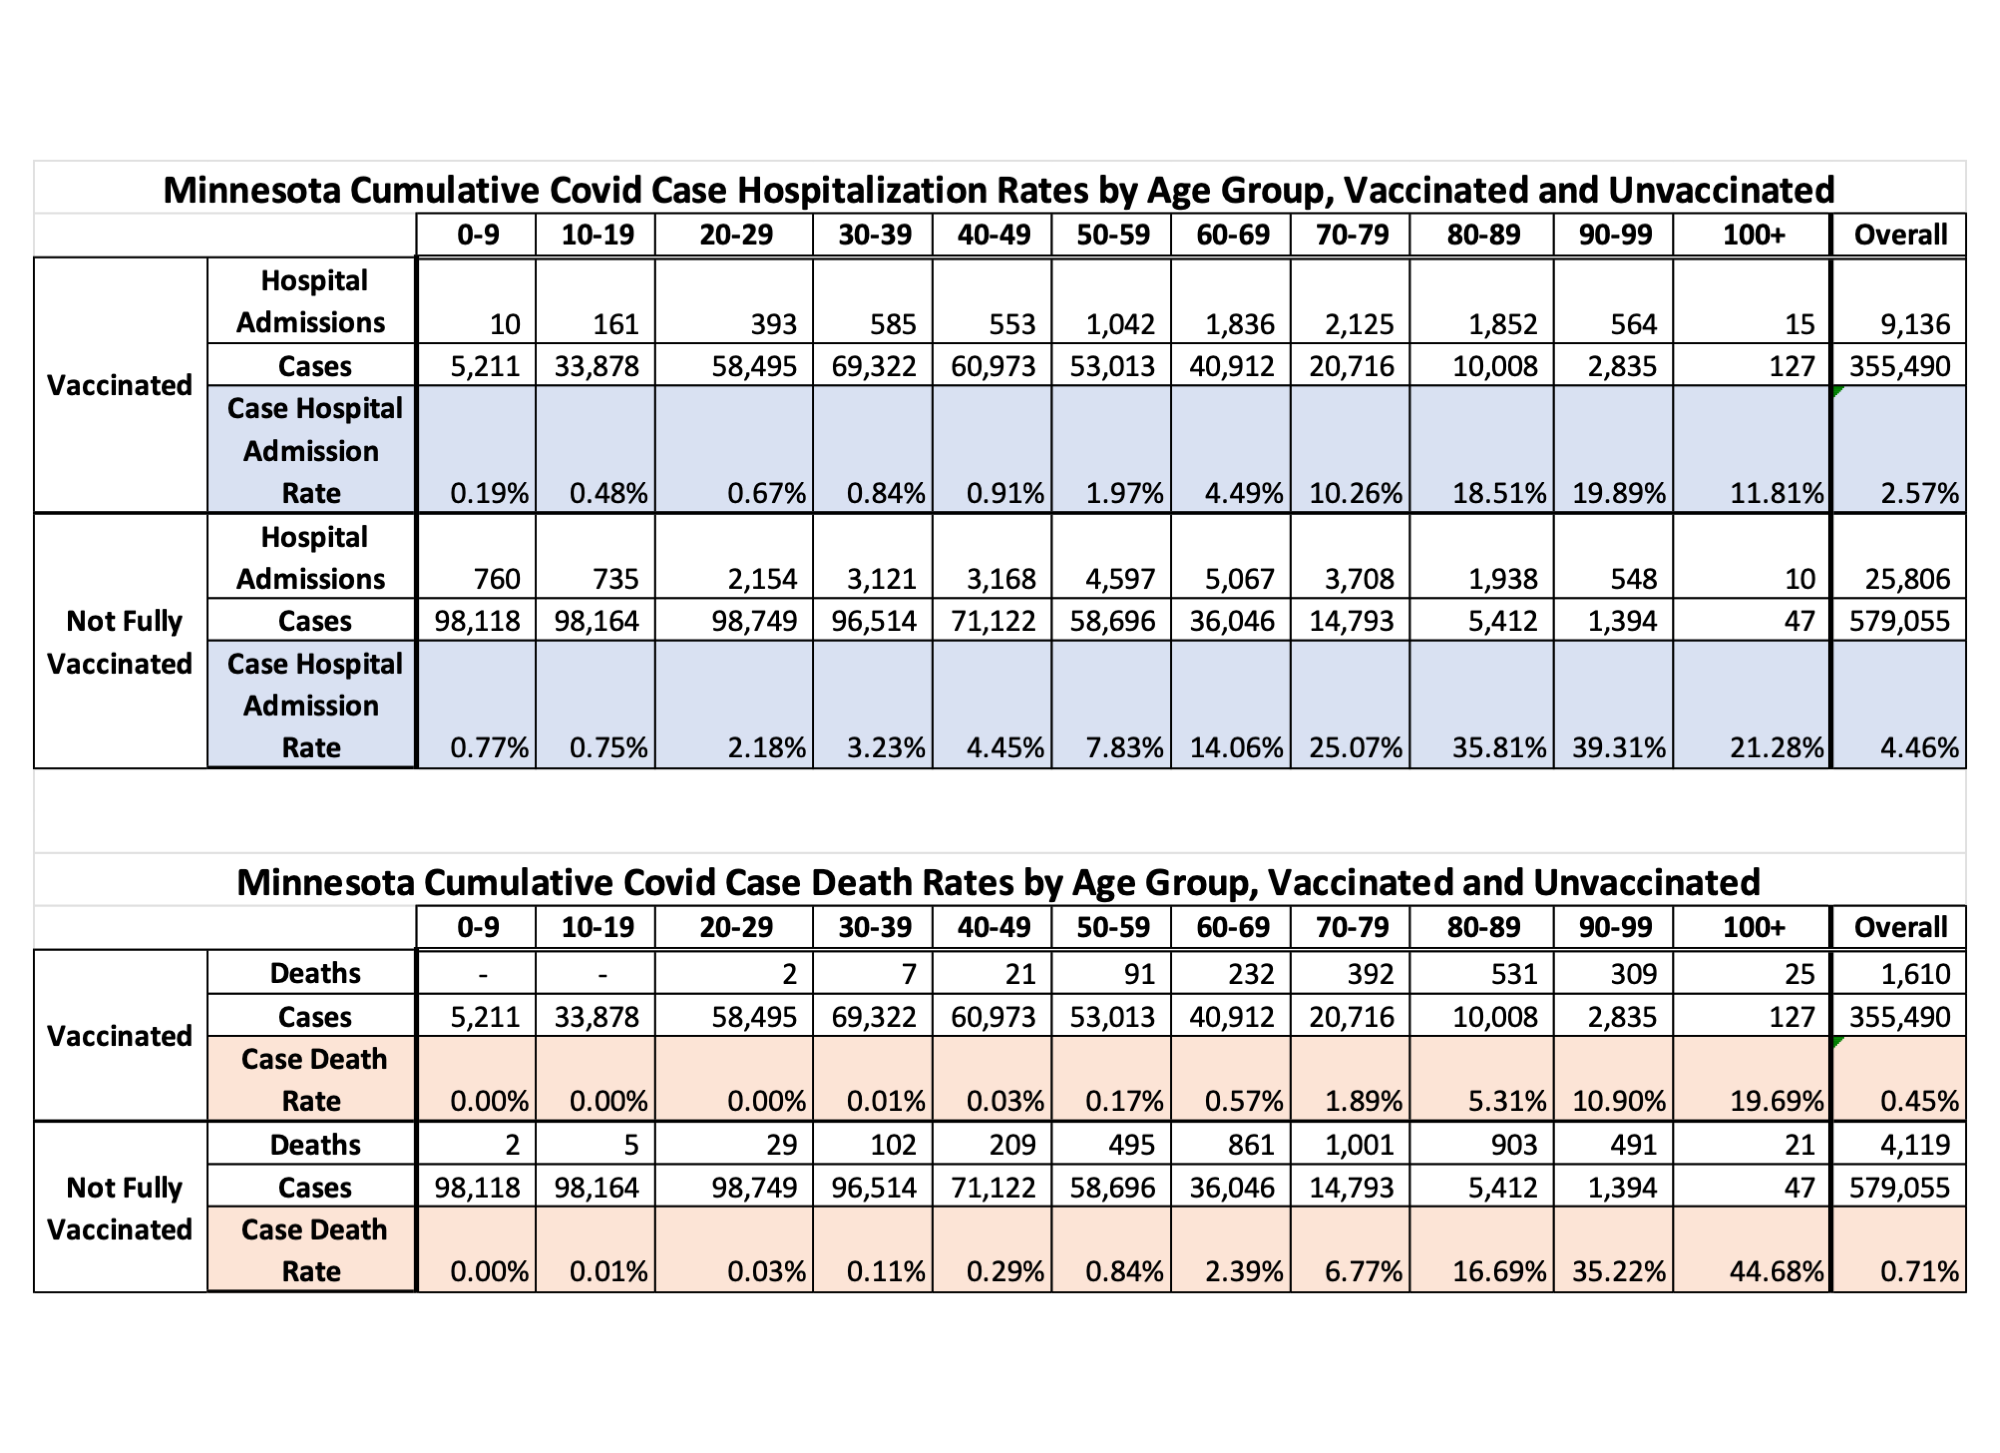
1. The table and charts below display the Covid hospitalization case rates and Covid death case rates for Minnesota sorted by 10-year age groups. These case rates are simply the percentage of those who test positive for Covid that go on to be admitted to a hospital or to die. These are cumulative rates over the course of the pandemic, over the time period for specimen collection dates of cases from 1/20/2021 to 2/06/2022. This date range was selected in order to cover the time period during which there were breakthrough events reported, and during which there is a reasonable likelihood that admissions or deaths would be reported, as described more fully below. Choosing different time periods for the analysis would generate different results of the analysis.
2. These tables and charts are an update of the data tables for this data last published on 1/24/2022 here: https://healthy-skeptic.com/2022/01/24/vaxed-and-unvaxed-case-rates-january-21/, on 12/09/2021 here: https://healthy-skeptic.com/2021/12/09/vax-unvaxed-case-rates-december-6/, and on 11/15/2021 here: https://healthy-skeptic.com/2021/11/15/breakthrough-case-rates/
3. On 10/28/2021 we had requested that the Minnesota Department of Health (MDH) provide us, under the Minnesota Data Practices Act (https://www.health.state.mn.us/data/datapractices/index.html), information regarding Minnesota’s breakthrough Covid cases (breakthrough cases being defined as someone who tests positive for Covid 14 or more days after completing their vaccination series). Specifically, for each breakthrough case, we asked that MDH provide us the date of specimen collection, the date of hospital admission, the date of death and the age of each individual. This Data Practices Act request (ID No. 21-211) was separate from a much more comprehensive request submitted some weeks ago, and we hoped that perhaps a simple, more focused request might be acted upon.
4. On 2/24/2022 MDH provided an updated version of the same data file originally provided on 11/10/2021, in response to a request for updated information. This new data file contains the specimen collection date, age, and yes/no flags for hospitalization and death for 360,863 breakthrough Covid cases, identical to the data provided in the original data file. As of 2/21/2022, MDH’s Vaccine Breakthrough Report web page https://www.health.state.mn.us/diseases/coronavirus/stats/vbt.html reports a total of 360,876 cumulative breakthrough cases, only 13 breakthrough cases more than contained in the provided data file. In the provided data file the last row of data is a hospitalization Yes/No flag without an age, date, or death Yes/No flag.
5. In the new breakthrough data provided by MDH, the earliest breakthrough case is 1/20/2021, and the most recent is 2/13/2022.
6. Other than the extending the analysis time period there are no major changes to the analysis, compared to the prior version of this table published on 1/24/2022.
7. Because MDH did not provide the dates of hospital admission and death, only yes/no flags, we do not know the exact timing when these events occurred. We have assumed that hospitalization occurs 3 days on average after the specimen collection date of a positive case, and that death occurs on average 14 days after specimen collection date of a positive case. Using assumed time lags rather than actual dates should have minimal impact on the accuracy of the analysis, since we are calculating cumulative totals over the entire time period being analyzed.
8. Since the data file provided contains breakthrough cases, hospital admissions, and deaths by age group over a time period, we then need to compare this data to the overall cases, hospitalizations, and deaths by age group over the same time period. The Minnesota Weekly Report (https://www.health.state.mn.us/diseases/coronavirus/stats/index.html) provides weekly totals for hospital admissions and deaths by age group. However, this data is based on the date of report, and not when the hospital admission or death actually occurred. For this reason, in order to match actual date of events, we assume that there is a 1 week lag between actual date of hospitalization and appearance in the Minnesota Weekly Report. In addition, we assume there is a 2 week lag between date of death and appearance in the Minnesota Weekly Report. These lags are consistent to the lags that found for data being published on the Minnesota Situation Update web page (https://www.health.state.mn.us/diseases/coronavirus/situation.html). Because the actual lag between actual hospital admission and death and publication in the Minnesota Weekly Report is unknown, the total hospital admissions and deaths, and therefore the unvaccinated hospital admissions and deaths, may be different than the totals appearing in the table below. Since the only age group data we have for hospital admissions and deaths is based on date of report we have no way around this source of error currently.
9. The Not Fully Vaccinated Hospital Admission Case Rate is calculated as the number of non-breakthrough hospital admissions divided by the number of non-breakthrough cases, resulting in the percentage of non-breakthrough cases that are hospitalized. Non-breakthrough hospital admissions are found by taking the total hospital admissions (computed by taking differences between successive cumulative totals from the Minnesota Weekly Report https://www.health.state.mn.us/diseases/coronavirus/stats/index.html ) minus the breakthrough hospital admissions computed for the time period. We have determined in other analysis that there is an average lag of 1 week between hospitalization and reporting in the MDH data files and reports. Non-breakthrough cases are found by computing the total cases by age group from the data file wagscd.csv published on https://www.health.state.mn.us/diseases/coronavirus/stats/index.html#wagscd1 and subtracting the breakthrough cases described above.
10. The death case rates are found by a similar process to that used to find the hospital case rates, but using a 2 week assumed lag from date of death to reporting in the Minnesota Weekly Report.
11. Potential sources of error:
It is likely that there are people who may have contracted a mild enough Covid infection that they did not seek medical attention or get tested, causing an undercount of the true number of breakthrough infections as well as an undercount of non-breakthrough infections.
We know that there are likely to be many breakthrough cases that have not been identified by MDH, because the vaccination occurred out of state, by the Veterans Administration, or by a Native American medical facility. In response to a query to MDH on 9/23/2021 we were informed that MDH has access to vaccination records of Minnesotans vaccinated in Iowa, Wisconsin, and North Dakota if they gave the provided a Minnesota address. MDH does not have access to vaccination records in any other state. MDH does not have access to Veterans Administration vaccination records, and only partial or limited access to Tribal health organizations vaccination records. However, MDH states that they attempt to verify vaccination status during contact tracing interviews. We do not know what percentage of positive cases are actually interviewed, and what percentage provide vaccination information.
We are unsure how complete the data matching process is for MDH even for the vaccination records in their possession. We suspect, for example, that on 11/08/2021 that MDH reported additional breakthrough cases as early as 5/02/2021, by examination of the breakthrough case, hospital admission, and death rates associated with the charts and tables on the Vaccine Breakthrough Report web page https://www.health.state.mn.us/diseases/coronavirus/situation.html#vbt2 . It is reasonable to assume that in the future additional older breakthrough cases will be identified and published. The time period used for the analysis may not have complete breakthrough case reporting.
12. MDH only started to publish data on the ages of those given booster shots on 3/11/2022. MDH does not publish information on the numbers and ages of booster shots recipients prior to 3/11/2022.
13. By comparing the Vaccinated and Not Fully Vaccinated Case Rates for each age group we can judge the relative risk between vaccinated and unvaccinated people in each age group, and the relative risks between age groups.
14. We can see, not surprisingly, that the older age groups are at greater risk of hospitalization and death, whether vaccinated or not, and the non-vaccinated are at higher risk of hospitalization and death than the vaccinated, once testing positive for Covid.
15. The overall hospital admission case rate for the vaccinated is 2.57% and for the not fully vaccinated is 4.46%. This means that in general the vaccinated are less likely to be admitted to a hospital than the unvaccinated. The ratio of the rates, 2.57%/4.46% = .576, means that the vaccinated are 57.6% as likely to be admitted to a hospital, when averaging over the entire population over the entire time period analyzed. However, when looking at individual age groups, we can see a greater effect of vaccination.
16. For case hospital admission rates, the ratio of unvaccinated to unvaccinated admissions was greatest for the 40-49 age group. For this age group the unvaccinated were 4.9 times more likely to be hospitalized than the unvaccinated, upon testing positive. The smallest benefit seen for vaccination overall was seen in the 10-19 age group, where the unvaccinated were only 1.58 times more likely to be hospitalized than the vaccinated. Note that these populations may have other characteristics that contribute to the apparent benefit of vaccination, such as health status, lifestyle, etc. Also, if a breakthrough case is unidentified by MDH then that case is counted incorrectly in the unvaccinated category, inflating the apparent risk to the unvaccinated.
17. The death case rates are the percent of positive cases who go on to die. We can see that the unvaccinated have much higher case rates than the vaccinated for all of the age groups that are 20 years old and older. Overall, 0.45% of the positive cases who were vaccinated go on to die, while 0.71% of the unvaccinated cases die.
18. For case death rates the 30-39 age group shows the most benefit from vaccination. For this age group the unvaccinated were 10.5 times more likely to die than the vaccinated. Conversely, the 100+ unvaccinated were only 2.3 times more likely to die than the vaccinated. As we noted for hospital admissions, other population characteristics besides vaccination status may affect these rates, and unidentified breakthrough cases will inflate the unvaccinated death rates.

What percentage of non-vaccinated people over 60 have co-morbidities which were the actual cause of death? Corona viruses are NOT lethal in and of themselves, or everyone who contracted this pathogen would die !! Corona = Death is a lie … just like Case = Infection is a lie. Maybe we plot ‘Covid deaths vs. Obesity’ … ‘Come on Man’, this just plays into the hands of the puppet masters.
How about we discuss excess deaths per million plotted over the last 10 years … that’s a BIG nothing burger.