Yet more evidence of the wind-down. Some of this can be attributed to people just not being bothered to get tested any more, which is a good thing. I will note again that some of the difference is deaths is due to vaccines, but a pull-forward effect from early in the epidemic is also likely at work. Dave’s notes:
- For this version of the yearly comparison charts the date axis is formatted to display from July 1 to June 30, for 20220-2021 and 2021-2022. Data before July 1, 2020 is not shown.
- For all charts the last 7 days of data is excluded to avoid charting incomplete data. For the deaths chart data from the last 14 days is excluded. Note however that reporting by MDH has been lagging more than usual since January, and they are still adding cases from before Feb. 1.
- All data is taken from the Minnesota Department of Health Situation Update for OCVID-19 web page https://www.health.state.mn.
us/diseases/coronavirus/ situation.html and from the Response and Preparation web page https://mn.gov/covid19/data/ response-prep/response- capacity.jsp. - All data is shown as 7 day running averages.
- Fig. 1: Average tests per day continue to drop sharply, falling to roughly 20,000 tests per day. With so few cases being found it makes a person wonder who exactly is getting tested every day?
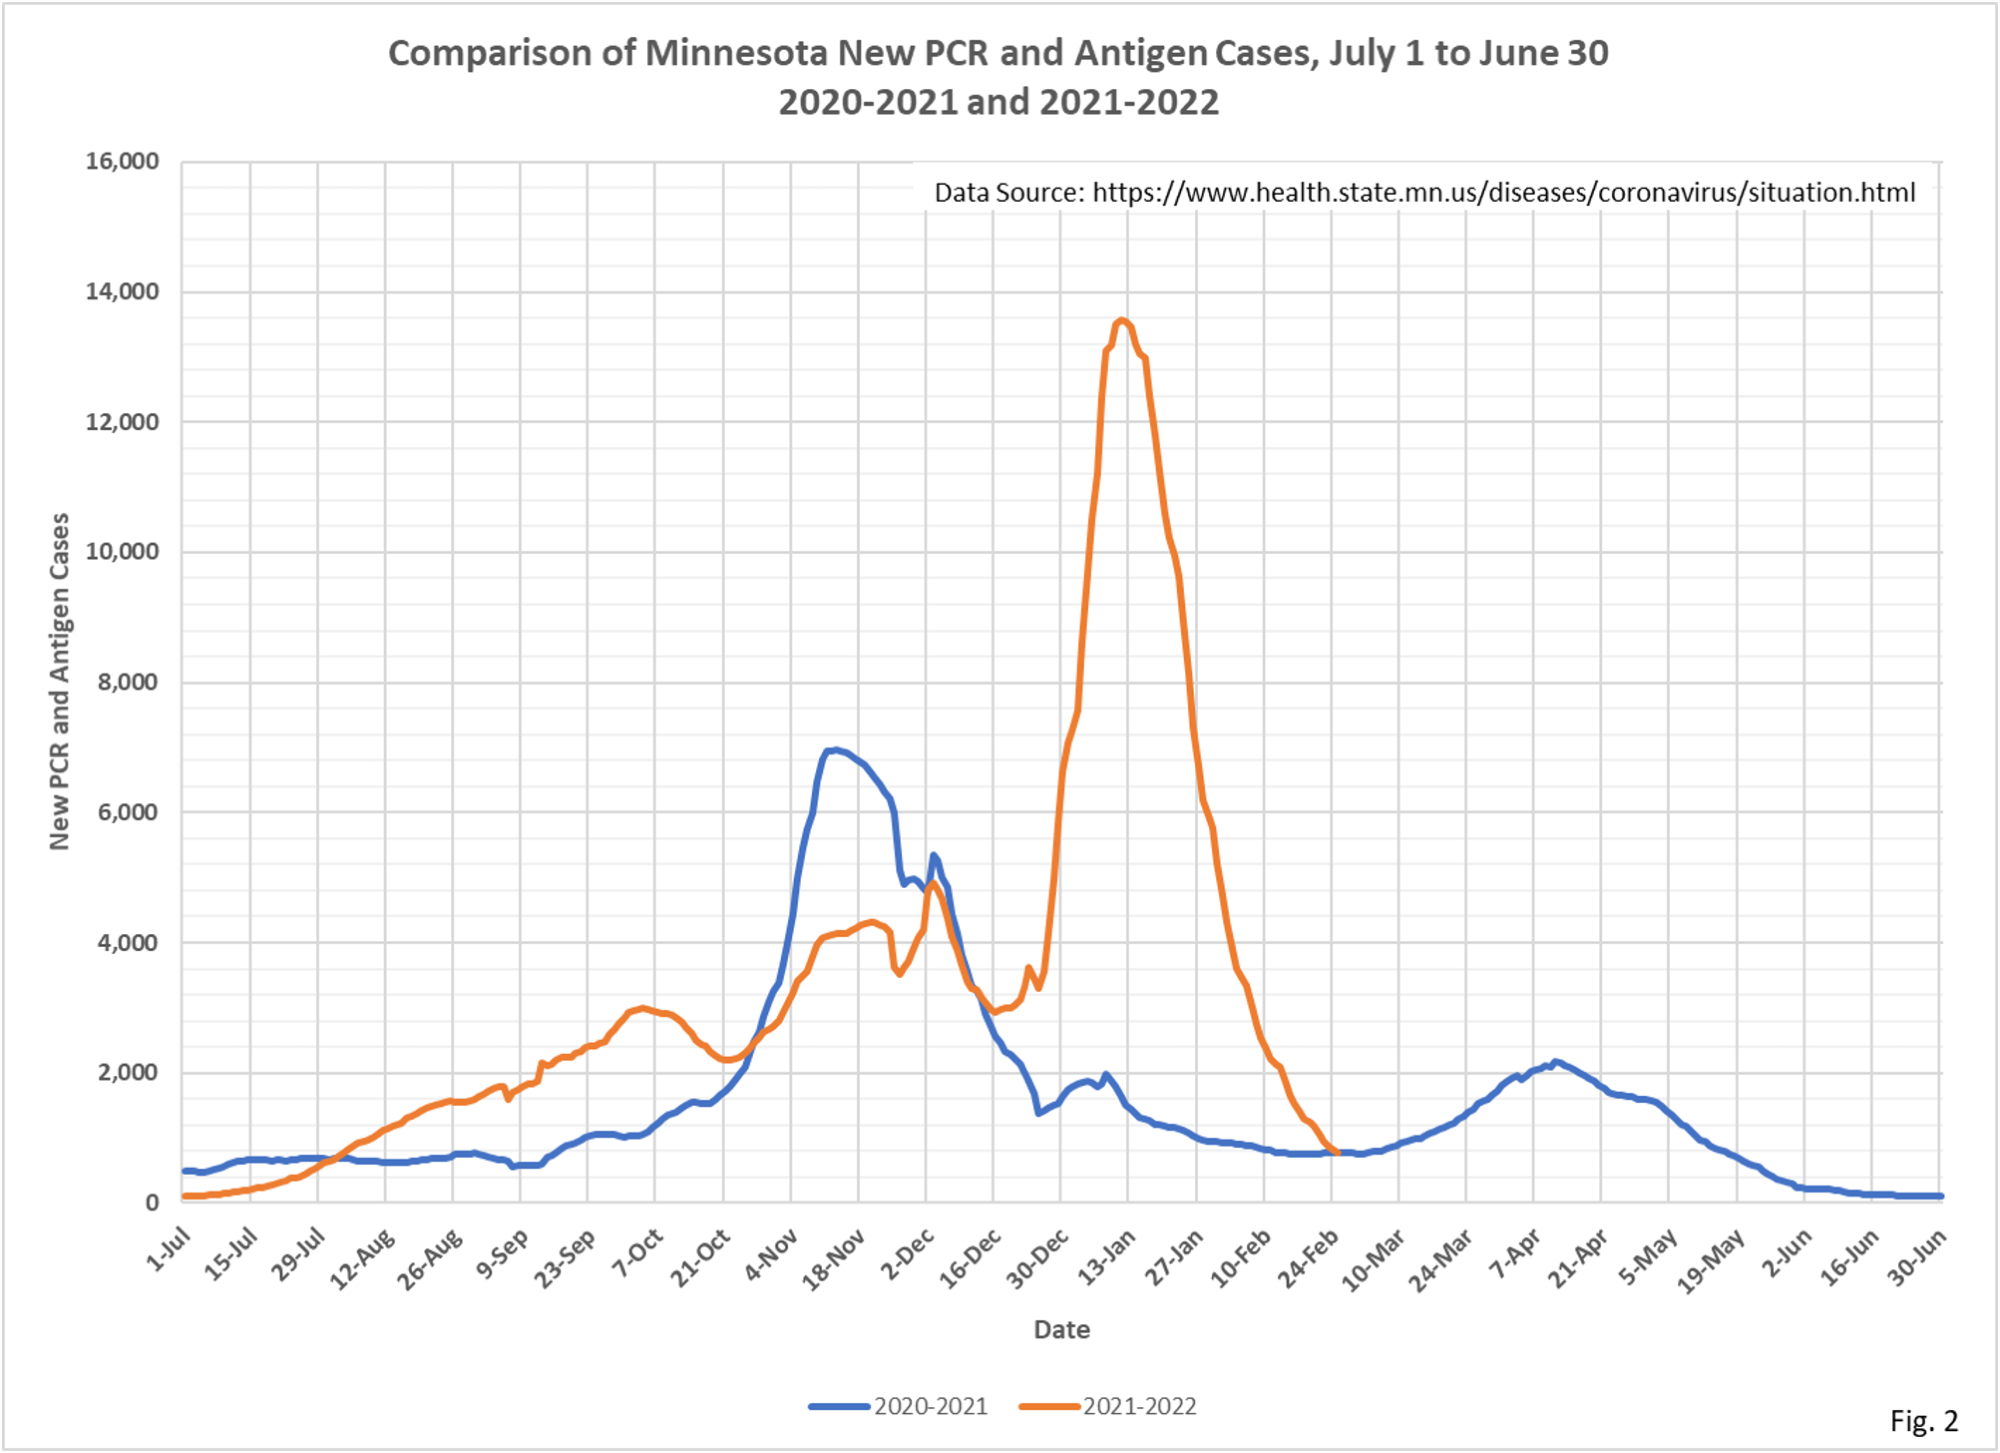
- Fig. 2: New daily cases per day continue to drop sharply, and are now at levels last seen in 2021 at this time. Note that last year we had a relatively minor surge in the spring, so we will want to keep a close watch in case we see something similar this year. It is hard to believe an increase in cases is possible given vaccination rates and the proportion of people with natural immunity, but the Omicron surge seemed improbable as well.
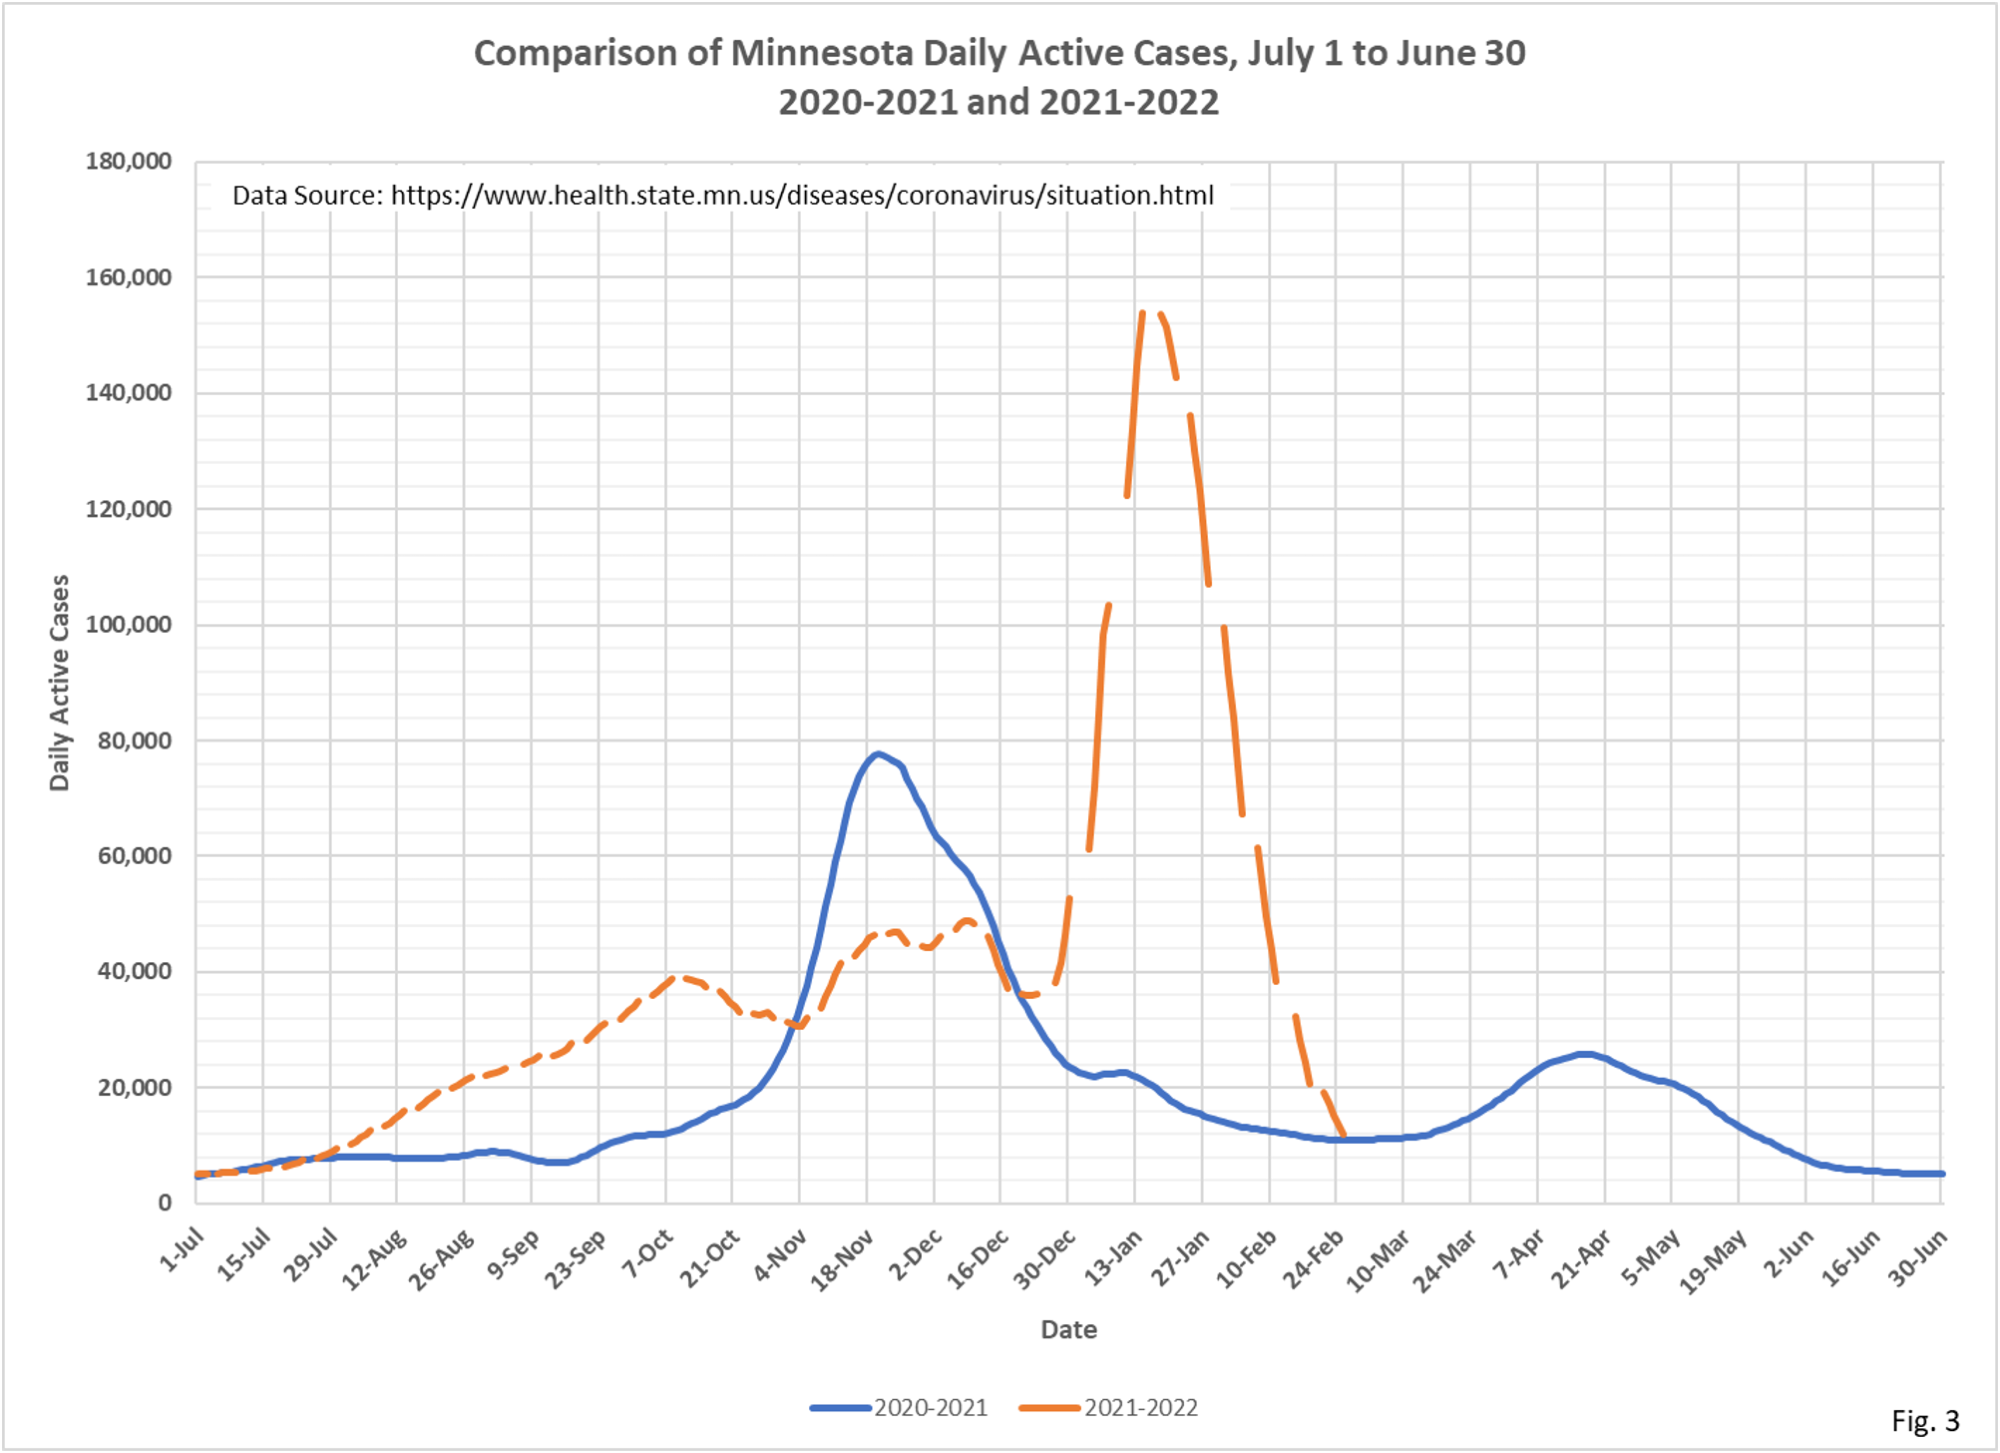
- Fig. 3: Active cases dropping sharply, lagging slightly behind new daily cases per day. Active cases are roughly at the same level as a year ago, just as new daily cases are.
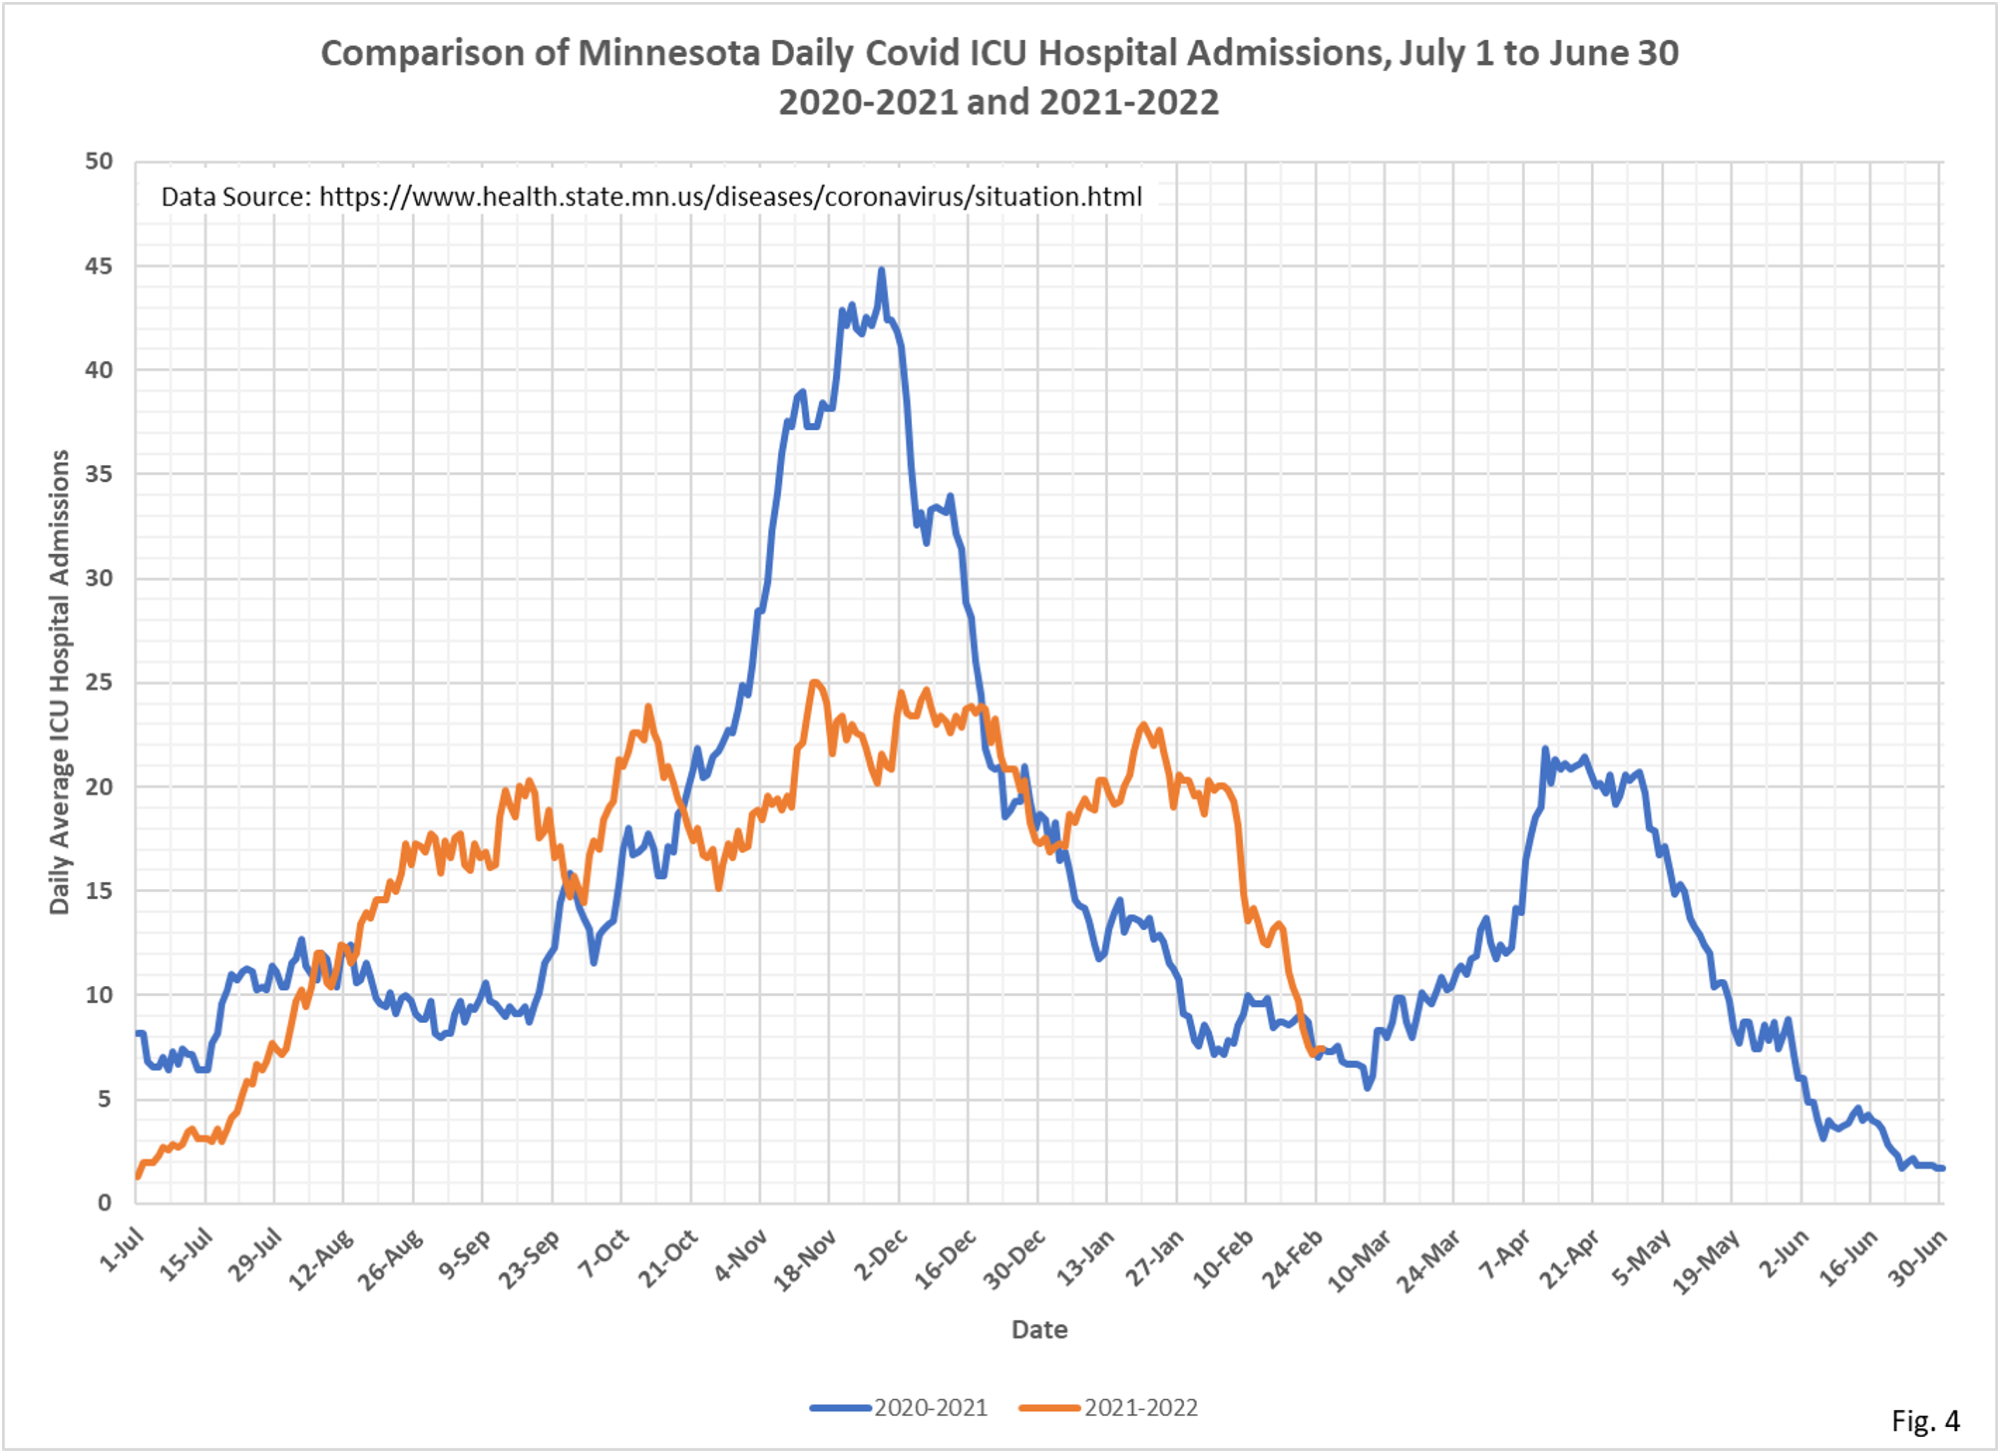
- Fig. 4:Covid ICU admissions per day have declined greatly, finally. Covid ICU admissions are averaging 7 per day statewide.
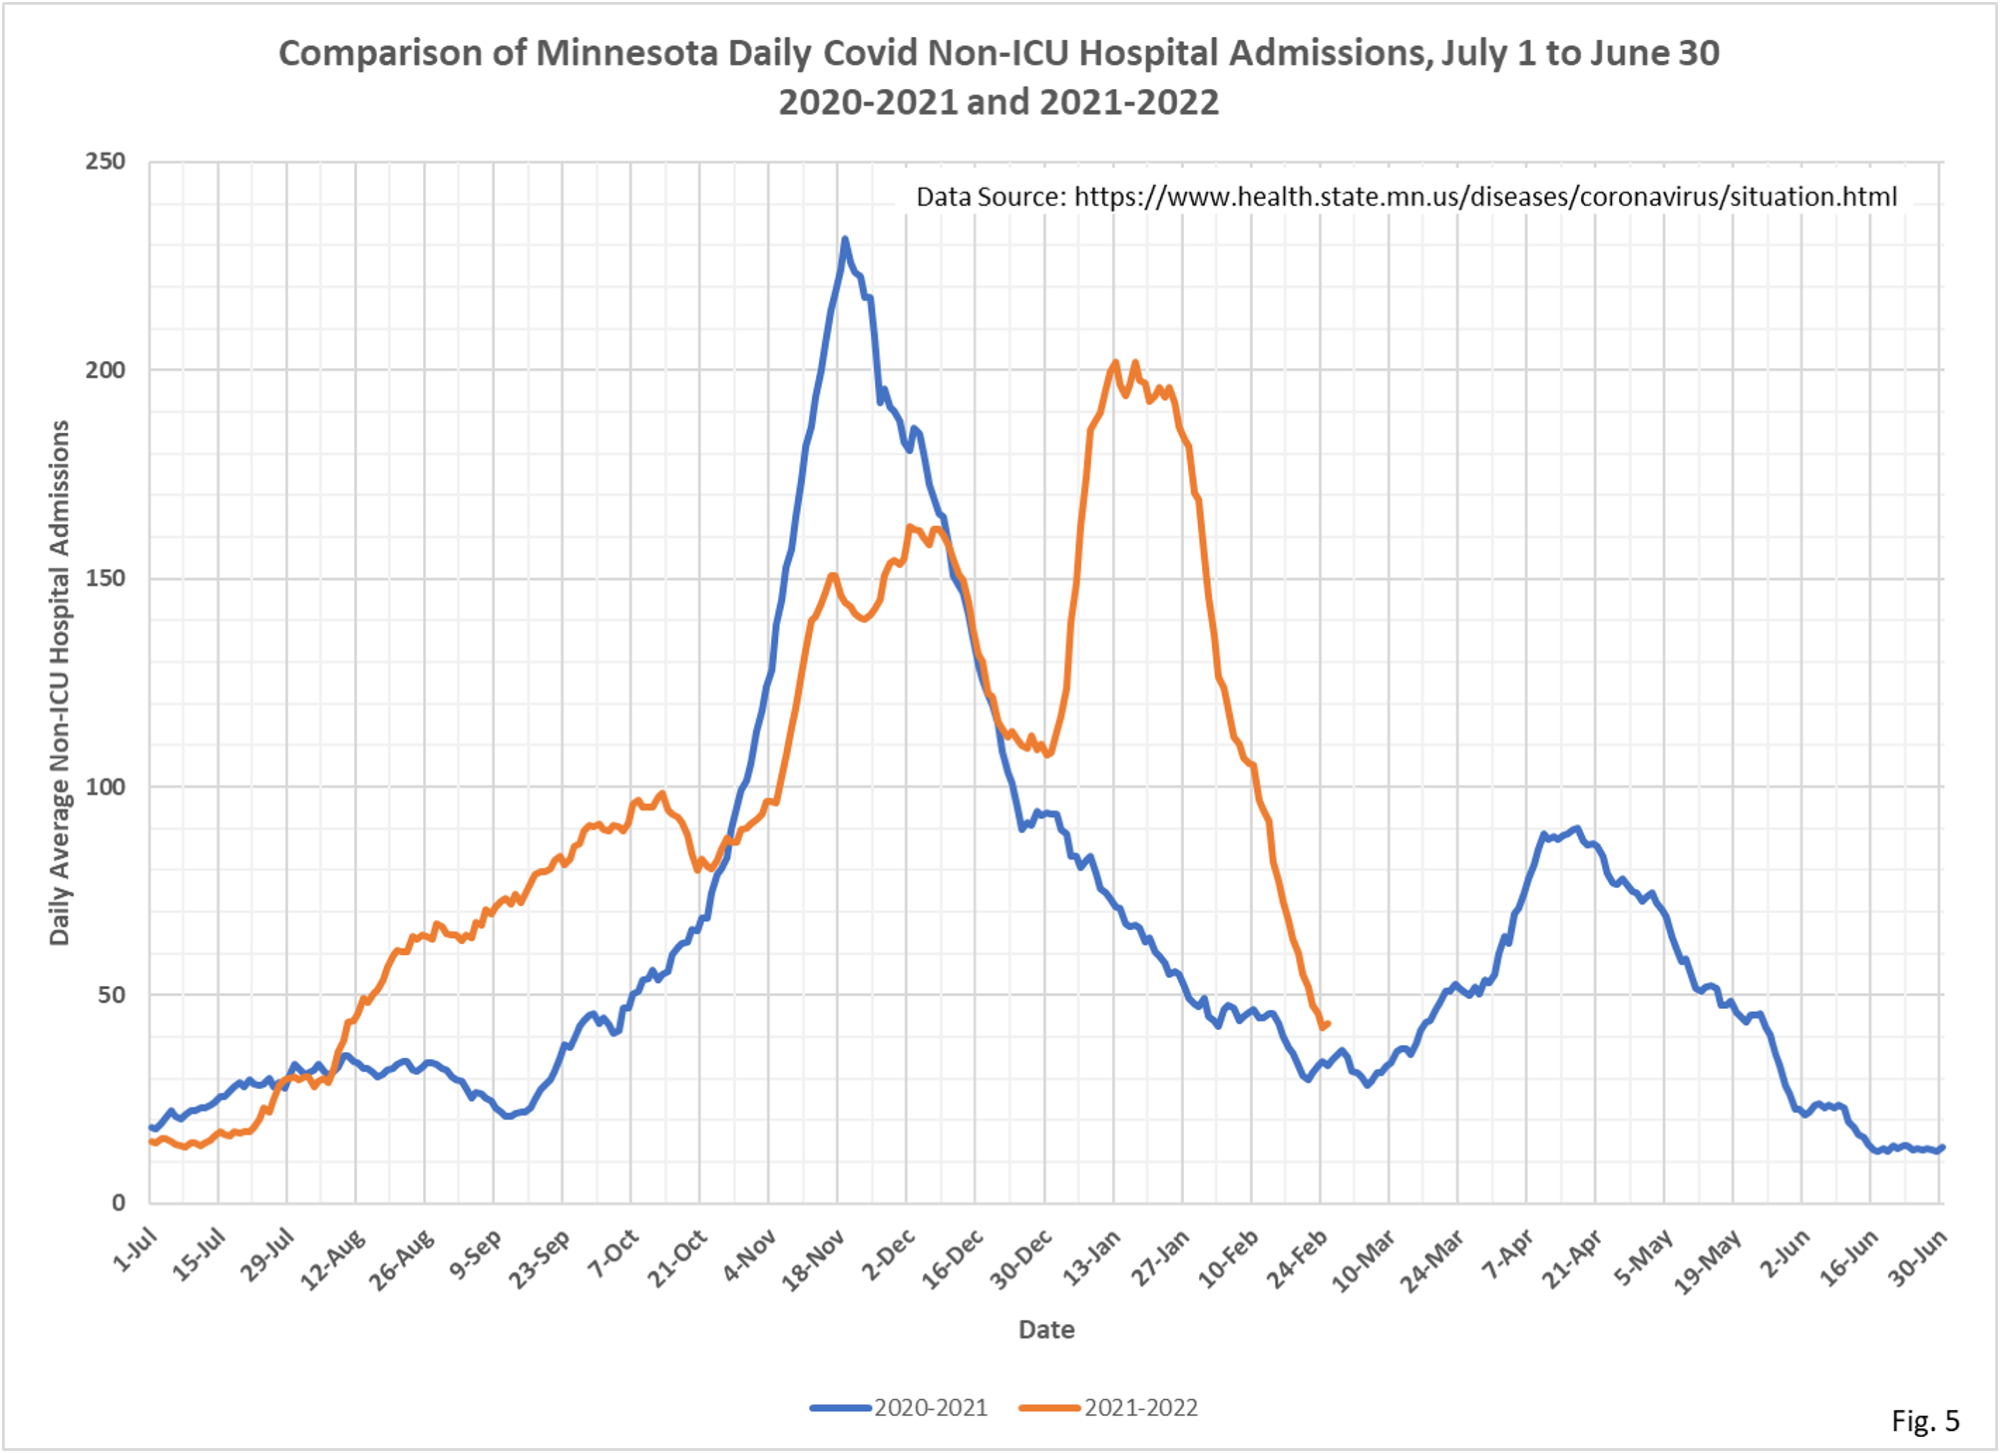
- Fig. 5: Covid Non-ICU admissions are also declining sharply, averaging 42 admissions per day.
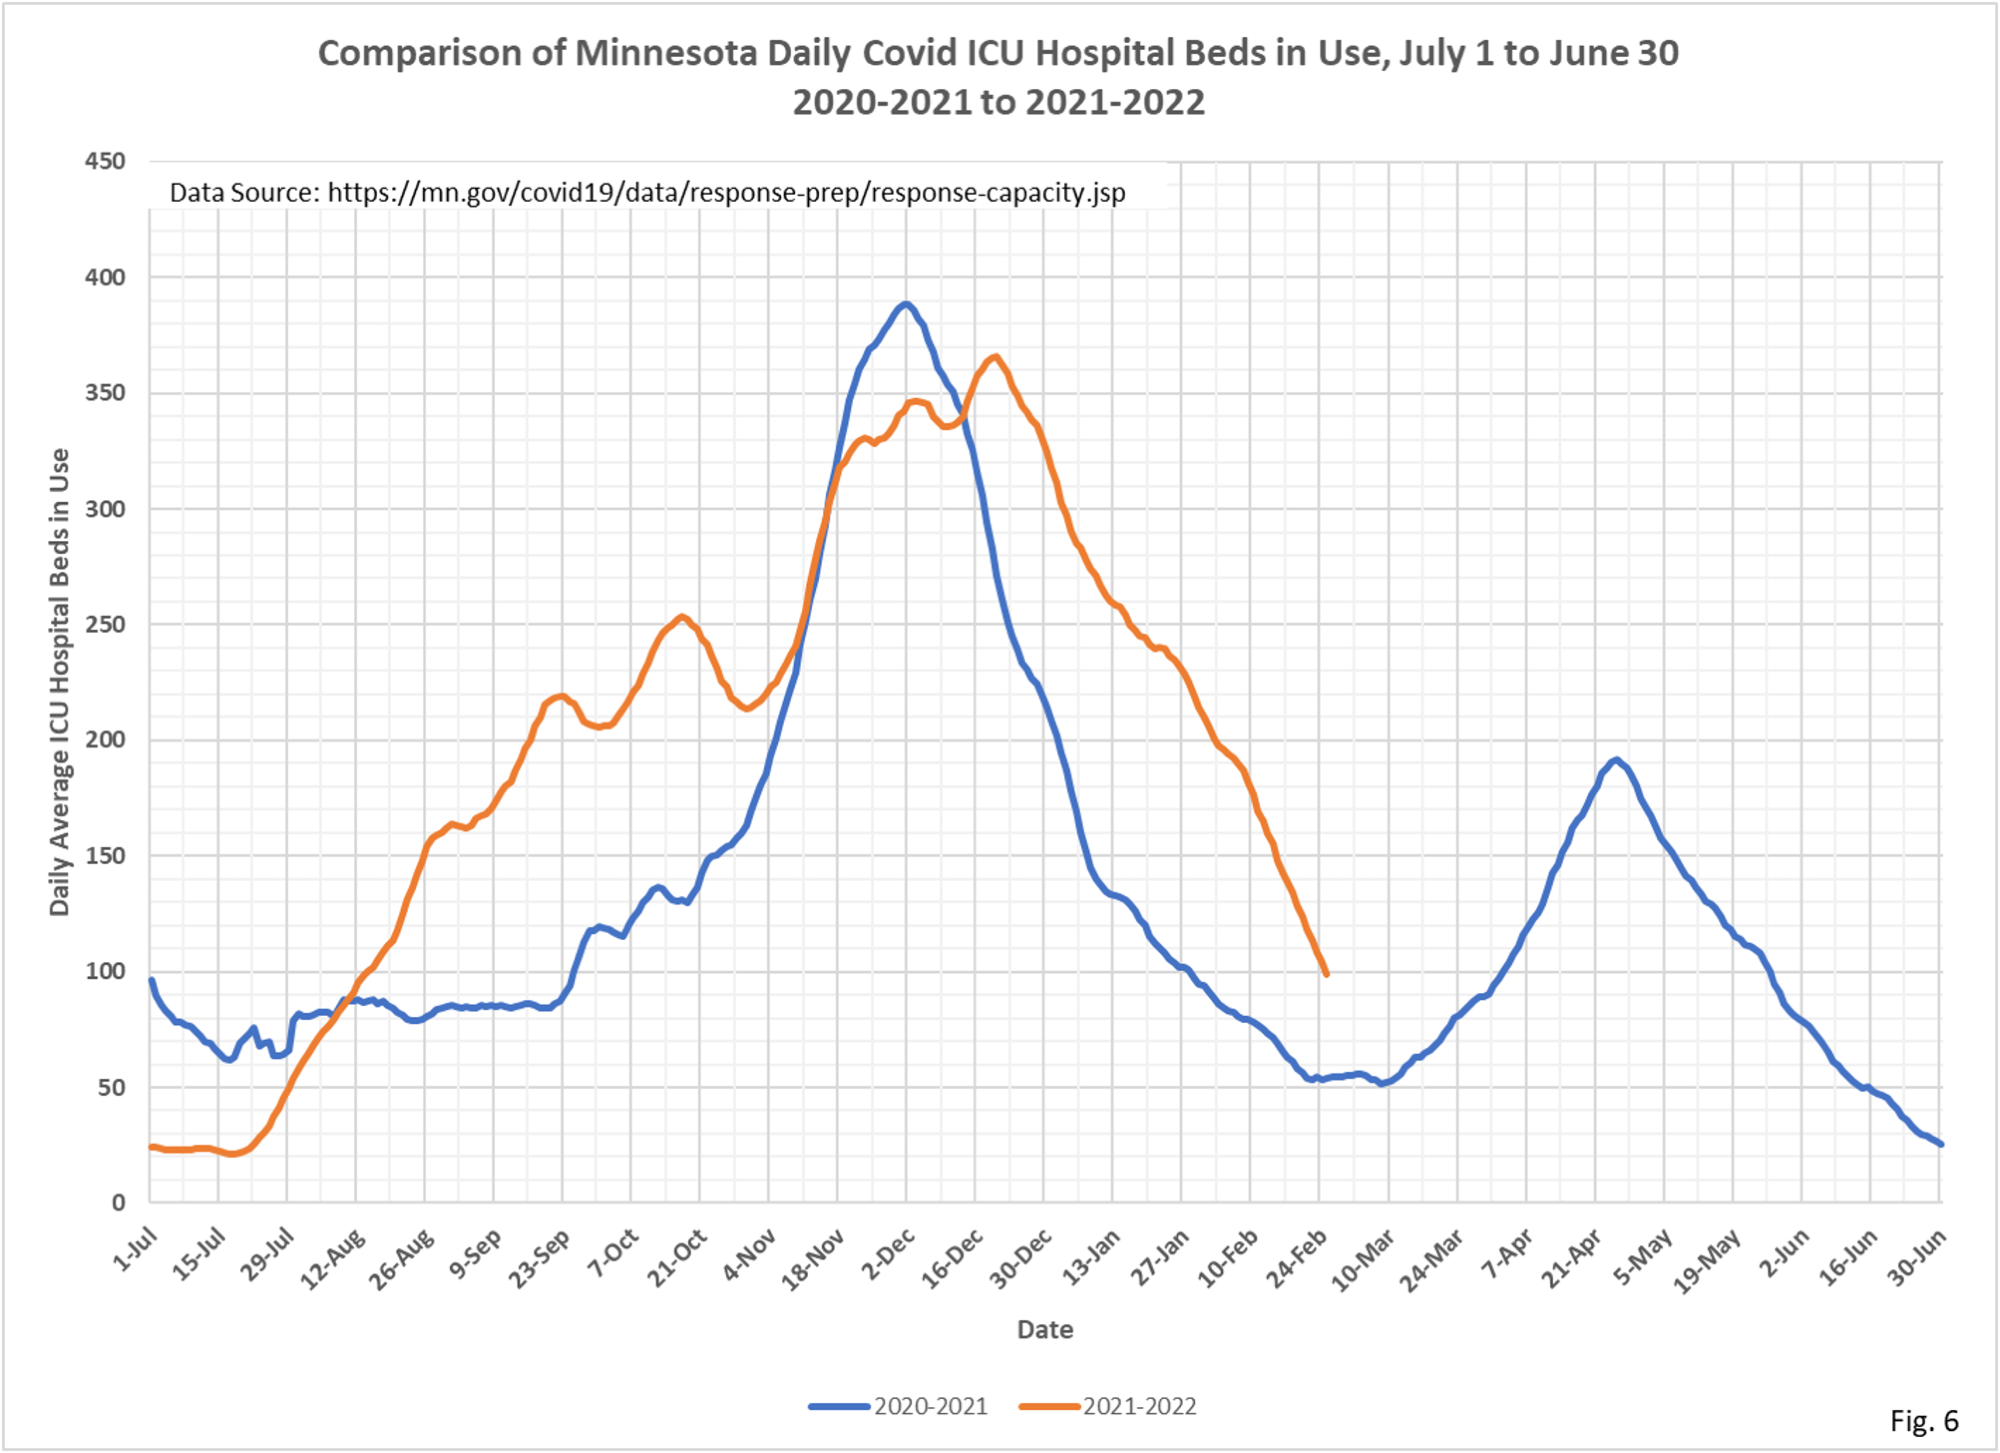
- Fig. 6: ICU Covid hospital beds in use continuing to fall. The proportional decline in ICU beds in use is roughly similar to the proportional decline in ICU daily admissions, leading us to think that ICU lengths of stay have been relatively consistent.
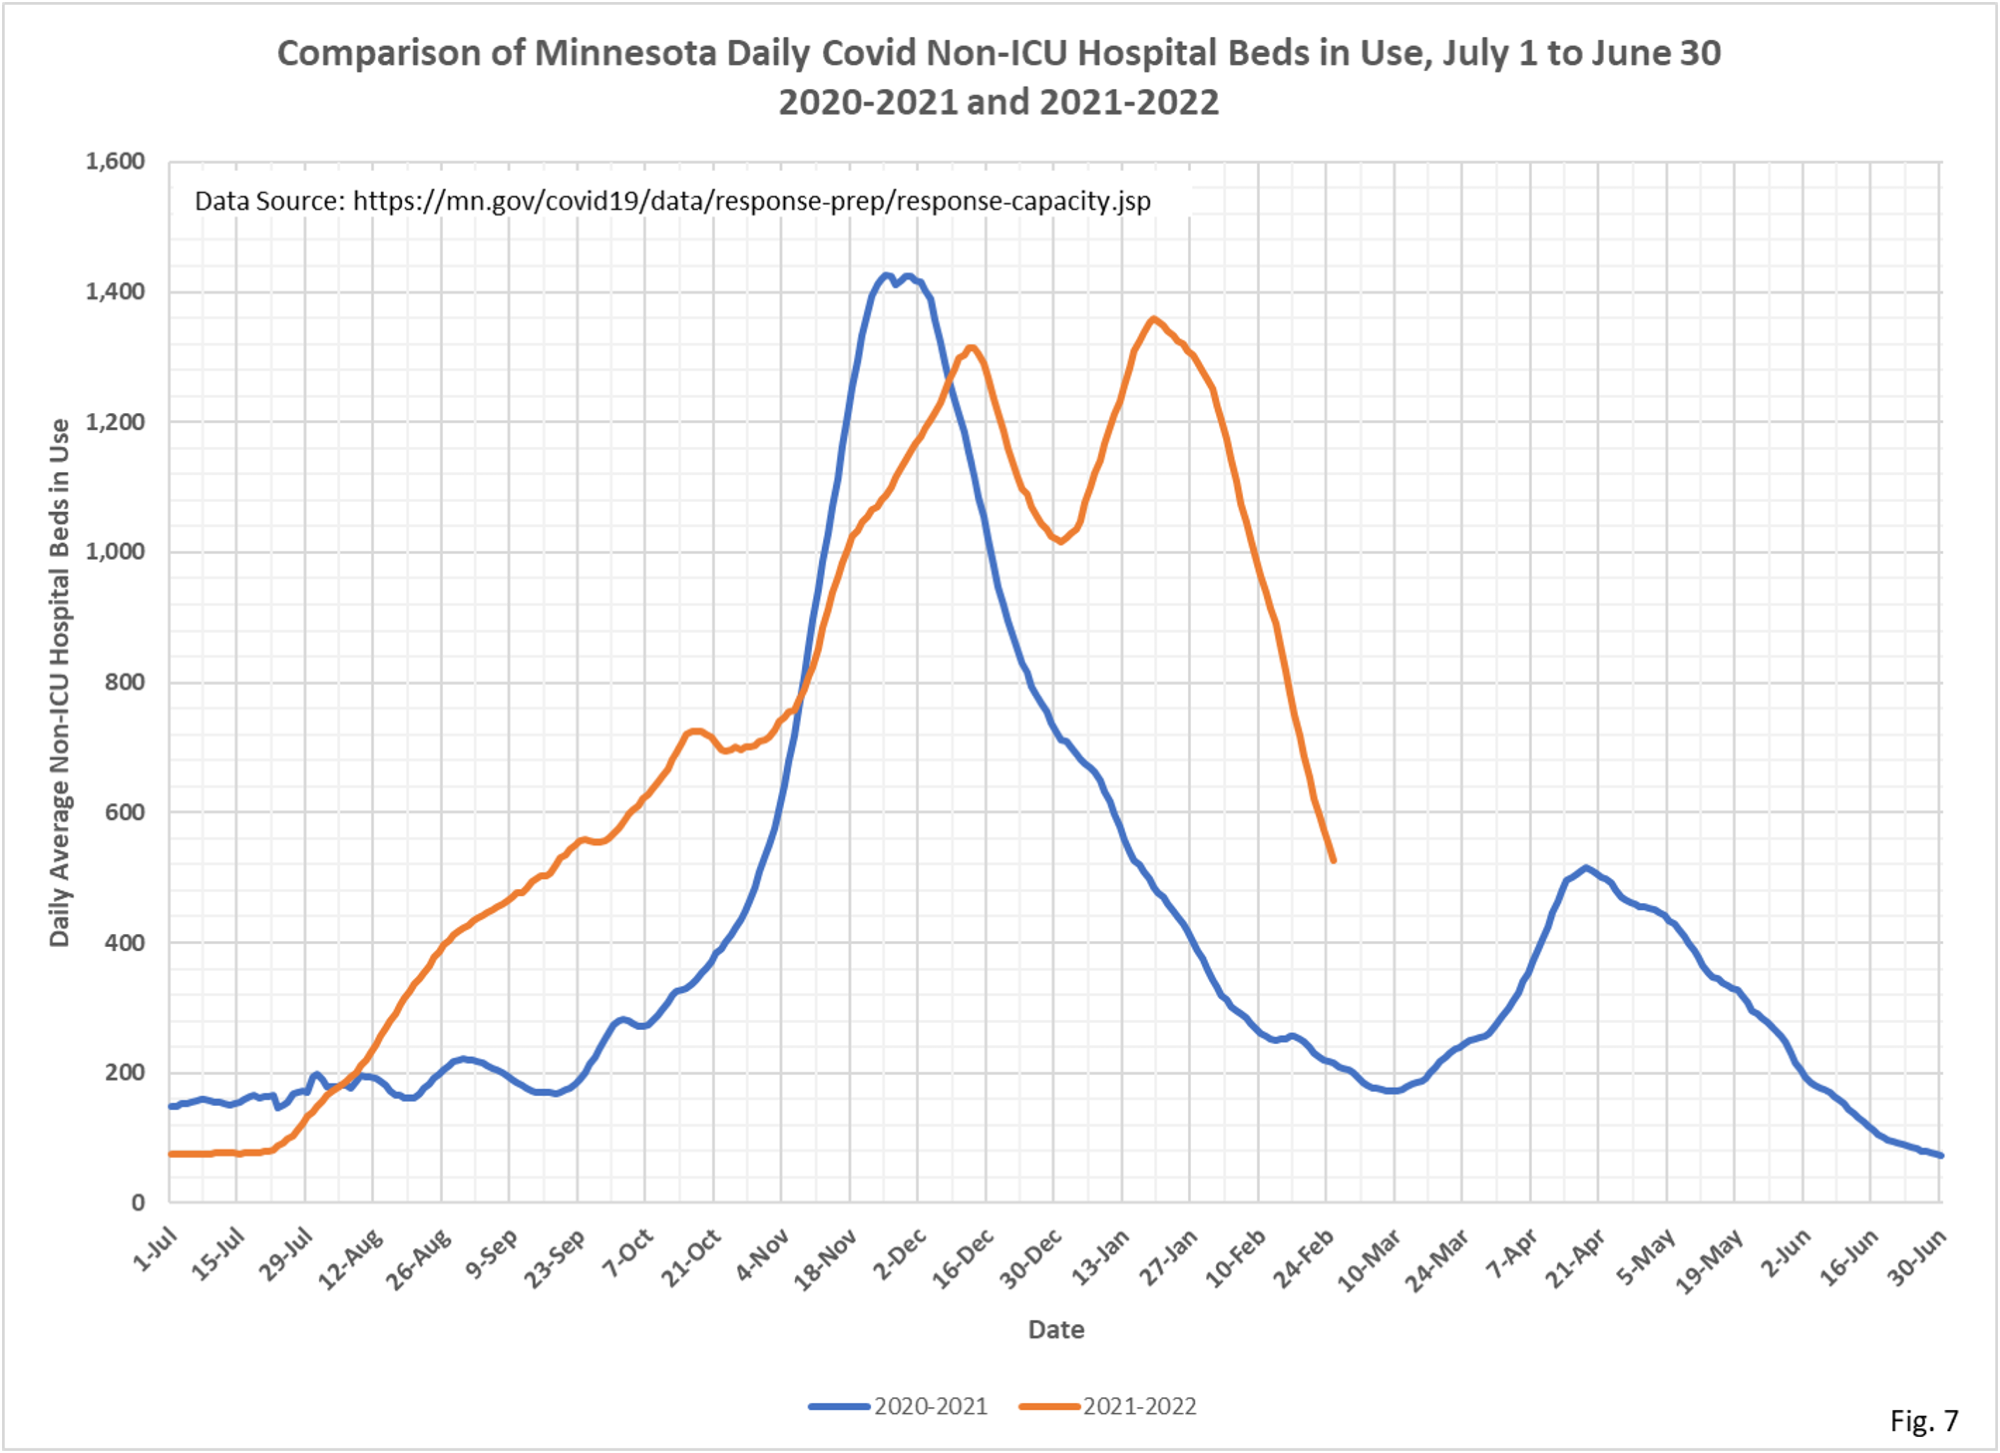
- Fig. 7: Non-ICU Covid hospital beds in use are falling, but still appear relatively elevated compared to the decline in Non-ICU daily admissions, indicating that Non-ICU length of stay may be increasing again. Further analysis is warranted.
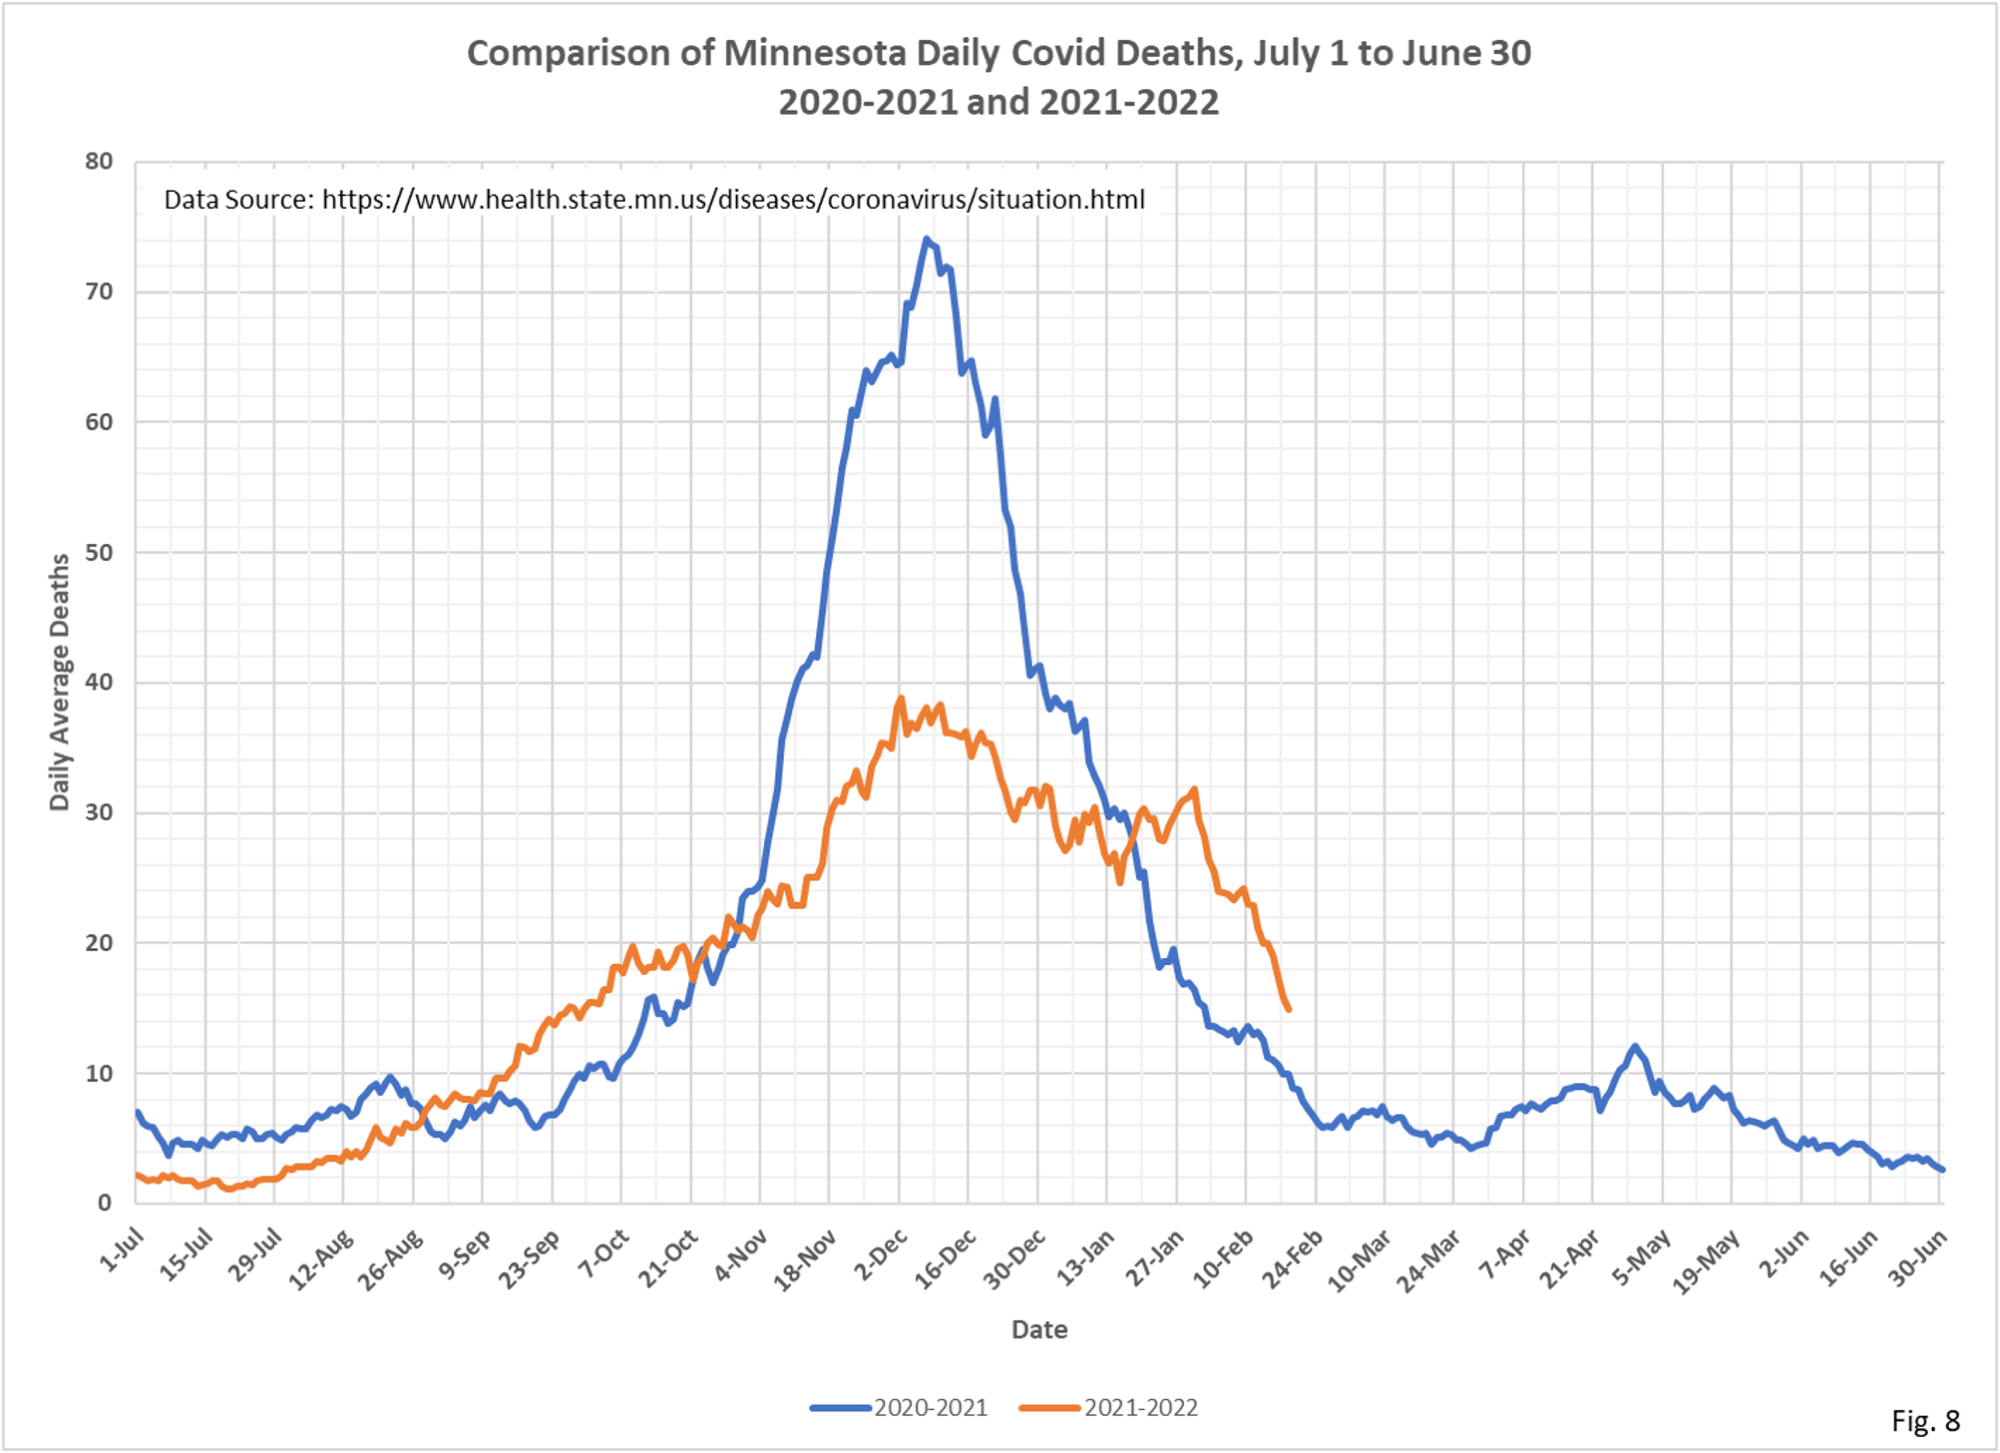
- Fig. 8: Deaths attributed to Covid continue to drift generally lower, showing really no effect from the huge number of cases seen in the Omicron surge. Although we exclude 14 days of data from this chart, we know that MDH is continually reporting deaths that occurred longer ago than 14 days. Some of the recent decline in the death rate will likely end up being revised higher.


As you approach shut down time I just want to say thanks for the fine job you and DD have done keeping us updated during the pandemic. I learned a lot from your efforts.