We are going to plug away on a few regular charts for a little while longer, but this really is winding down. I expect there will be periodic bumps in CV-19 incidence, especially if we keep testing, but I think the public is done so DOH is going to stop putting out data as frequently as it does and we can all go back to obsessing about Ukraine or whatever. This week’s age structure charts just basically show the continued swift decline of epidemic events basically across every age group. Dave’s notes:
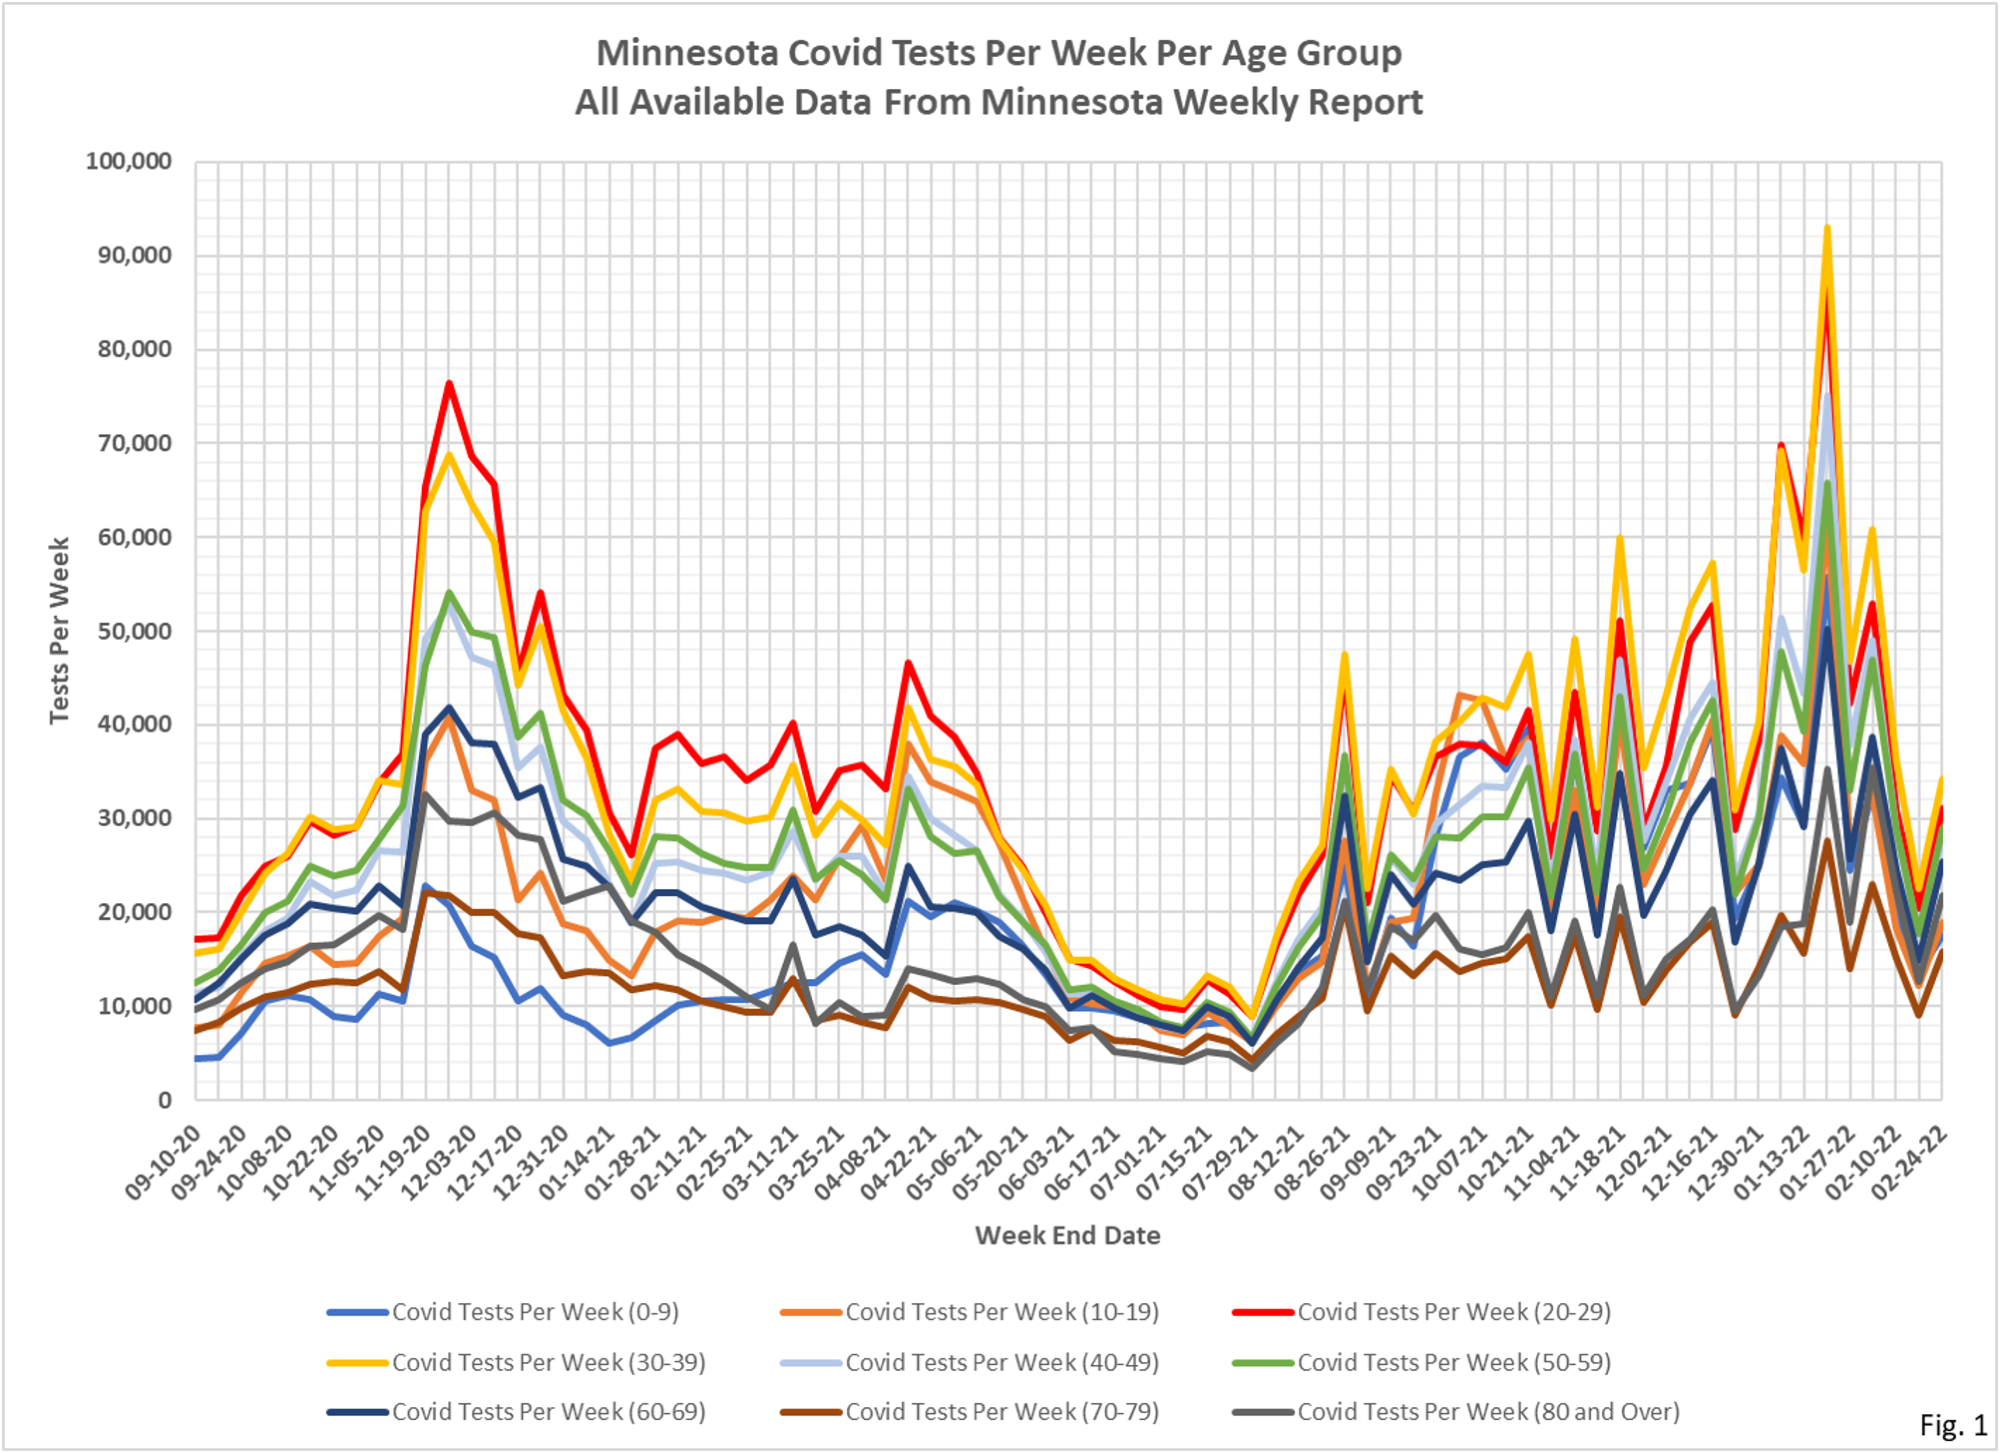
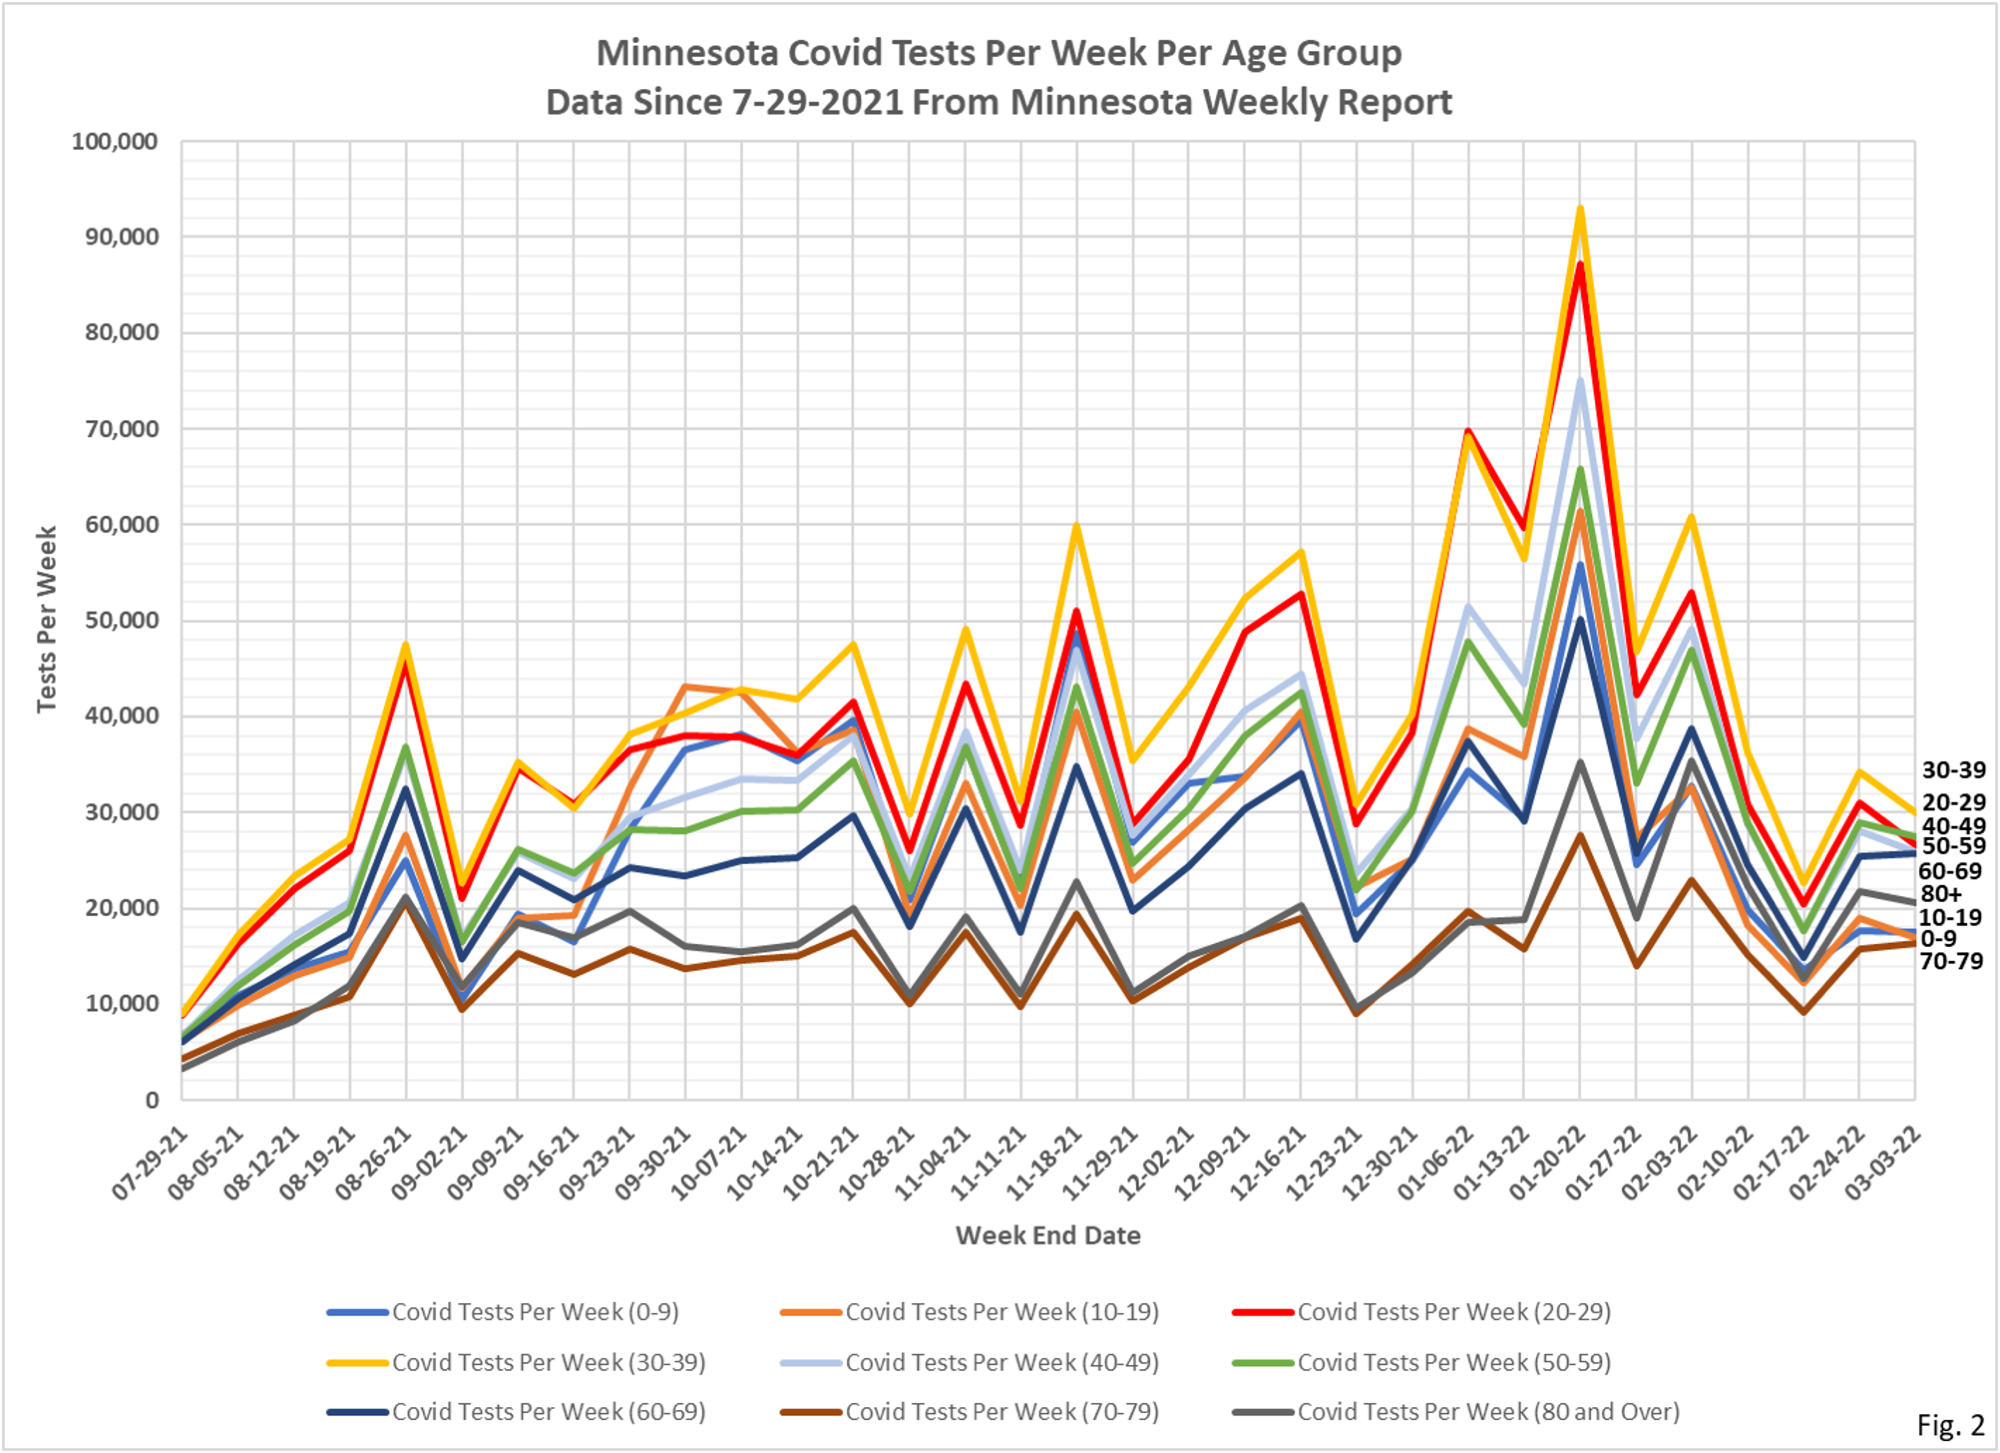
1. There are 2 slides for each set of data, one showing data for the whole pandemic and a second chart showing only data since late July, 2021. Note that the full pandemic slides have different start dates, because Minnesota Department started publishing different data on different dates. This week the shorter time period chart of each pair has been started 4 weeks later than previously.
2. The data for the charts on testing, hospital admissions, and deaths comes from the Minnesota Weekly Report (available here: https://www.health.state.mn.us/diseases/coronavirus/stats/index.html). The data in the Weekly Report is presented as cumulative totals for each data type each week. I am taking weekly differences and assembling the data into charts. This data is by date of report, meaning the charts are documenting new events reported this week, even though the underlying event occurred sometime in the past. The data is provided for 5 year age groups, and I am assembling into 10 year age groups to make the charts more readable.
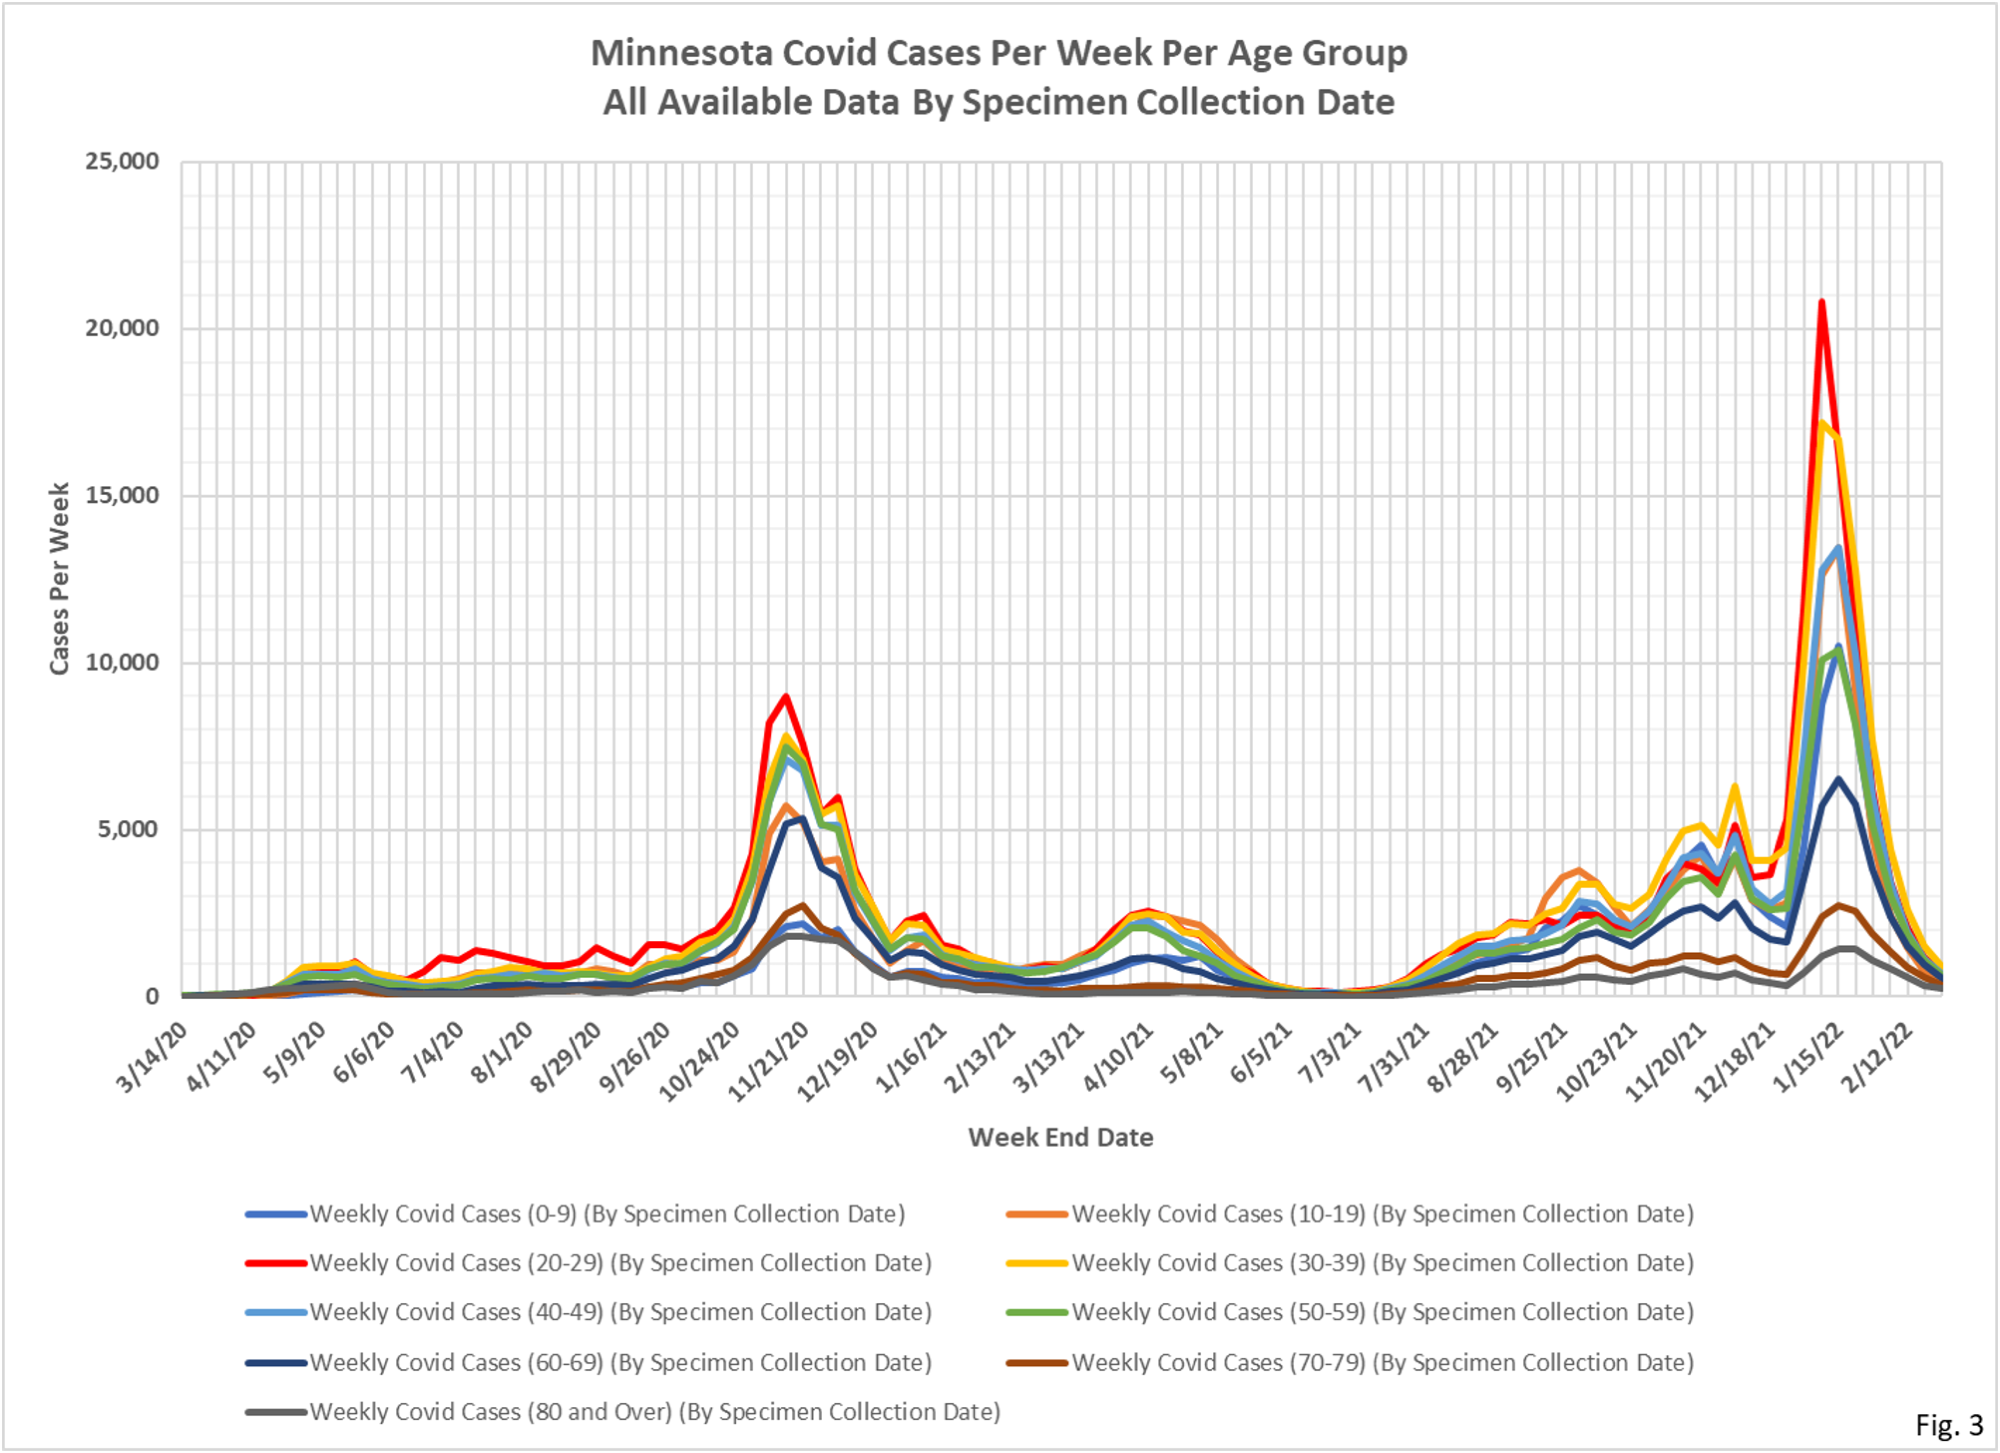
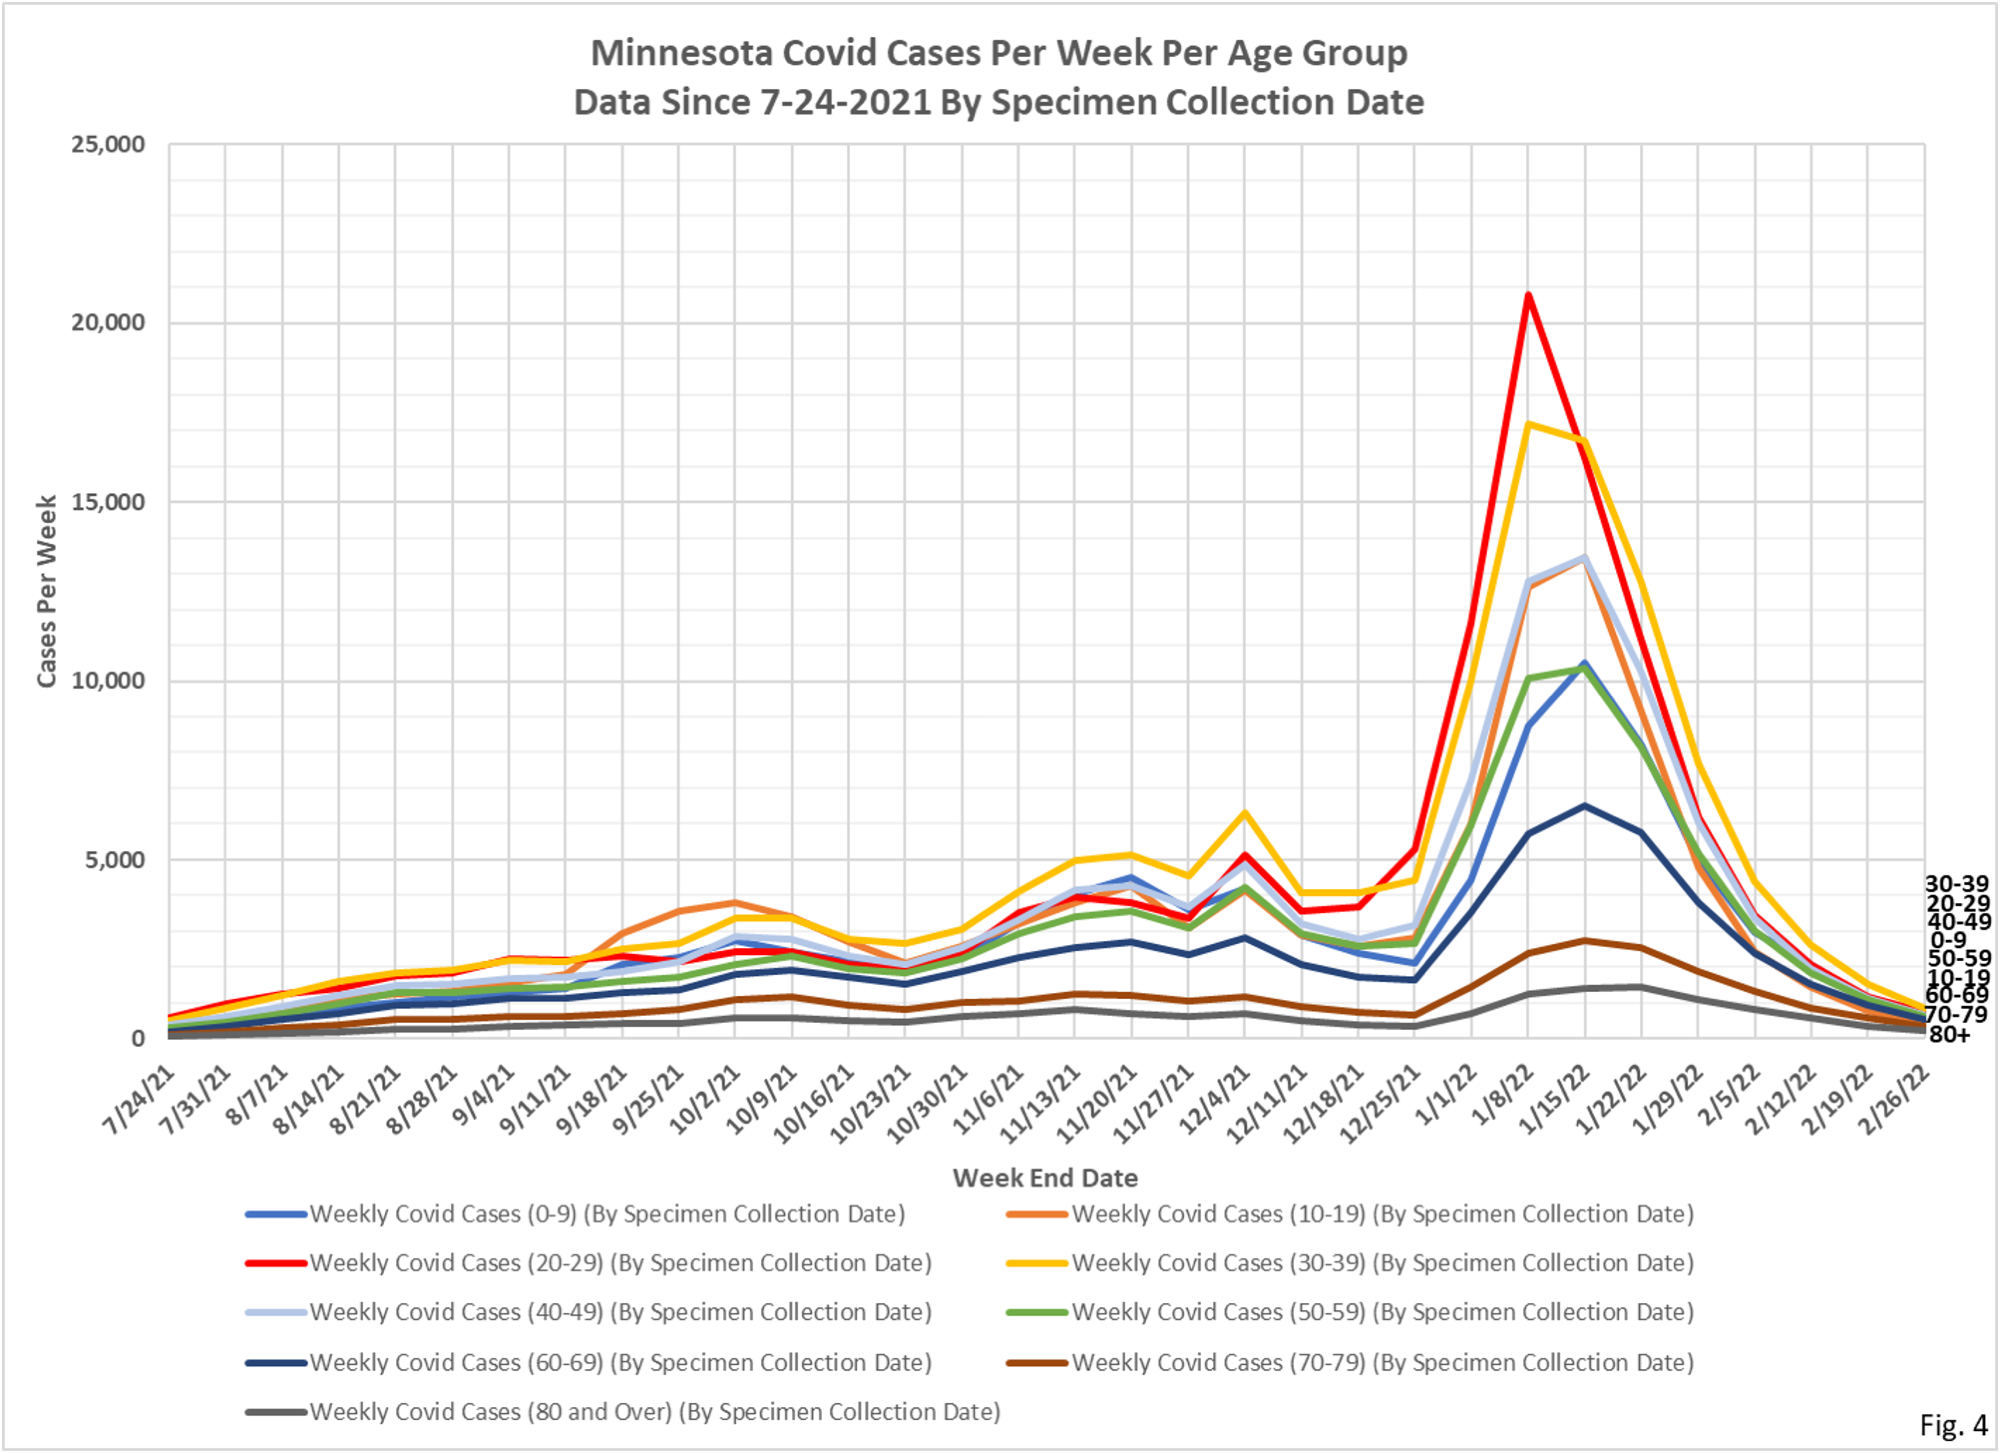
3. The data for the Covid cases per week come from a data file published along with the Minnesota Weekly Report, here: https://www.health.state.mn.us/diseases/coronavirus/stats/index.html#wagscd1 This data is published by date of specimen collection, rather than by date of report as the other data is. The data is provided as cases per week in 5 year age groups. I am compiling the data into 10 year age groups in order for the charts to be more readable. This data is updated by date of specimen collection, so it is possible that past week’s data will be updated.
4. Fig. 1 and 2: Covid Tests Per Week. Reported testing trending flat to slightly lower this week.
5. Fig. 3 and 4: Covid Cases Per Week. The reported Covid cases this week were lower this week in all age groups, continuing the trend since the peak of the Omicron surge in the middle of January. The rate of change is starting to become smaller as the cases trend toward zero. Total cases for the week were reported as 5,163, a 40.5% decrease from last week’s revised total of 8,705 cases. This week’s reported cases were the lowest since 4,553 cases were reported for the week ending 7/31/2021.
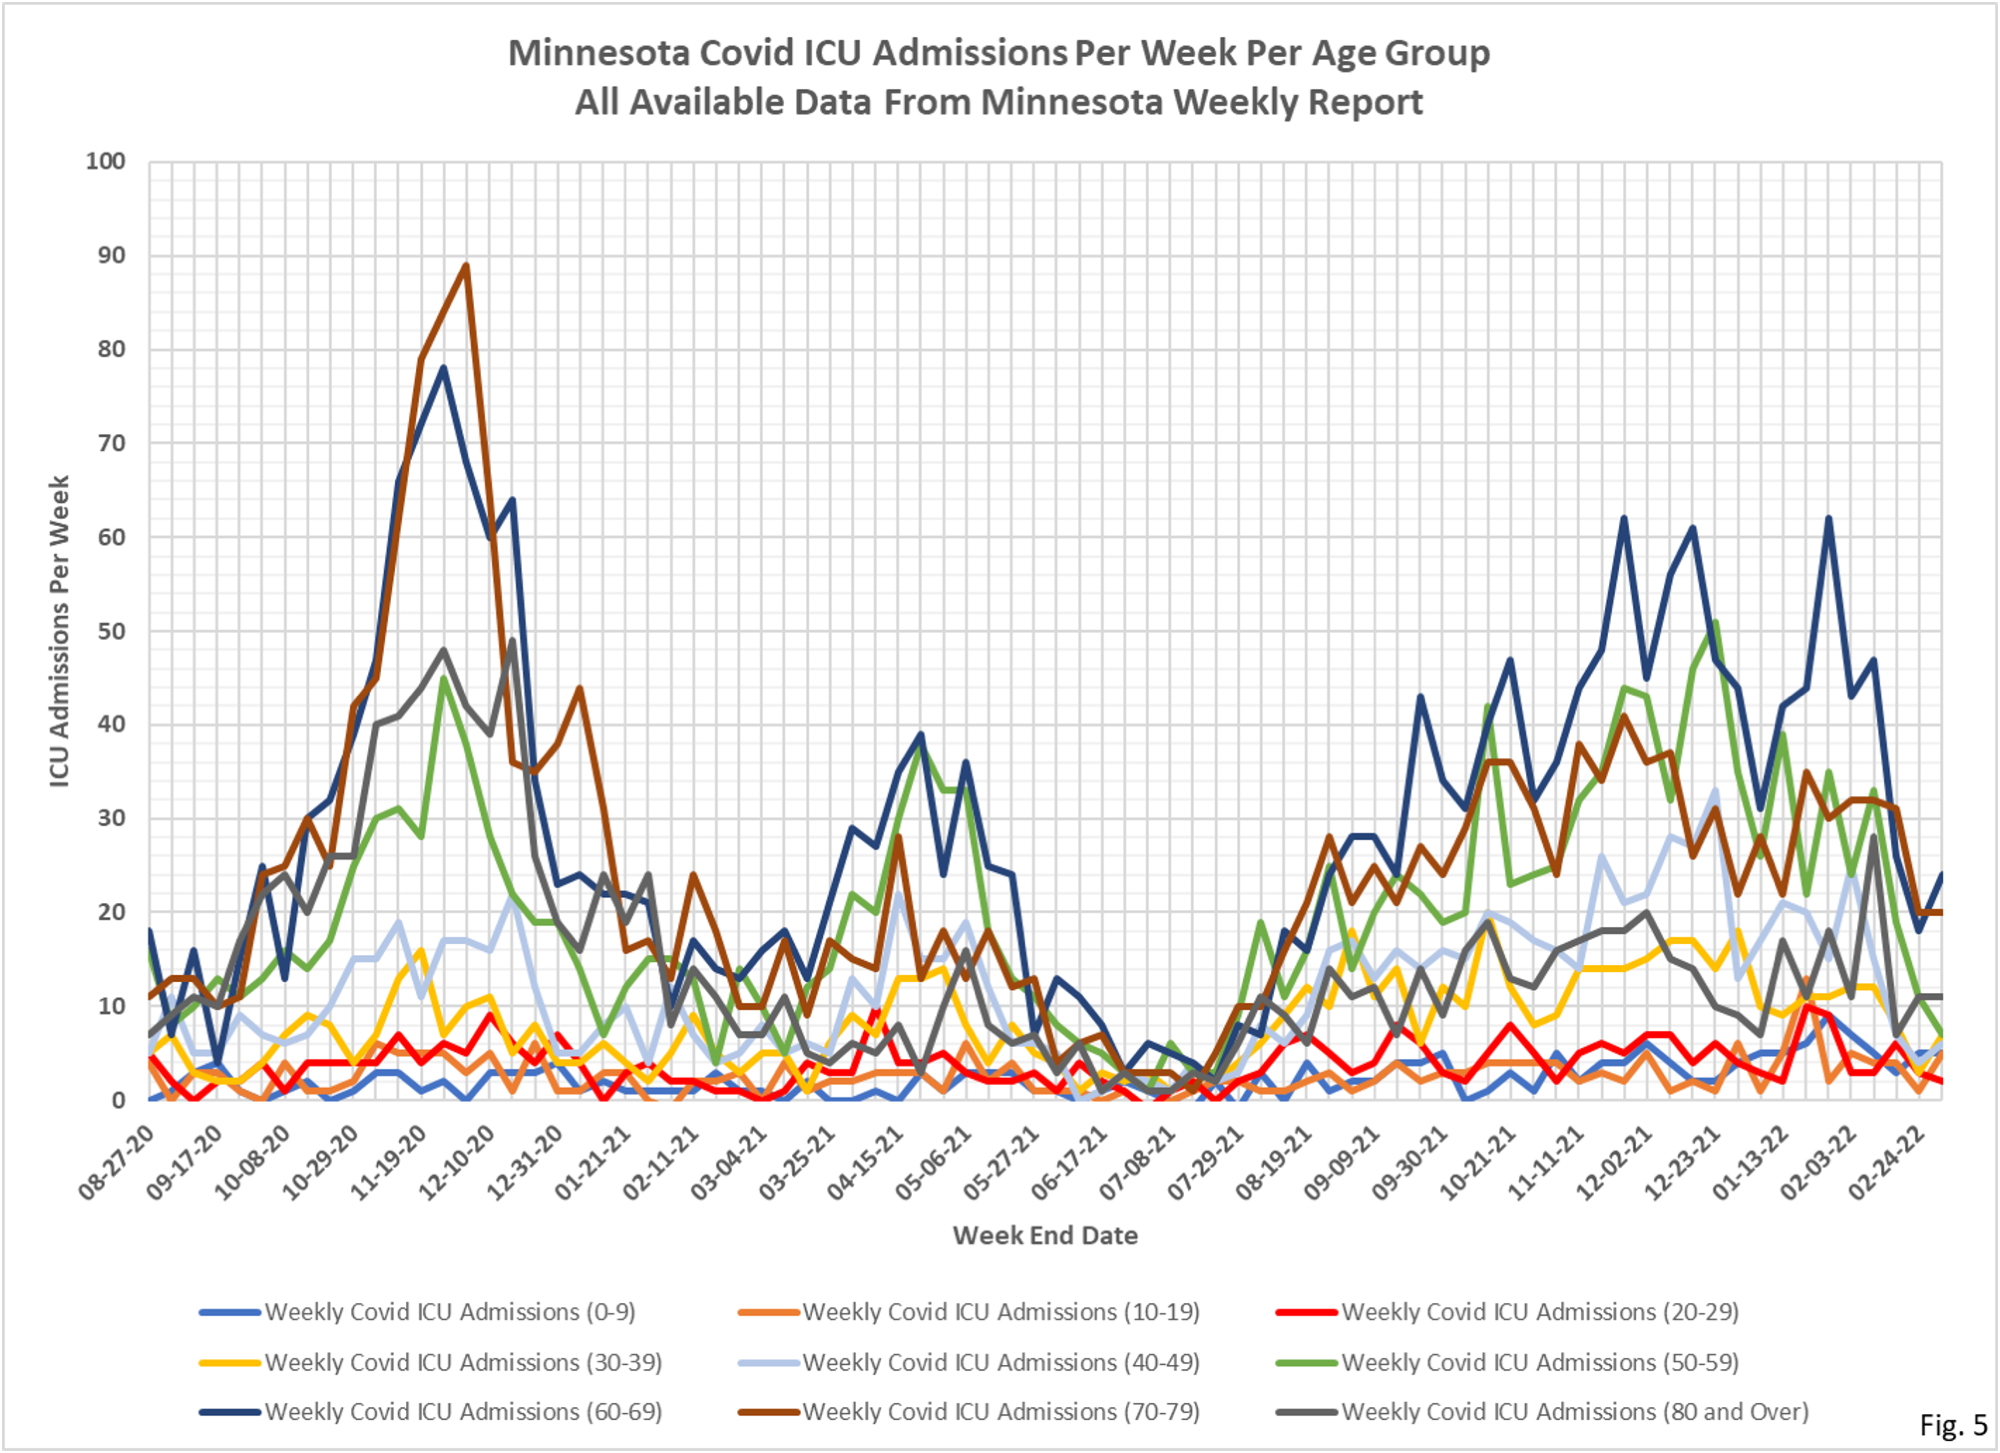
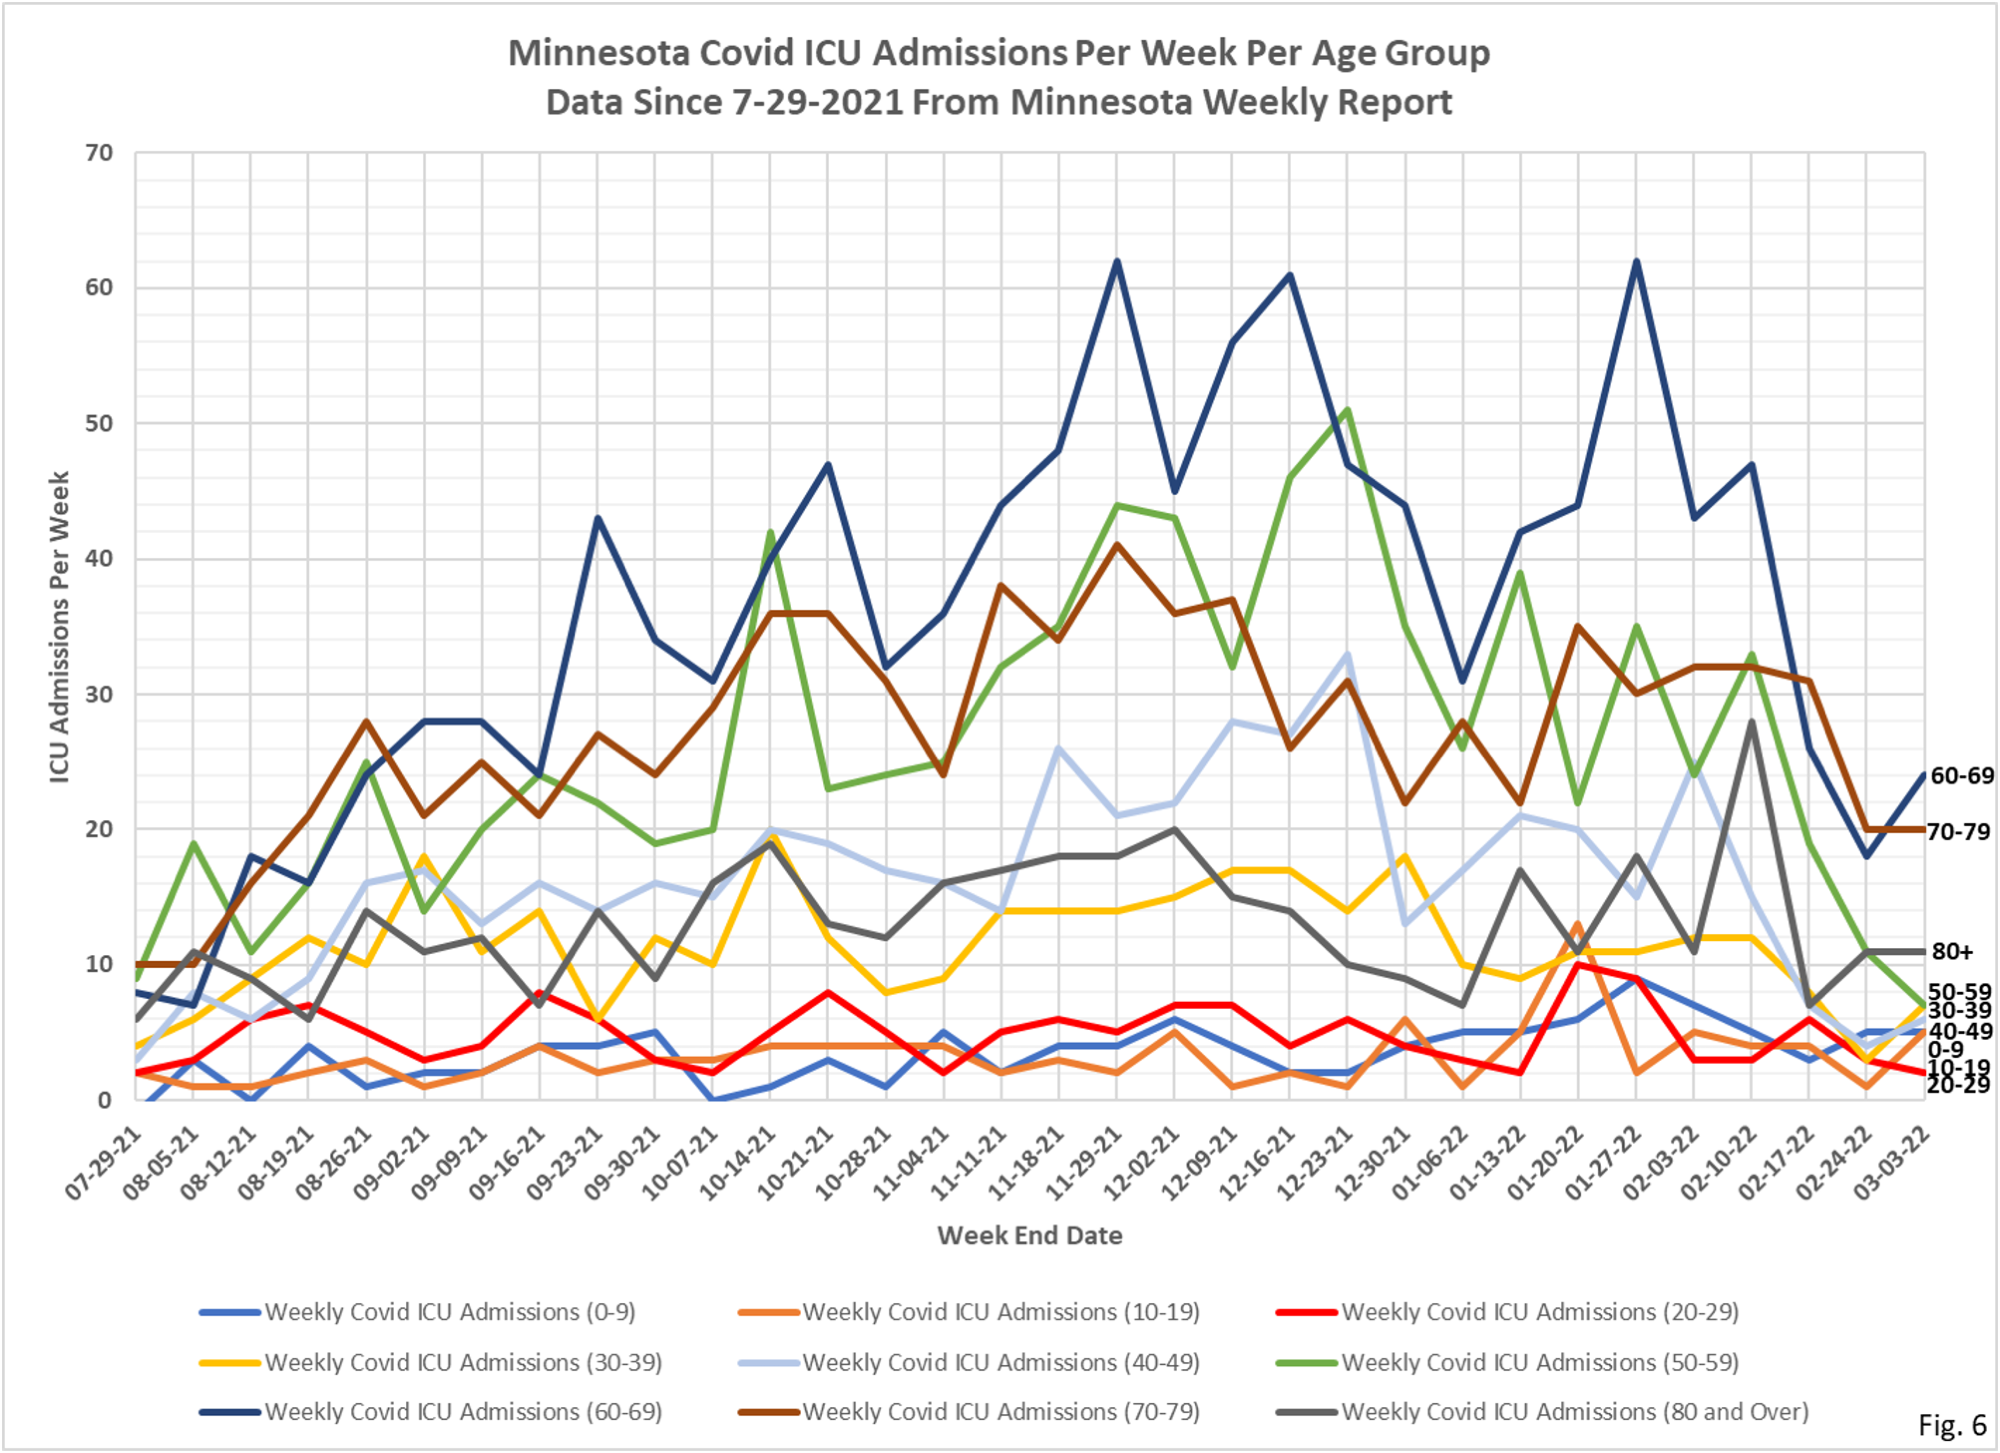
6. Fig. 5 and 6: ICU Covid Admissions Per Week. Reported ICU Covid admissions were mixed this week, interrupting the general downward trend seen in recent weeks. Reported total ICU admissions for the week were 87, an increase of 11 from the 76 reported ICU admissions the prior week. We have filed a Data Practices Act Request for data on incidental positive Covid tests for patients admitted for non-Covid reasons, but so far we have not been given any data. Since cases are still trending down the slight increase in ICU admissions does not seem to be a cause for concern.
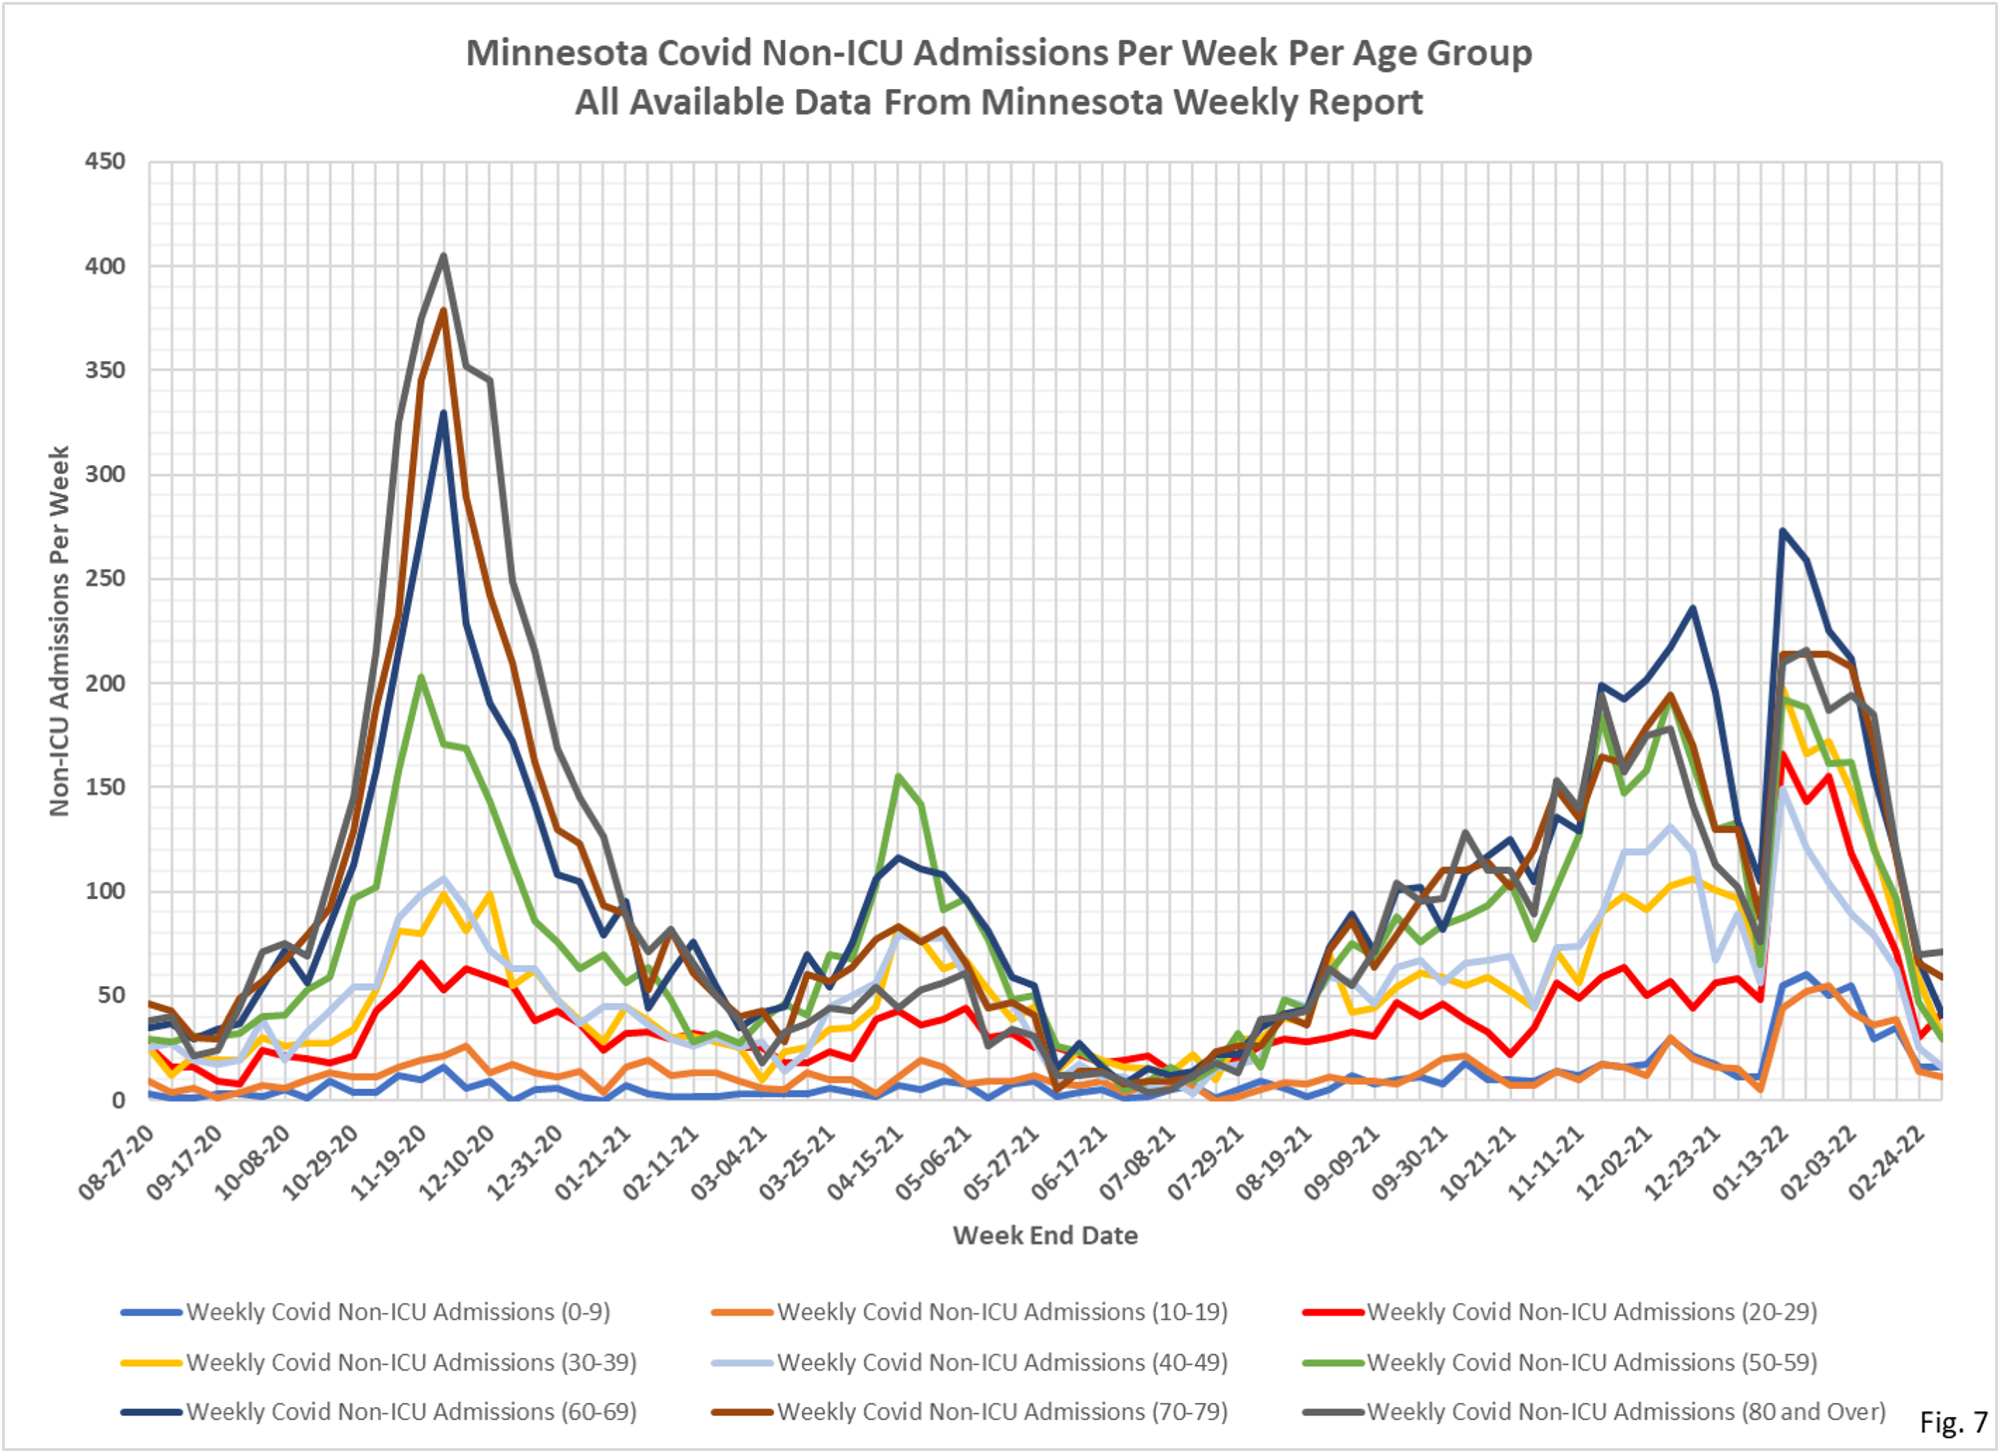
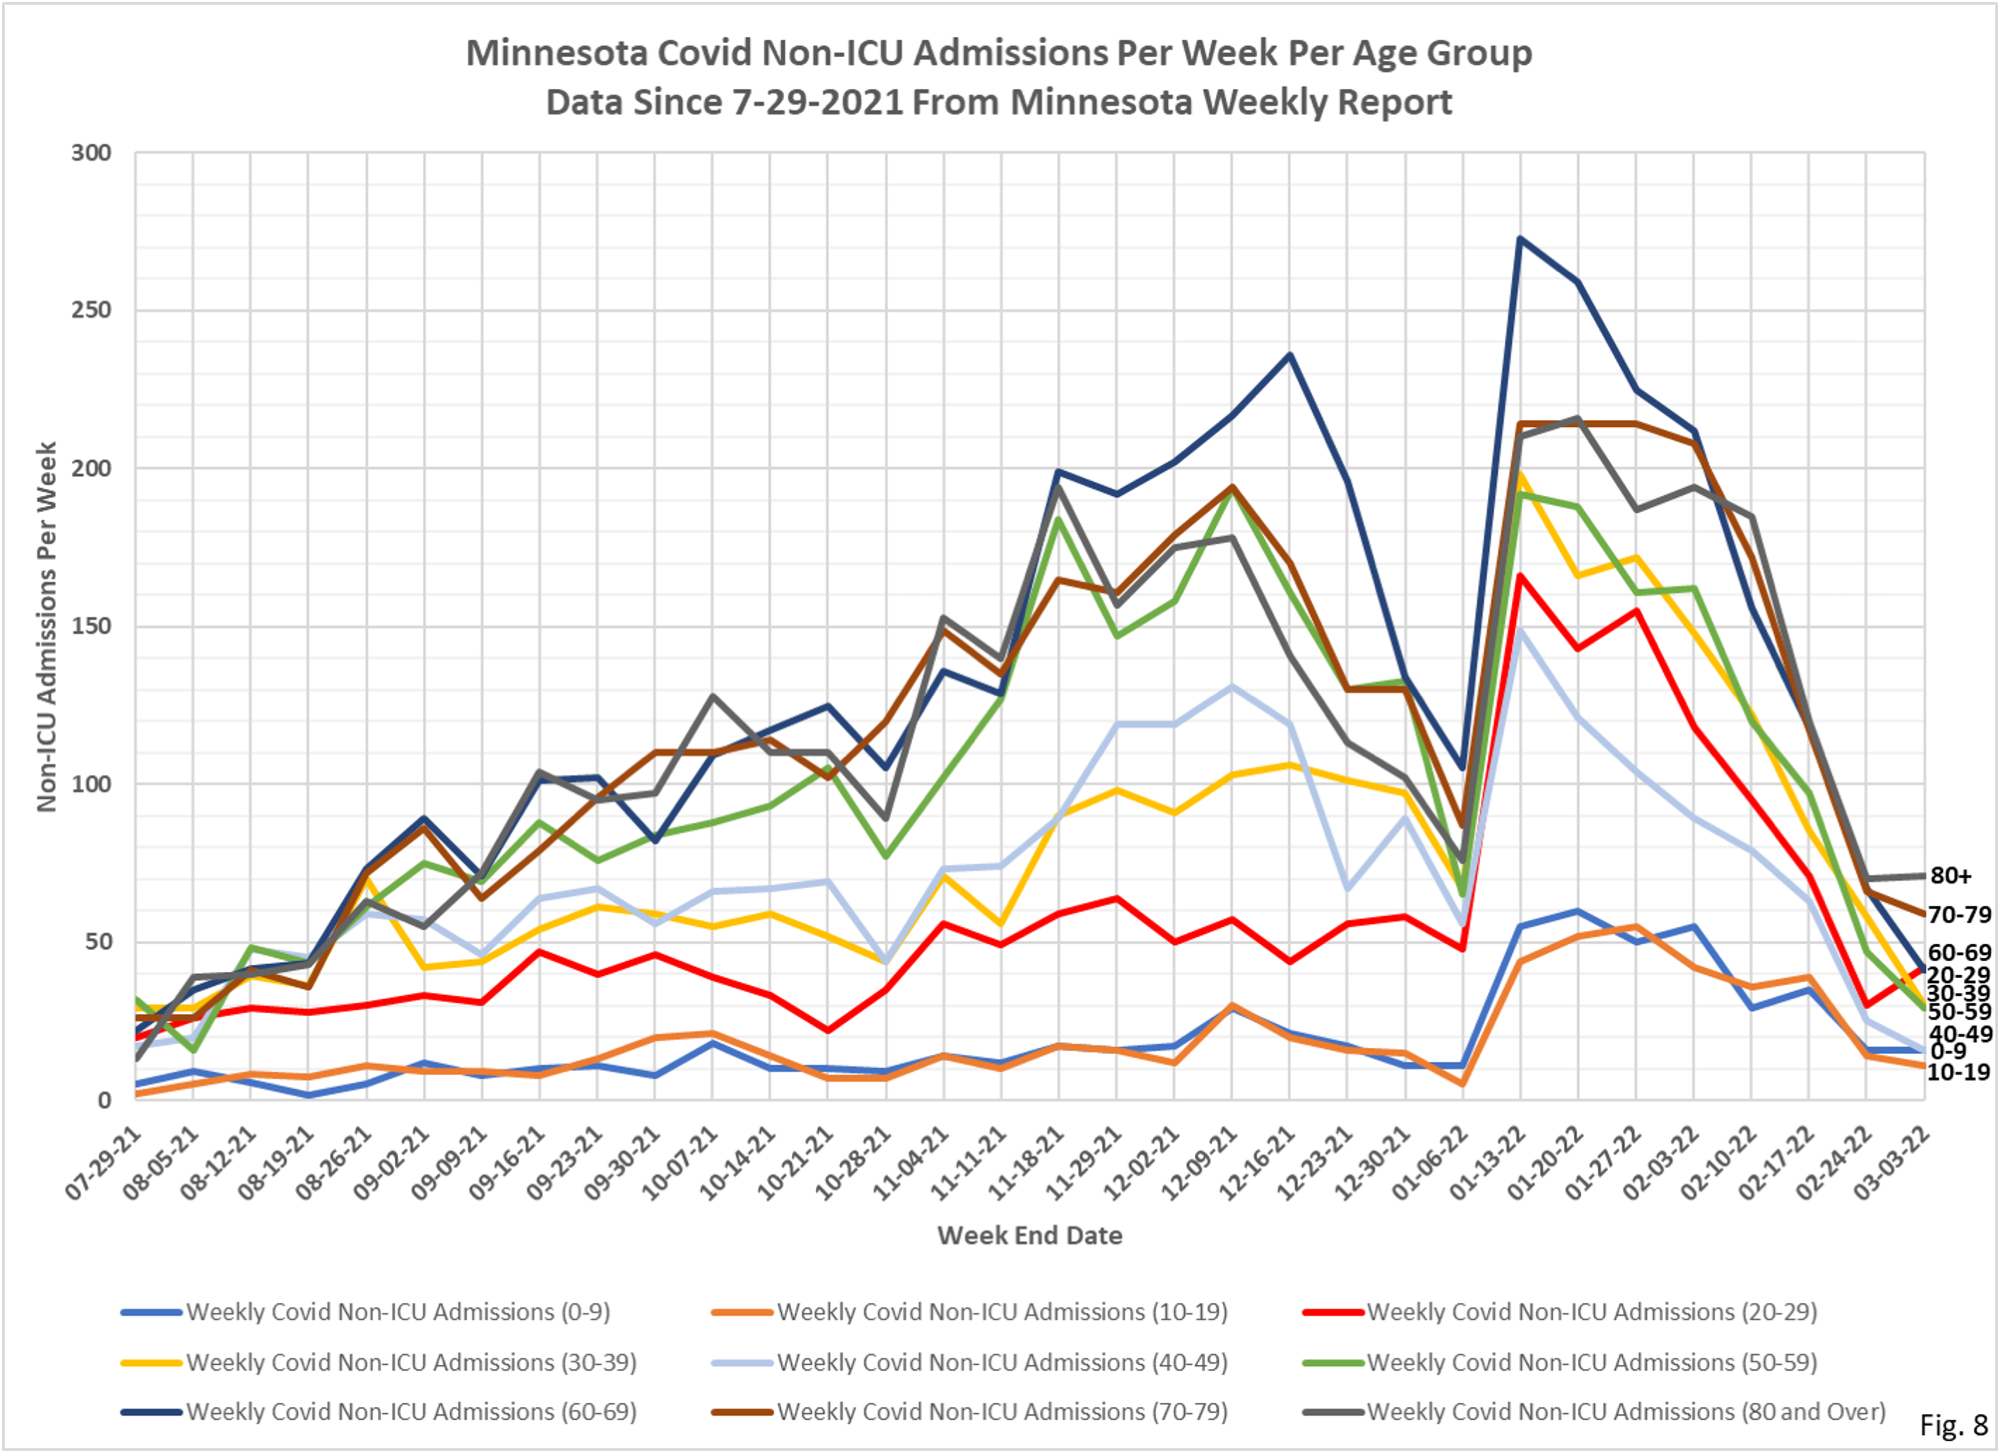
7. Fig. 7 and 8: Non-ICU Covid Admissions Per Week. Reported Non-ICU Covid admissions were generally lower this week in every age group except the 20-29 age group. Total Reported Non-ICU Covid admissions for the week were 315, a decrease of 78 admissions from the prior week’s total of 393. 315 Non-ICU admissions were the lowest since the 285 Non-ICU admissions reported for the week ending 8/19/2021.
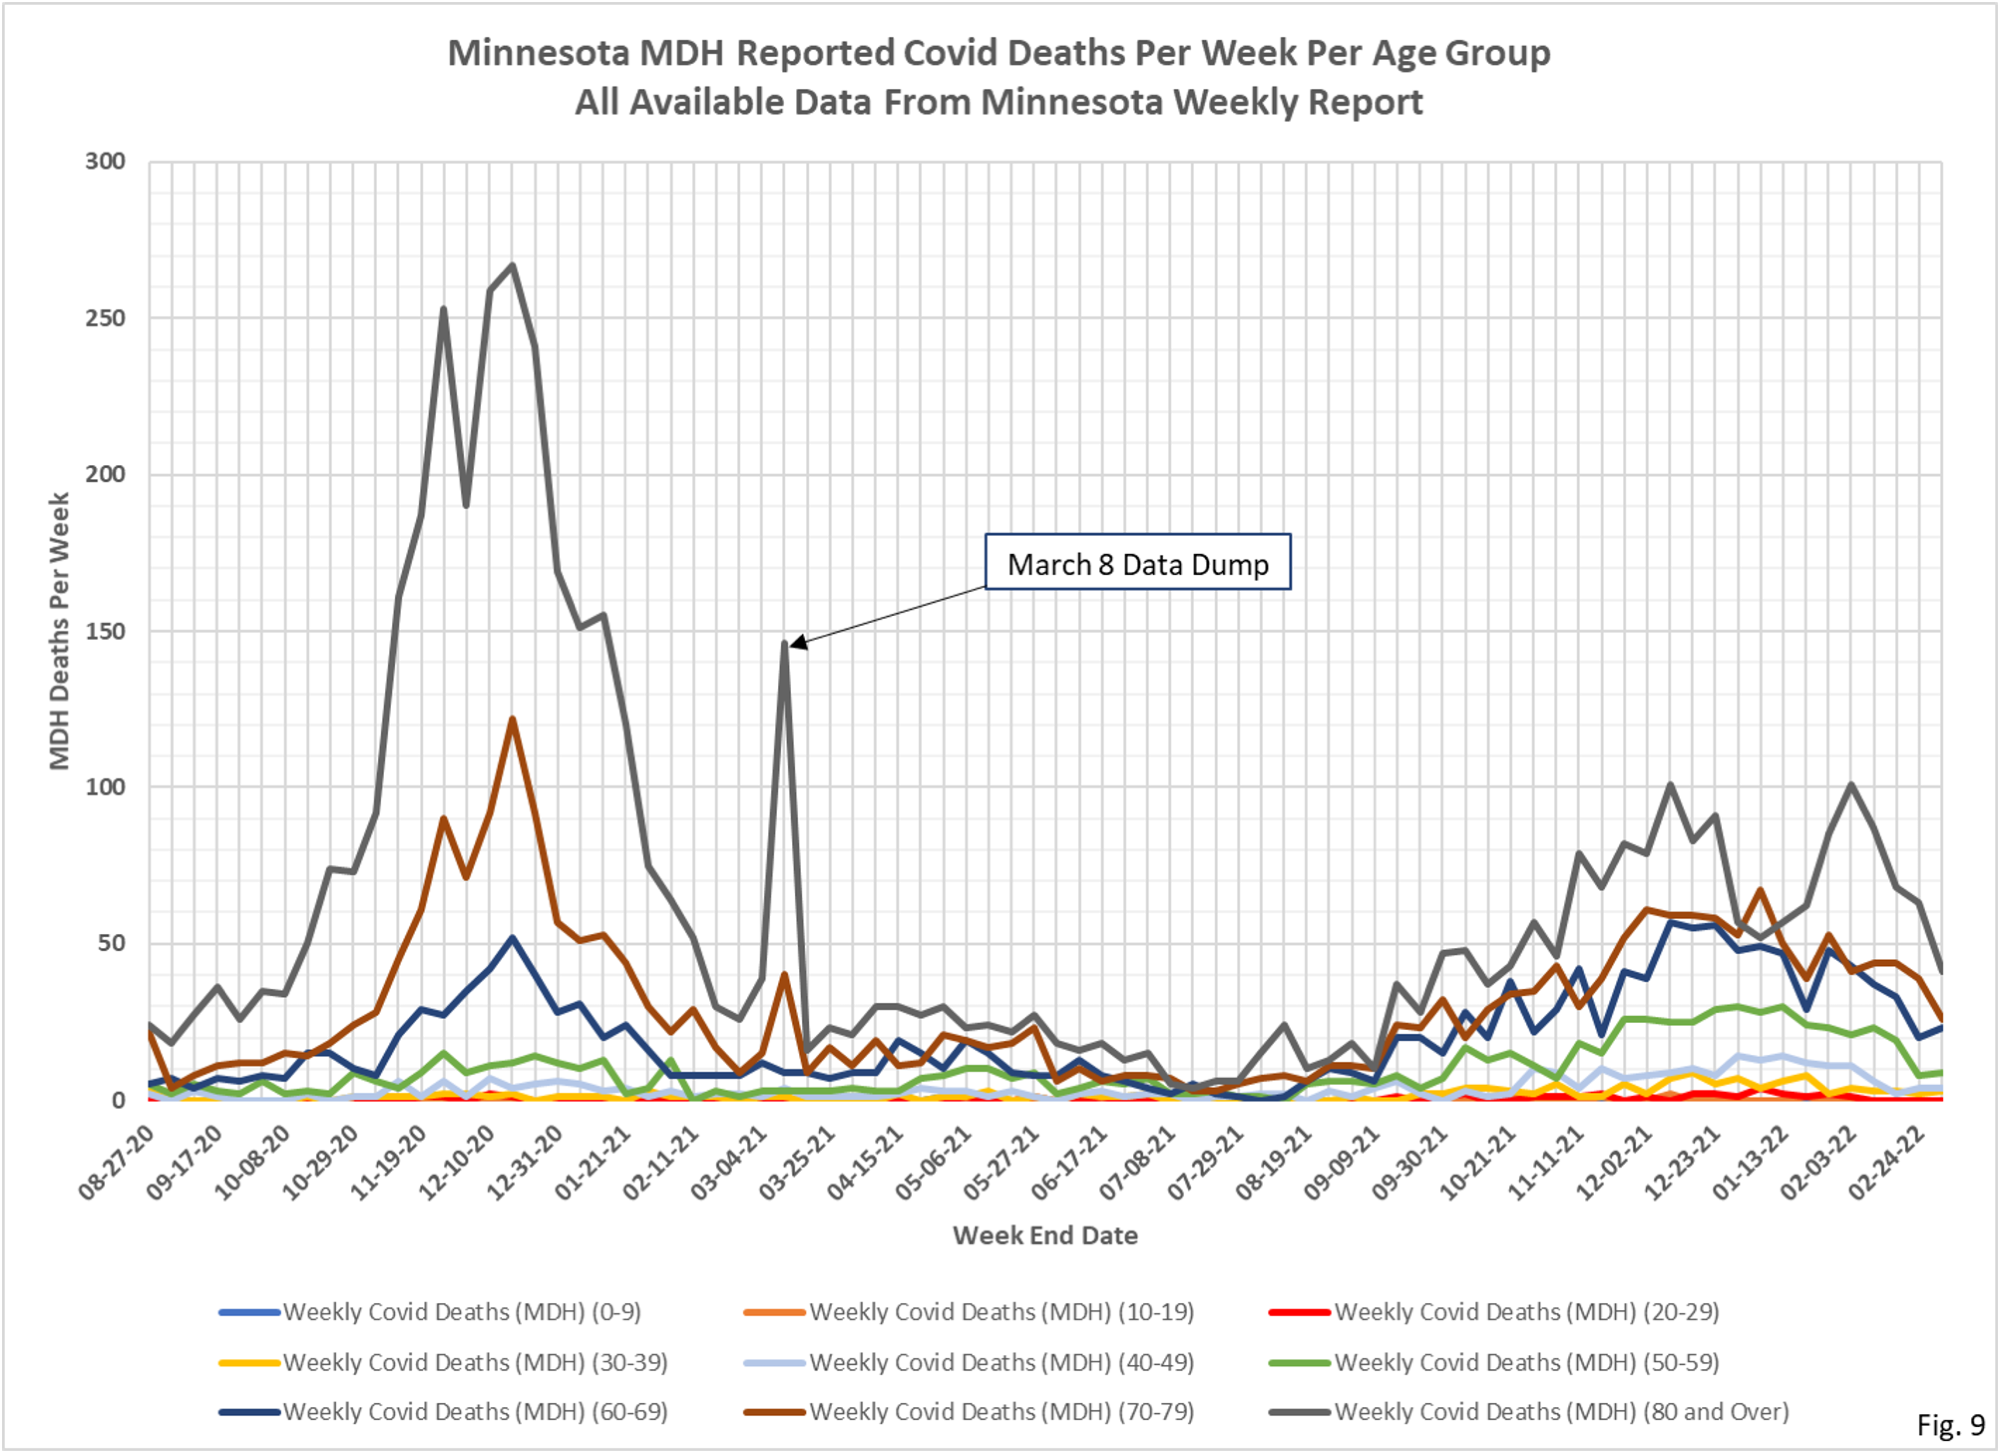
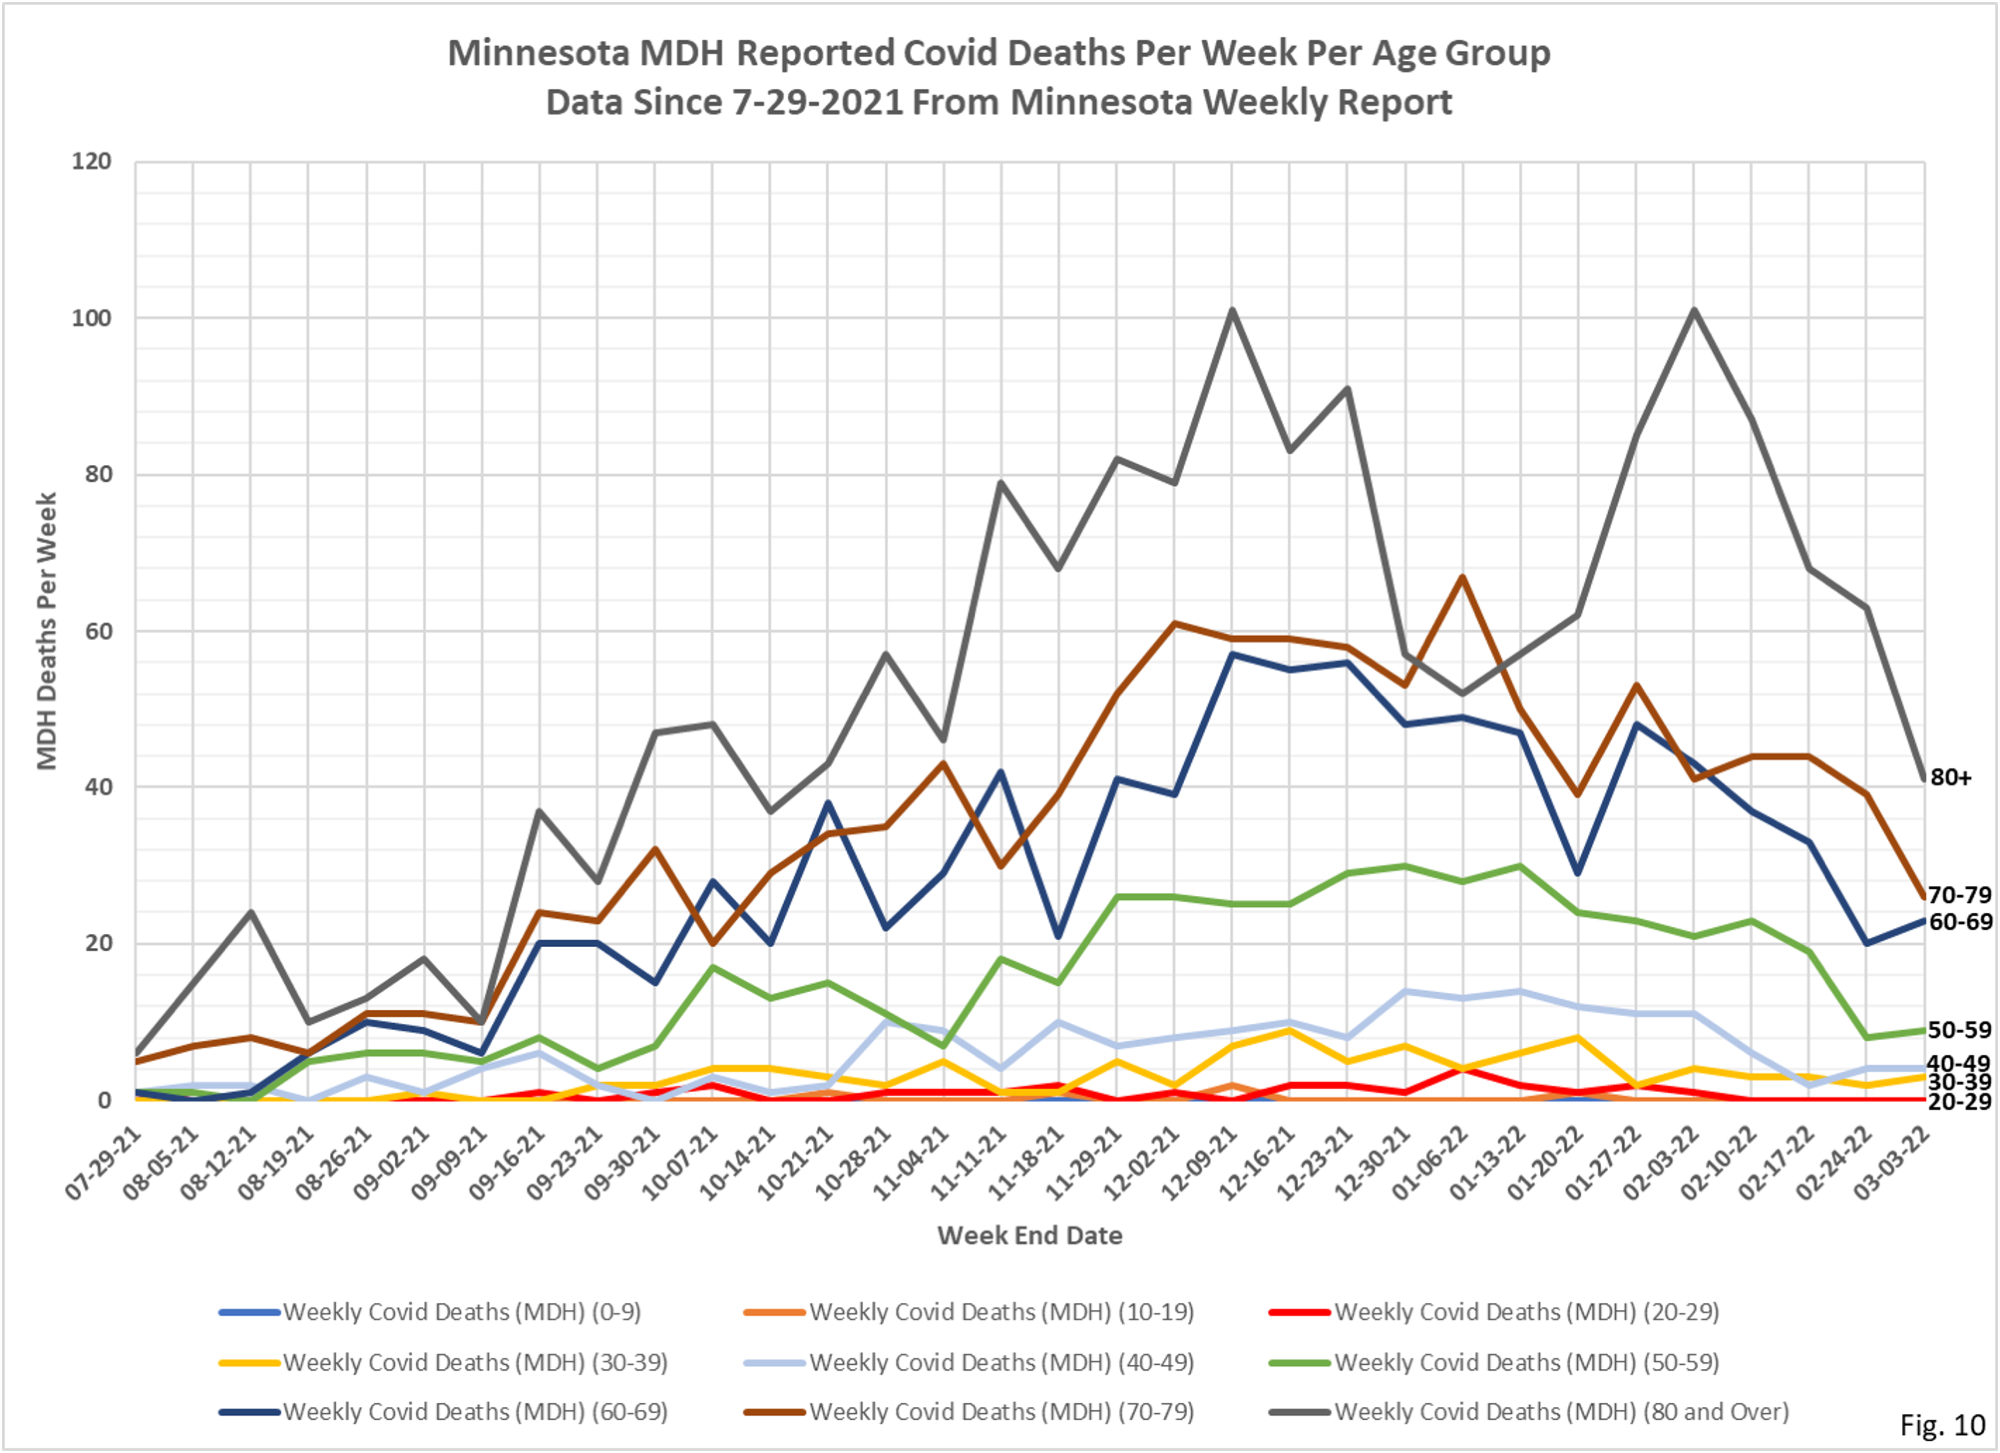
8. Fig. 9 and 10: Covid Deaths Per Week. Total reported Covid deaths for the week were 106 a decrease of 30 from the 136 reported deaths the week before.

Everywhere I go I keep seeing lots of people in their 20s still wearing masks. I don’t get it. Maybe a fashion statement or covering some facial deformity. I was all set to do jury duty but bailed out when I discovered they still require masks in the courthouse. I can wear one for 15 minutes if I have to but all day long for 2 weeks isn’t going to happen.
https://www.cdc.gov/csels/dls/locs/2021/07-21-2021-lab-alert-Changes_CDC_RT-PCR_SARS-CoV-2_Testing_1.html
What ‘test’ is being used to generate the ‘testing’ data? Are you mixing data from multiple test methods on the time frame of the graphs? If it’s still PCR, have the cycle counts changed throughout your data set? Is the data made up of different cycle counts?
The 20-somethings still wearing masks will end up running for public offices in their 40’s because they can’t fit in anywhere in a real world. Their goal, like the current batch of morons will be to change the world so they ‘feel’ like they fit. I wish we had another relatively empty continent like Australia was 100 years ago. I could come up with the 19 Crimes that got you invited … #20 would be meaningless mask wearing.