Dave’s notes pretty much paint the picture. The vaxed are responsible for most events, although per capita rates may still be lower for some events in some age groups. Dave has separately told me that DOH made some major revisions to its per capita rates, which are bogus to begin with, reducing rates among the unvaxed, which had to happen given their absurd comparisons. And we strongly suspect they are still delayed in processing breakthru events so past weeks will rise. Dave’s notes:
- The table and charts are updated for new data released by Minnesota Department of Health (MDH) on 2/28/2022, adding data for the week starting 1/23/2022 and ending 1/29/2022. This time period starts well after the peak of the Omicron case surge in Minnesota, which occurred on 1/10/2022.
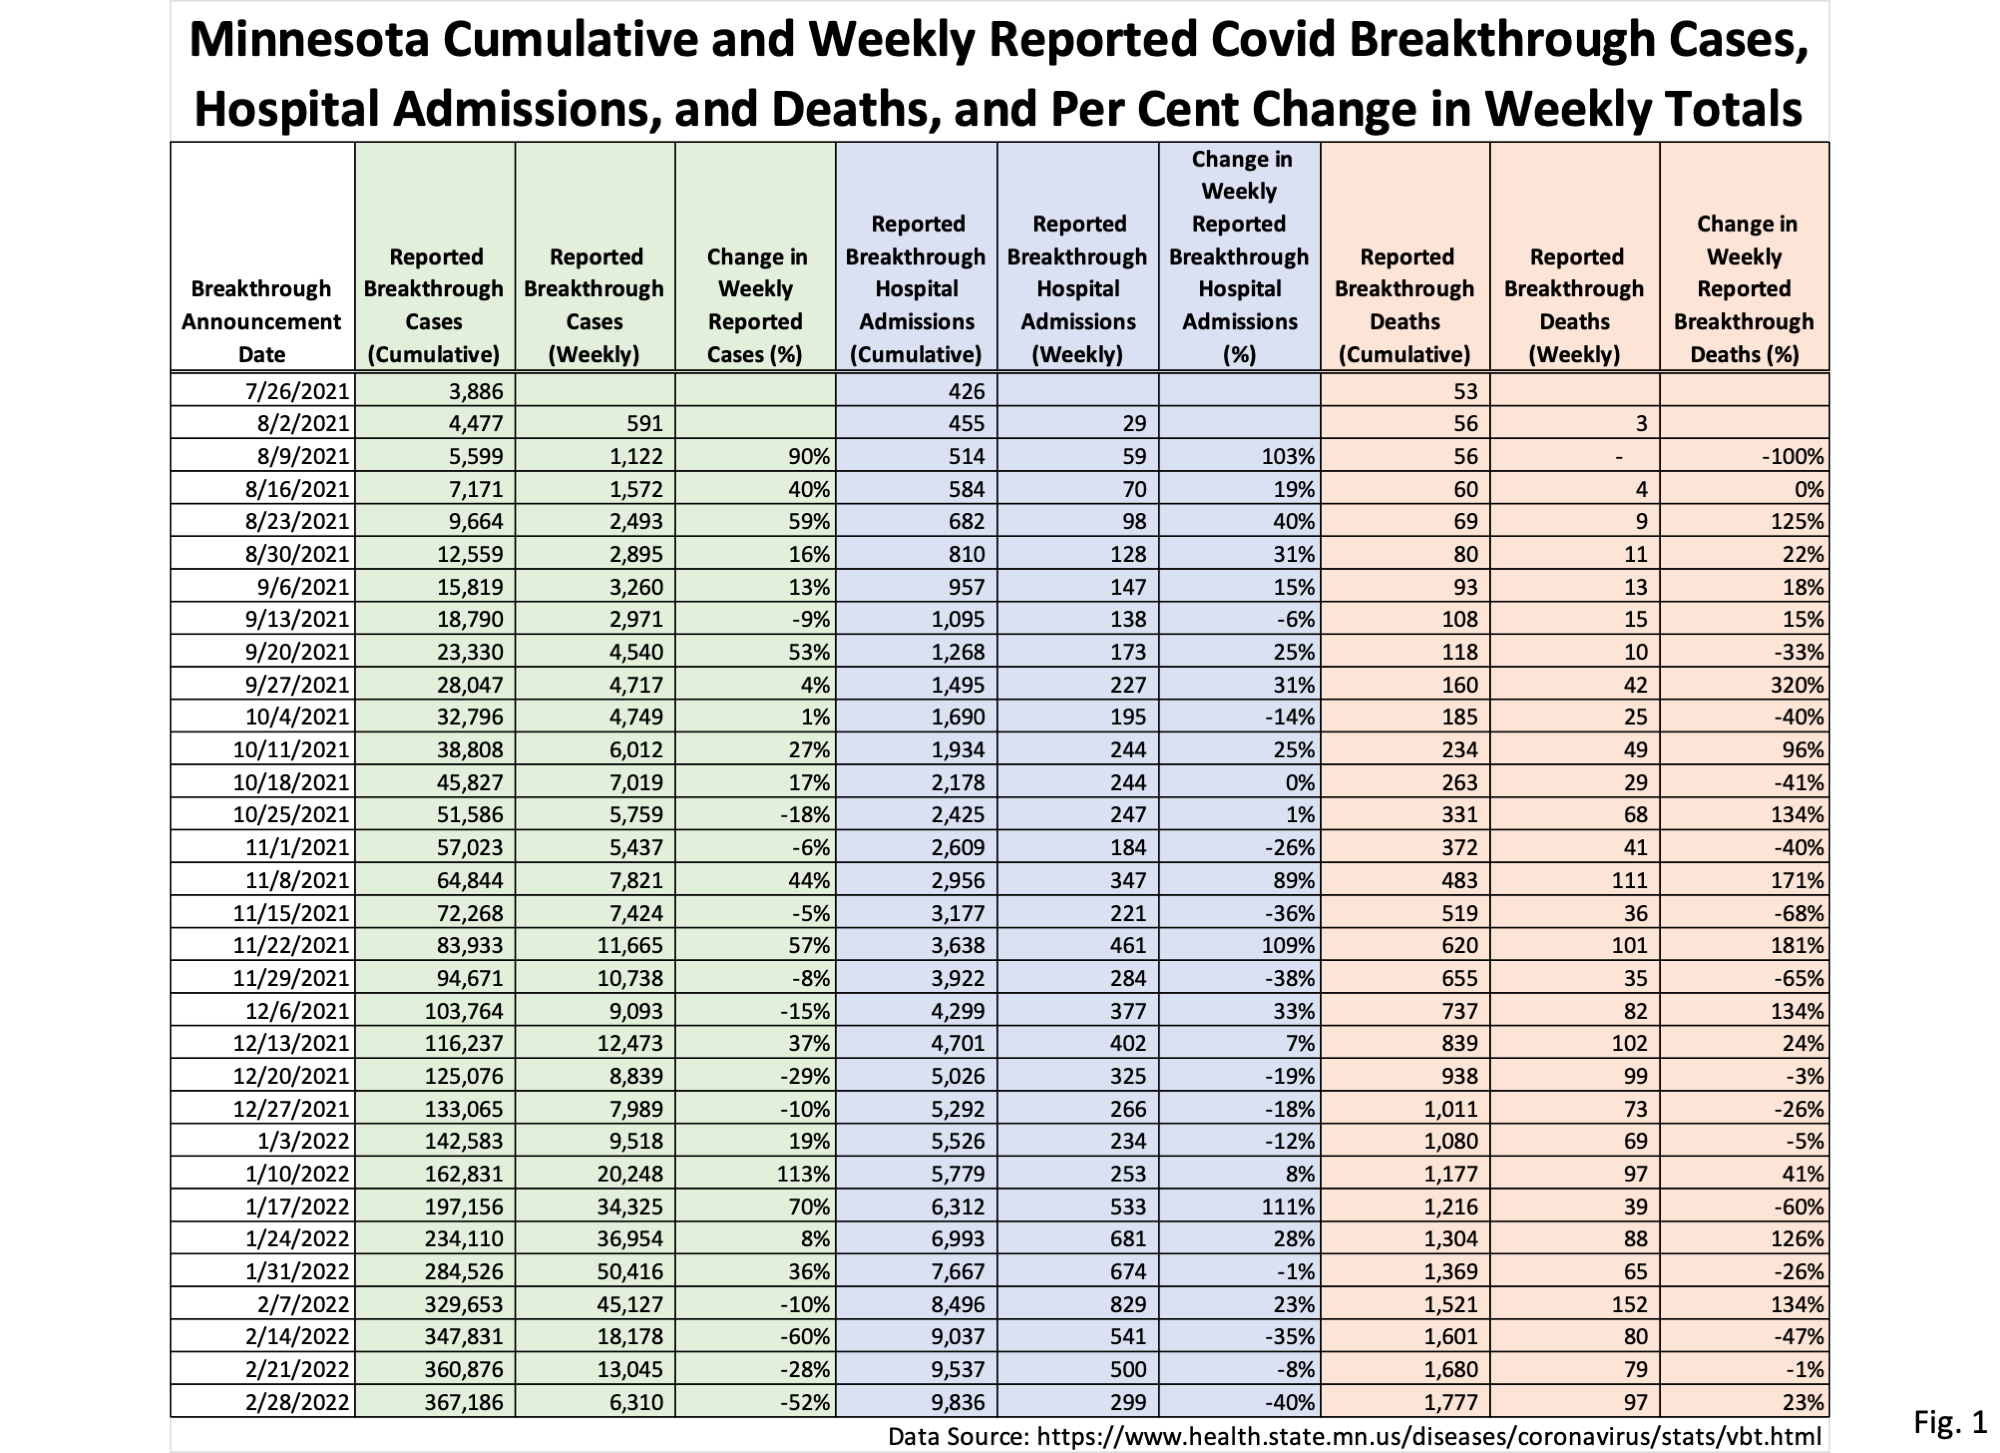
- The data source for the data on Fig. 1 is the cumulative breakthrough cases, hospitalizations, and deaths published on the MDH COVID-19 Vaccine Breakthrough Weekly Update https://www.health.state.mn.us/diseases/coronavirus/stats/vbt.html
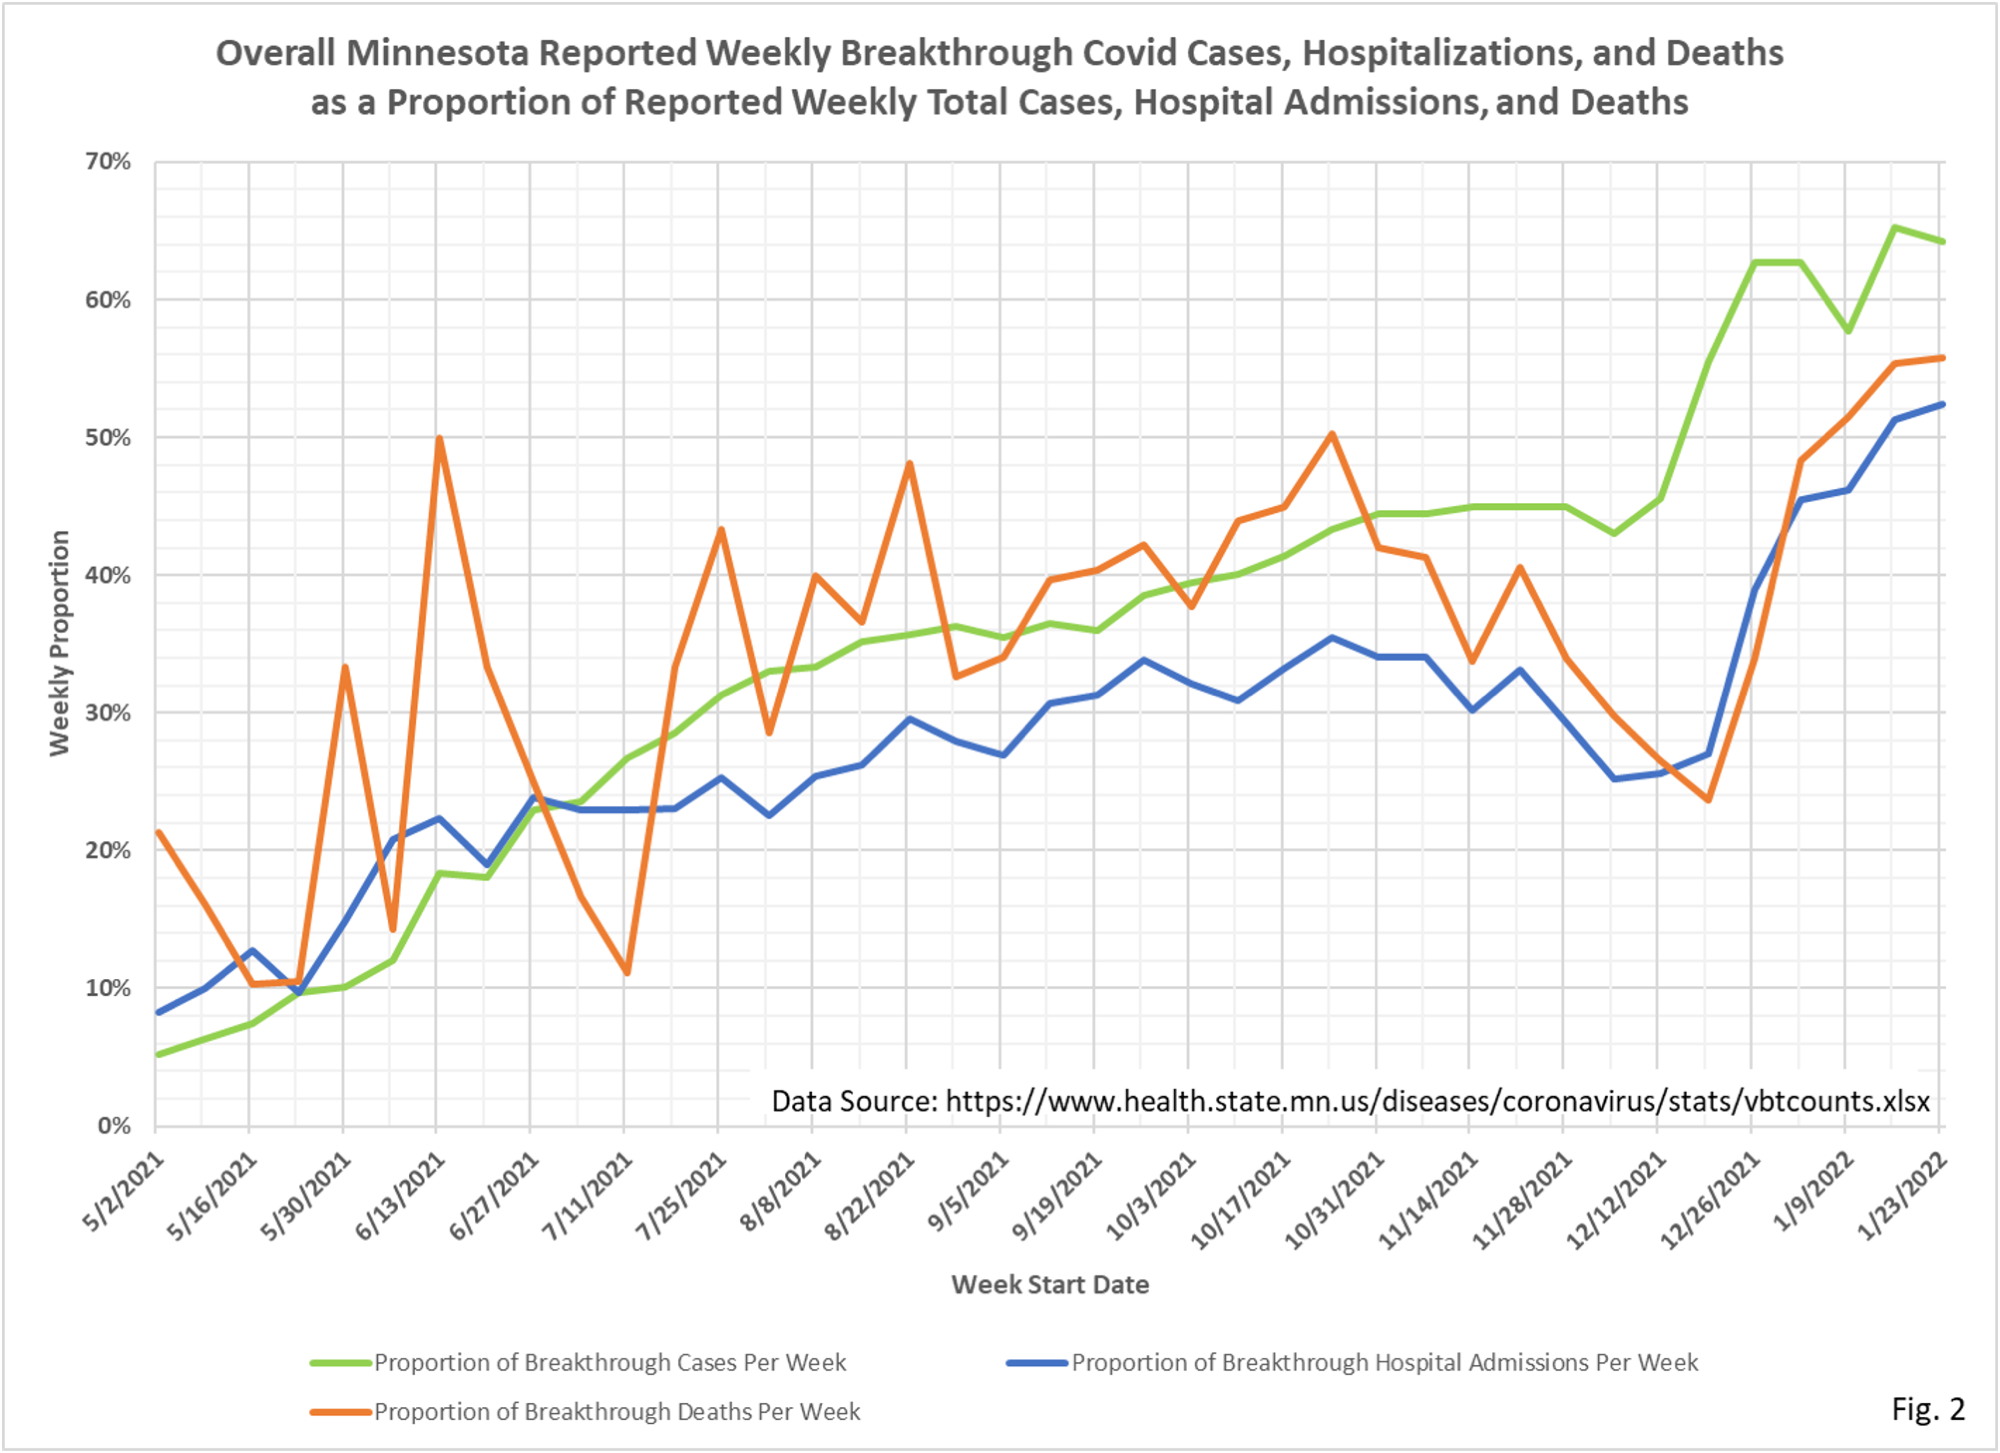
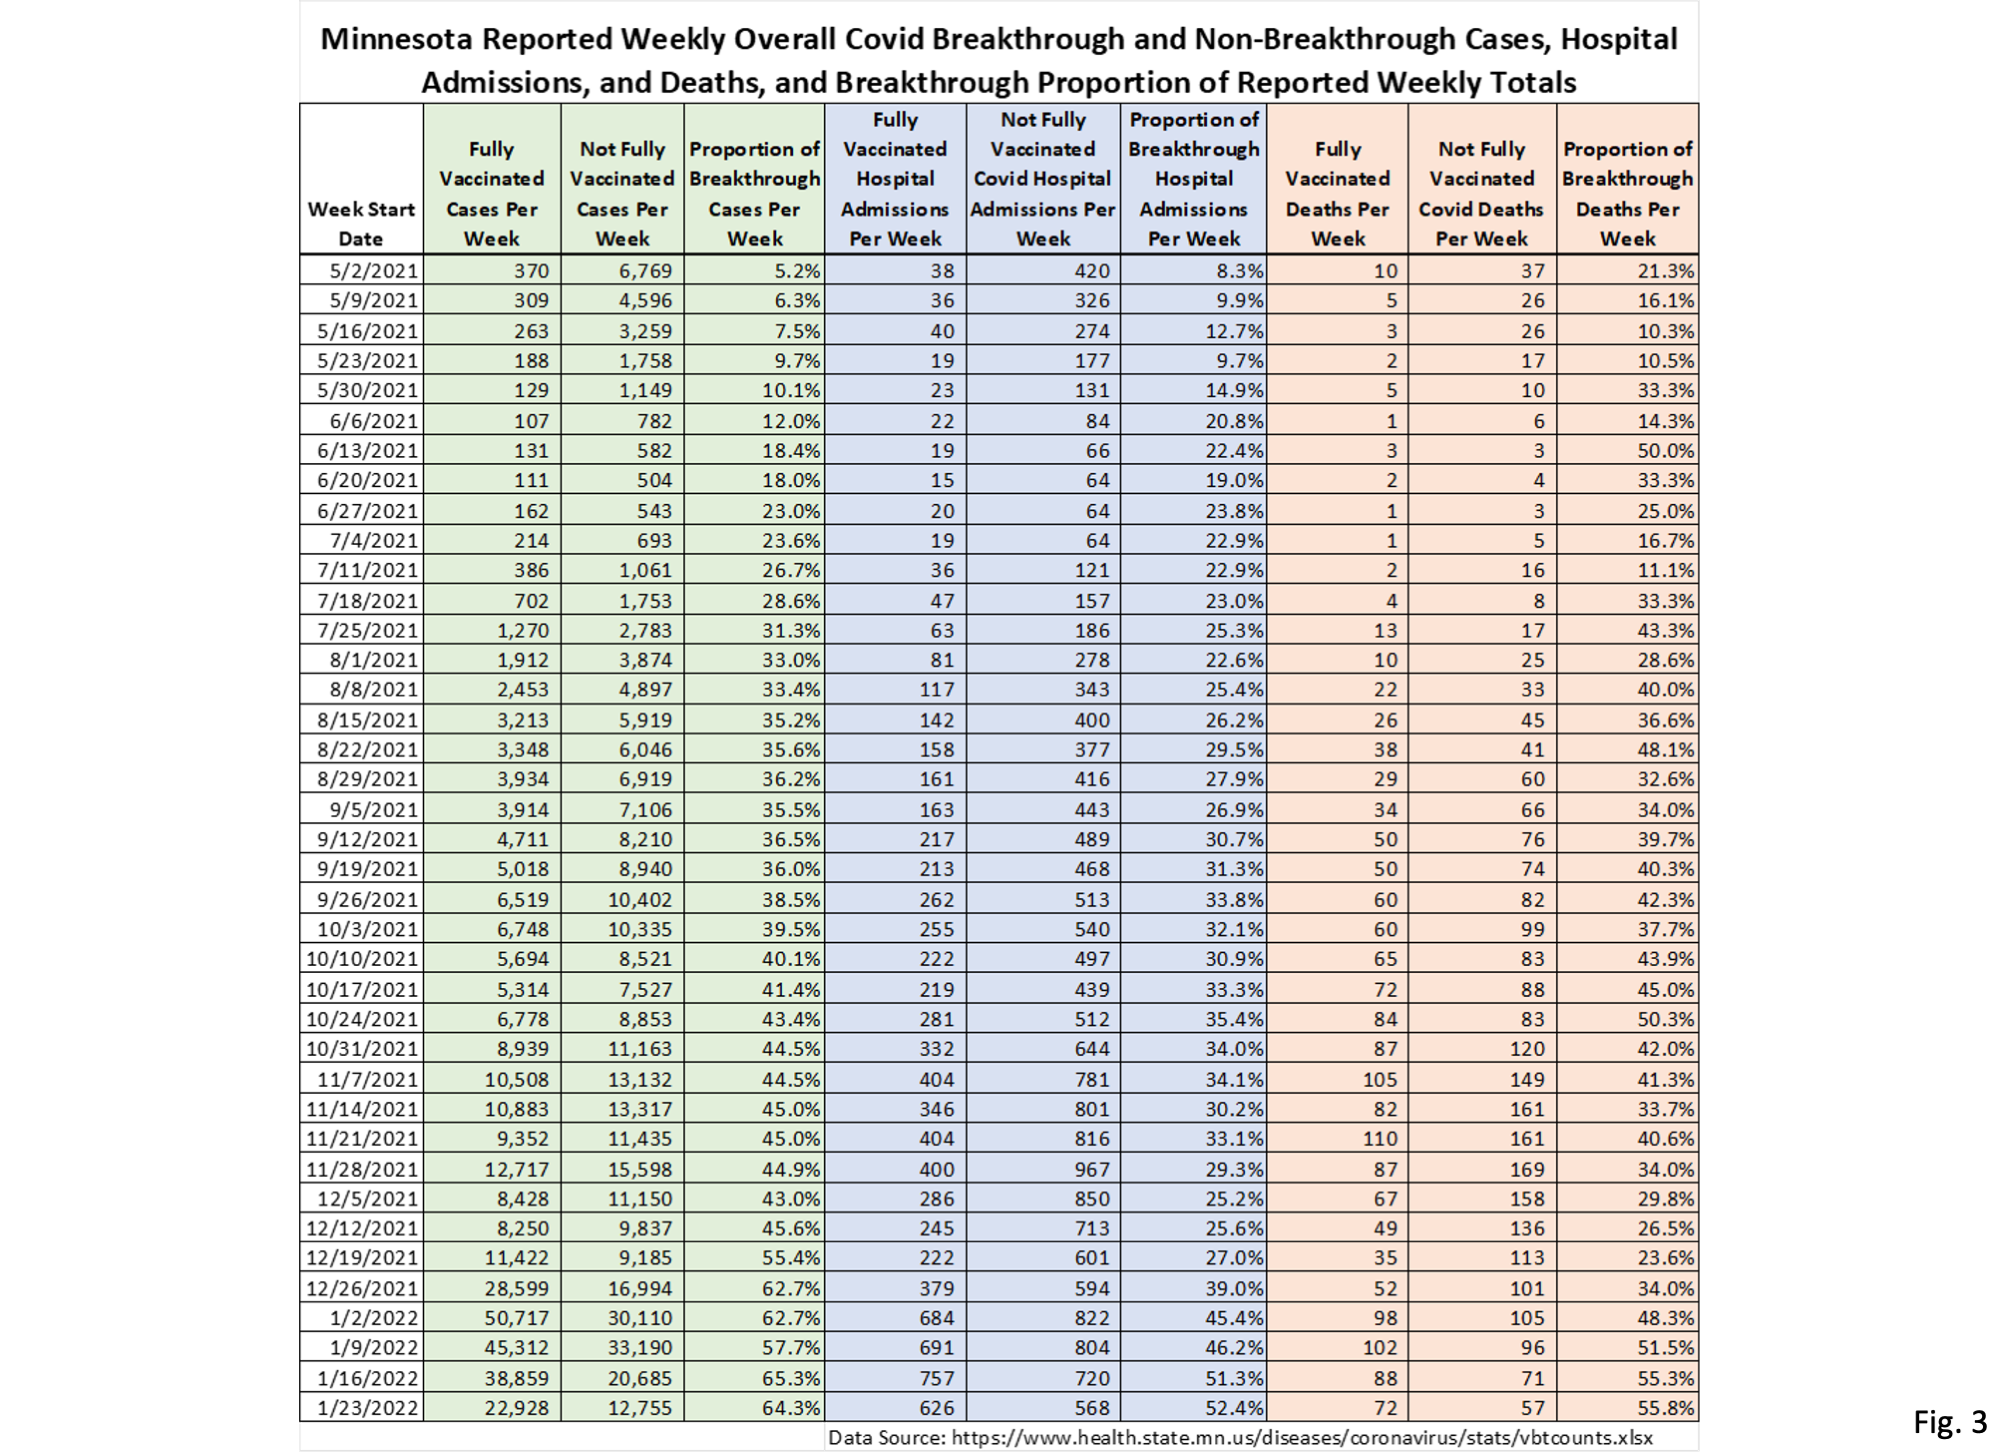
- The data source for Fig. 2 and Fig. 3 is the data file https://www.health.state.mn.us/diseases/coronavirus/stats/vbtcounts.xlsx found on MDH web page https://www.health.state.mn.us/diseases/coronavirus/stats/vbt.html. The data provided in the data file vbtcounts.xlsx is used without modification, other than to sum the weekly events and compute the breakthrough proportion. Vbtcounts.xlsx provides breakthrough and non-breakthrough cases, hospital admissions, and deaths for each week listed.
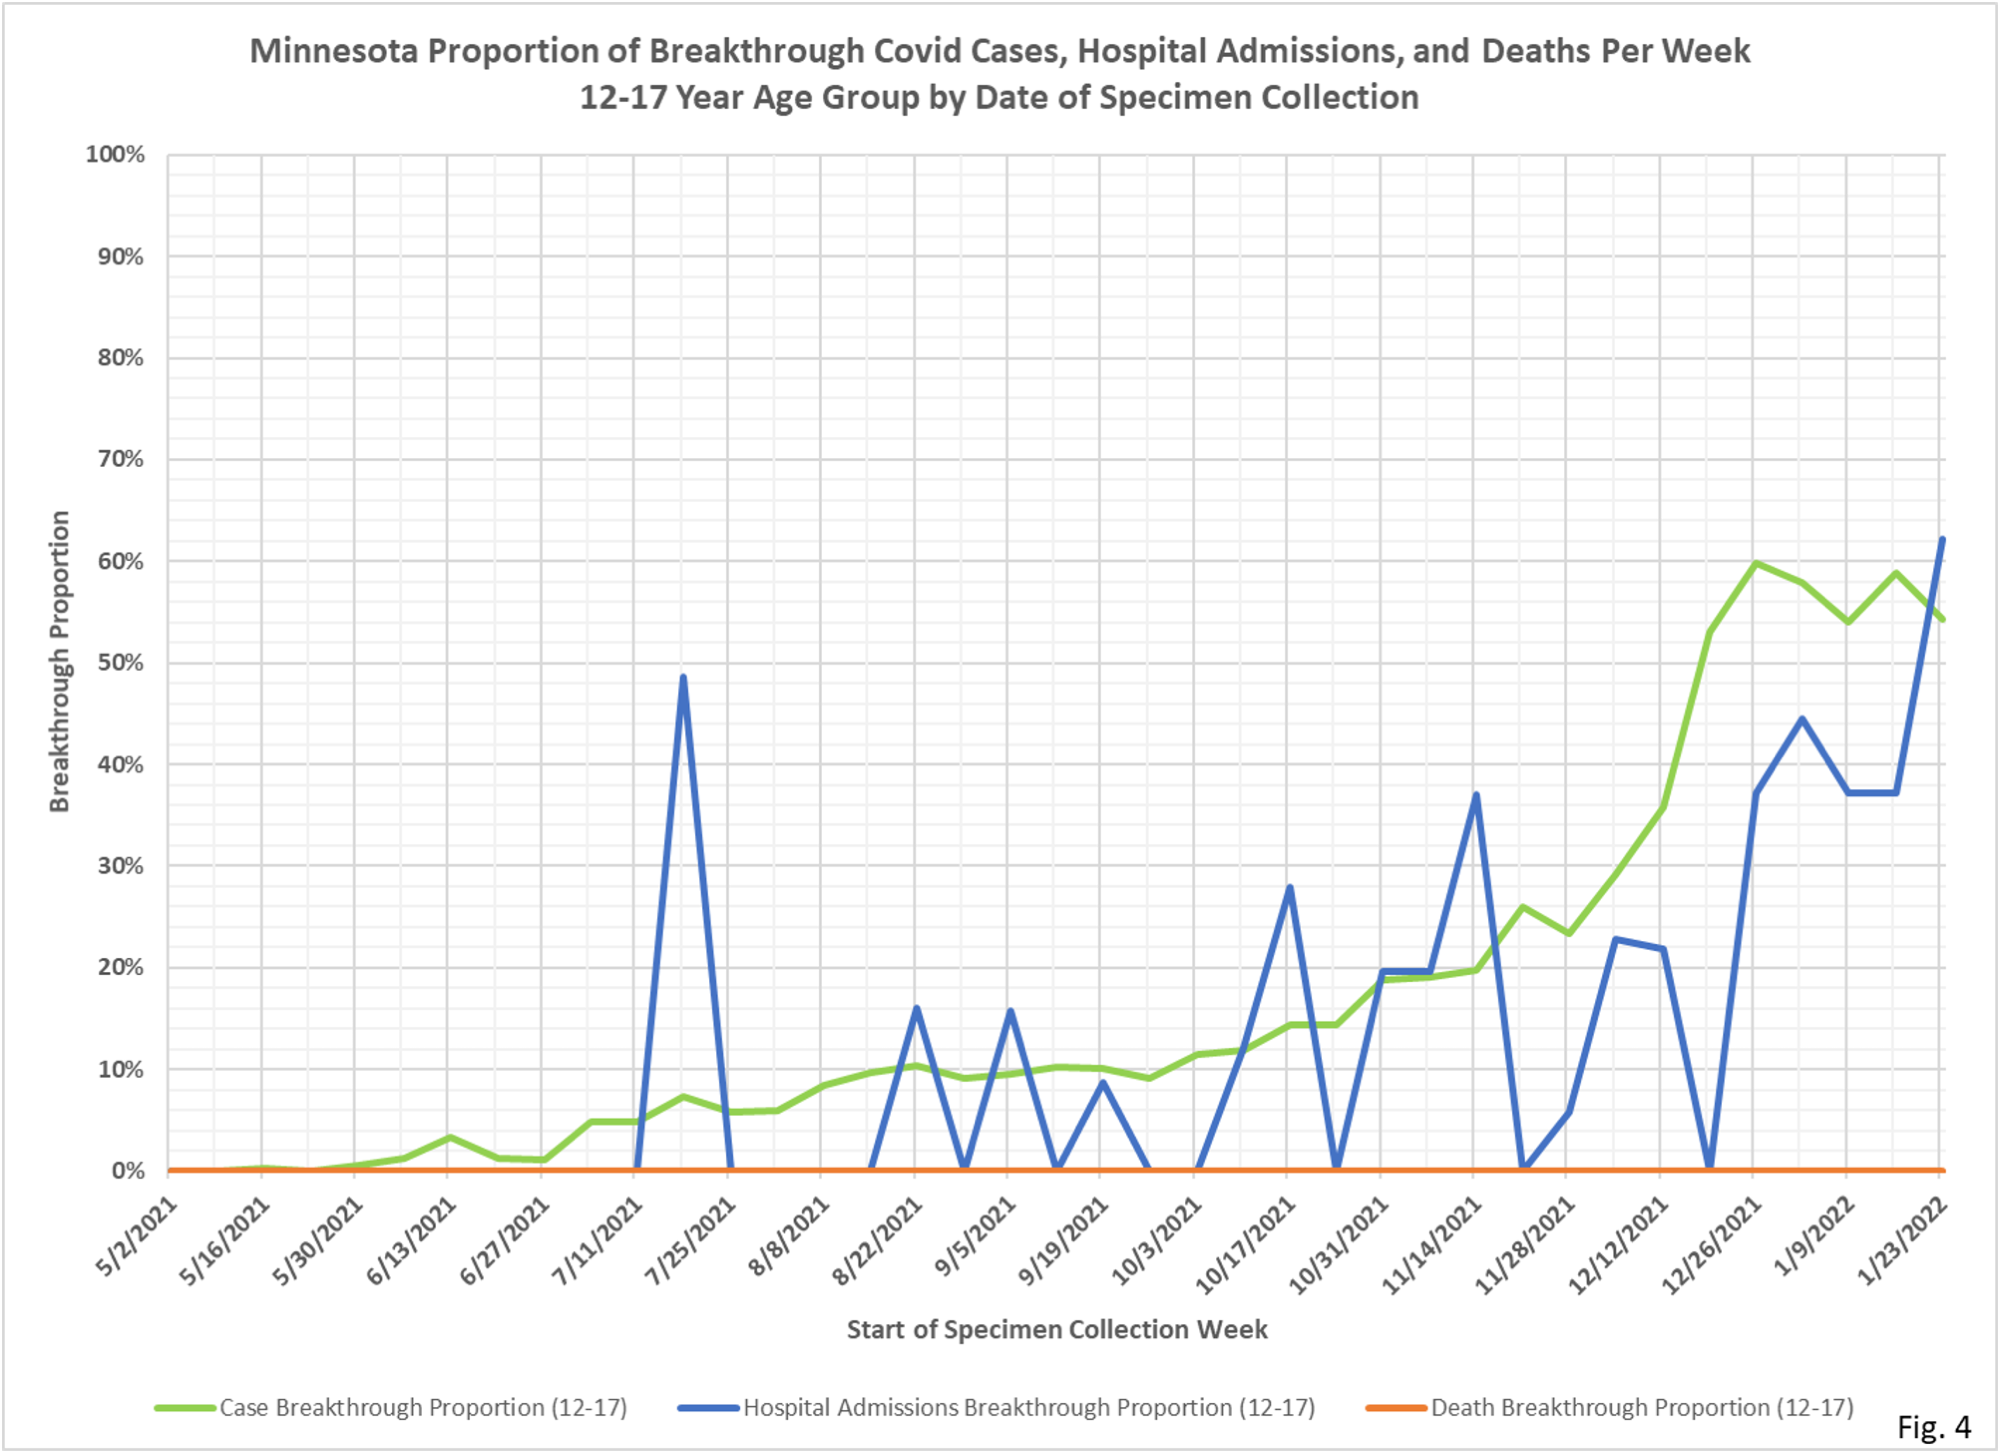
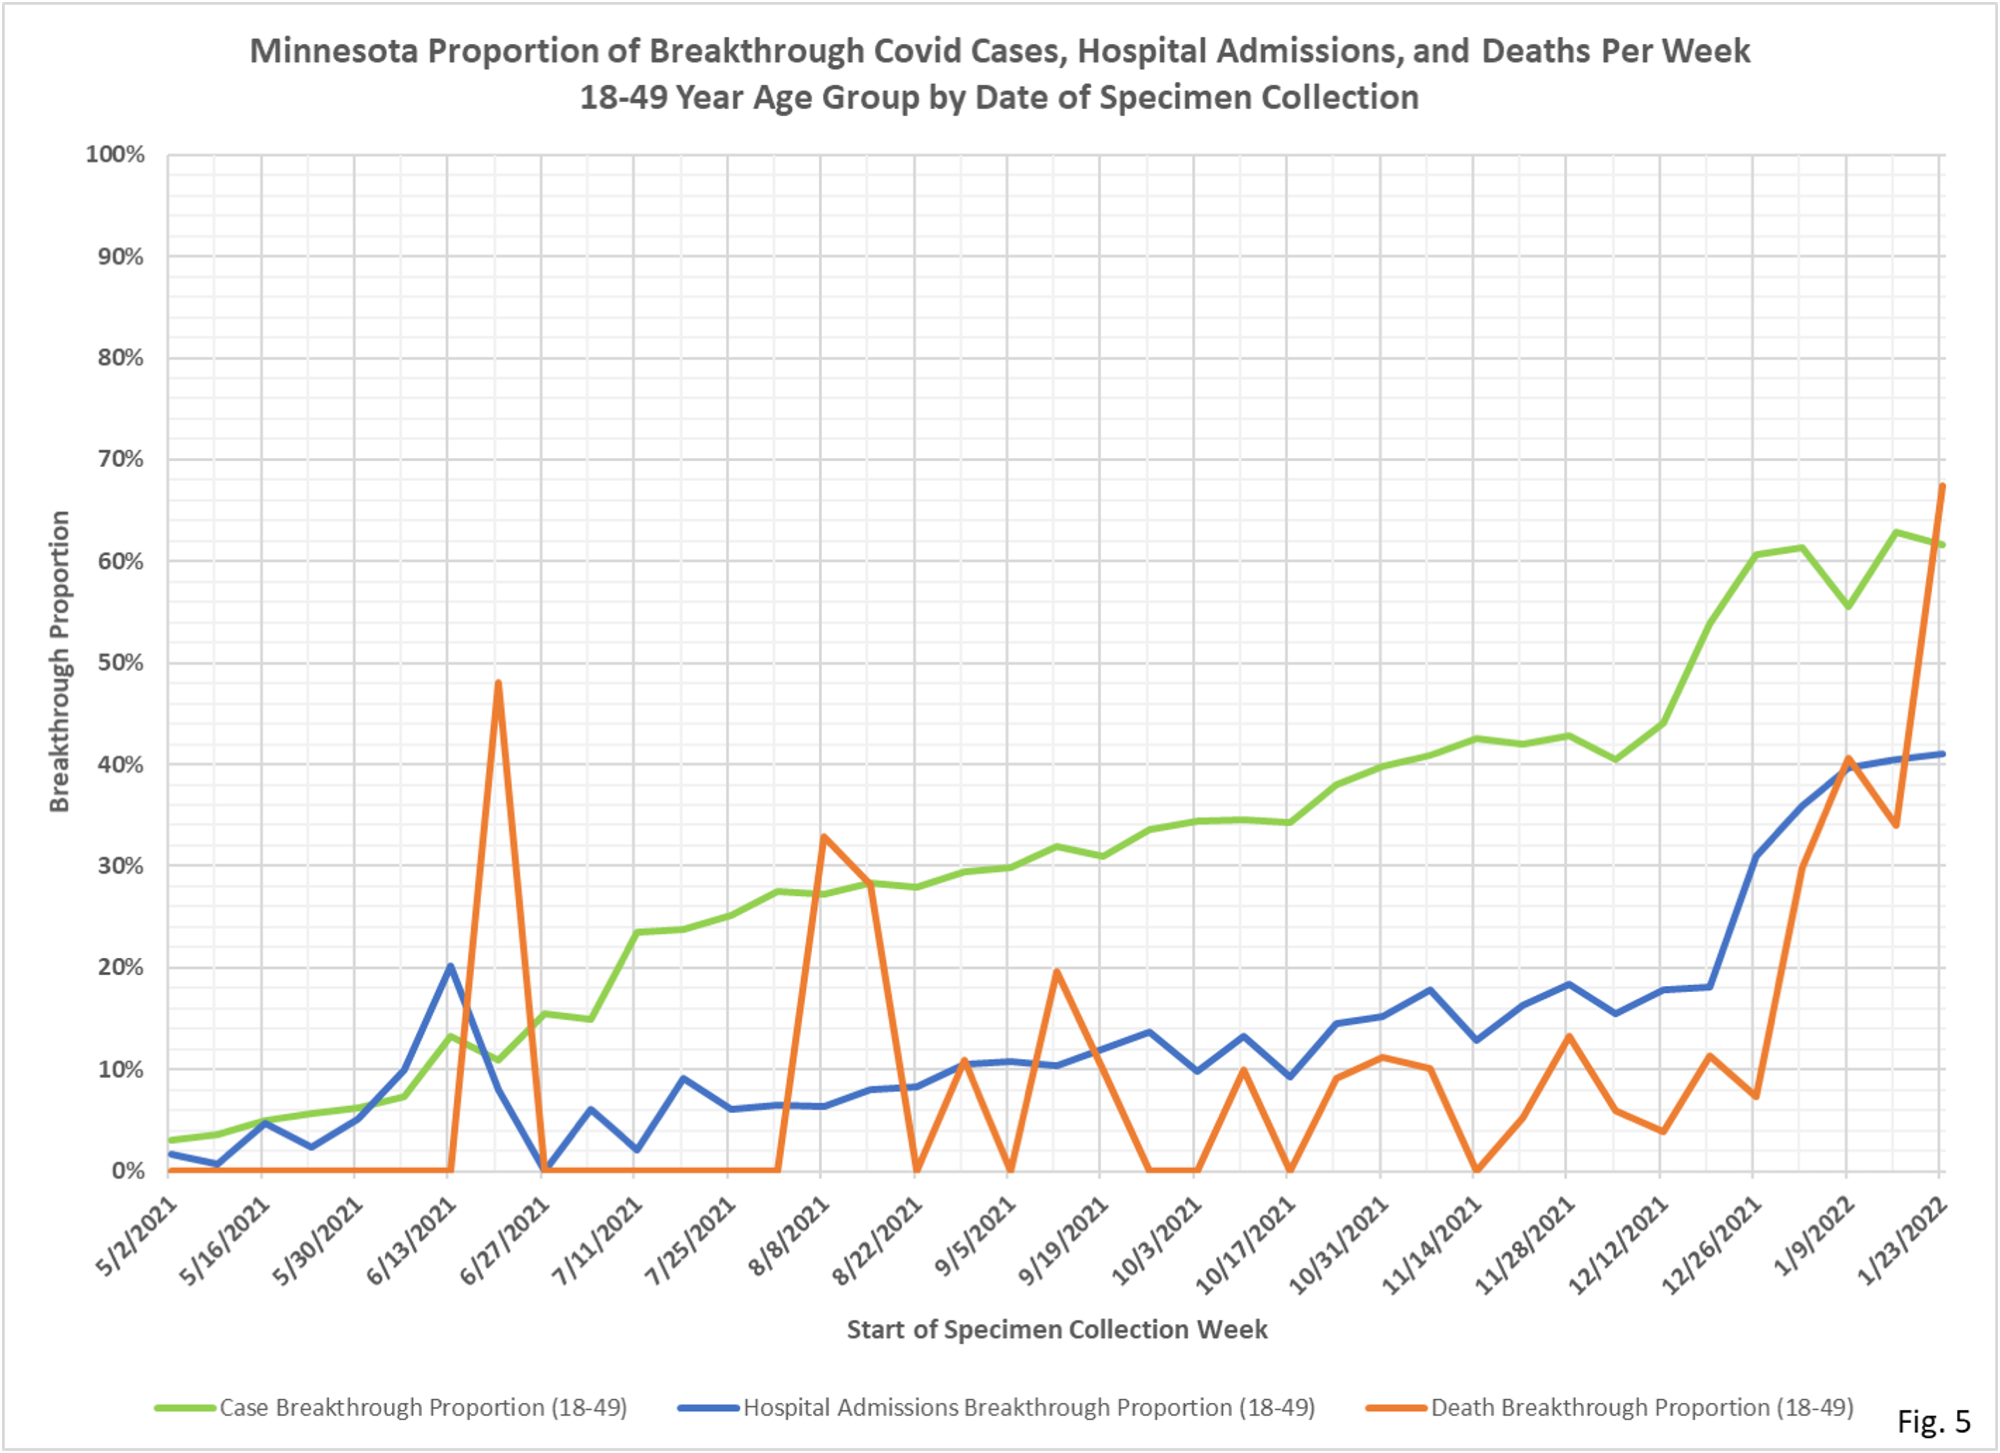
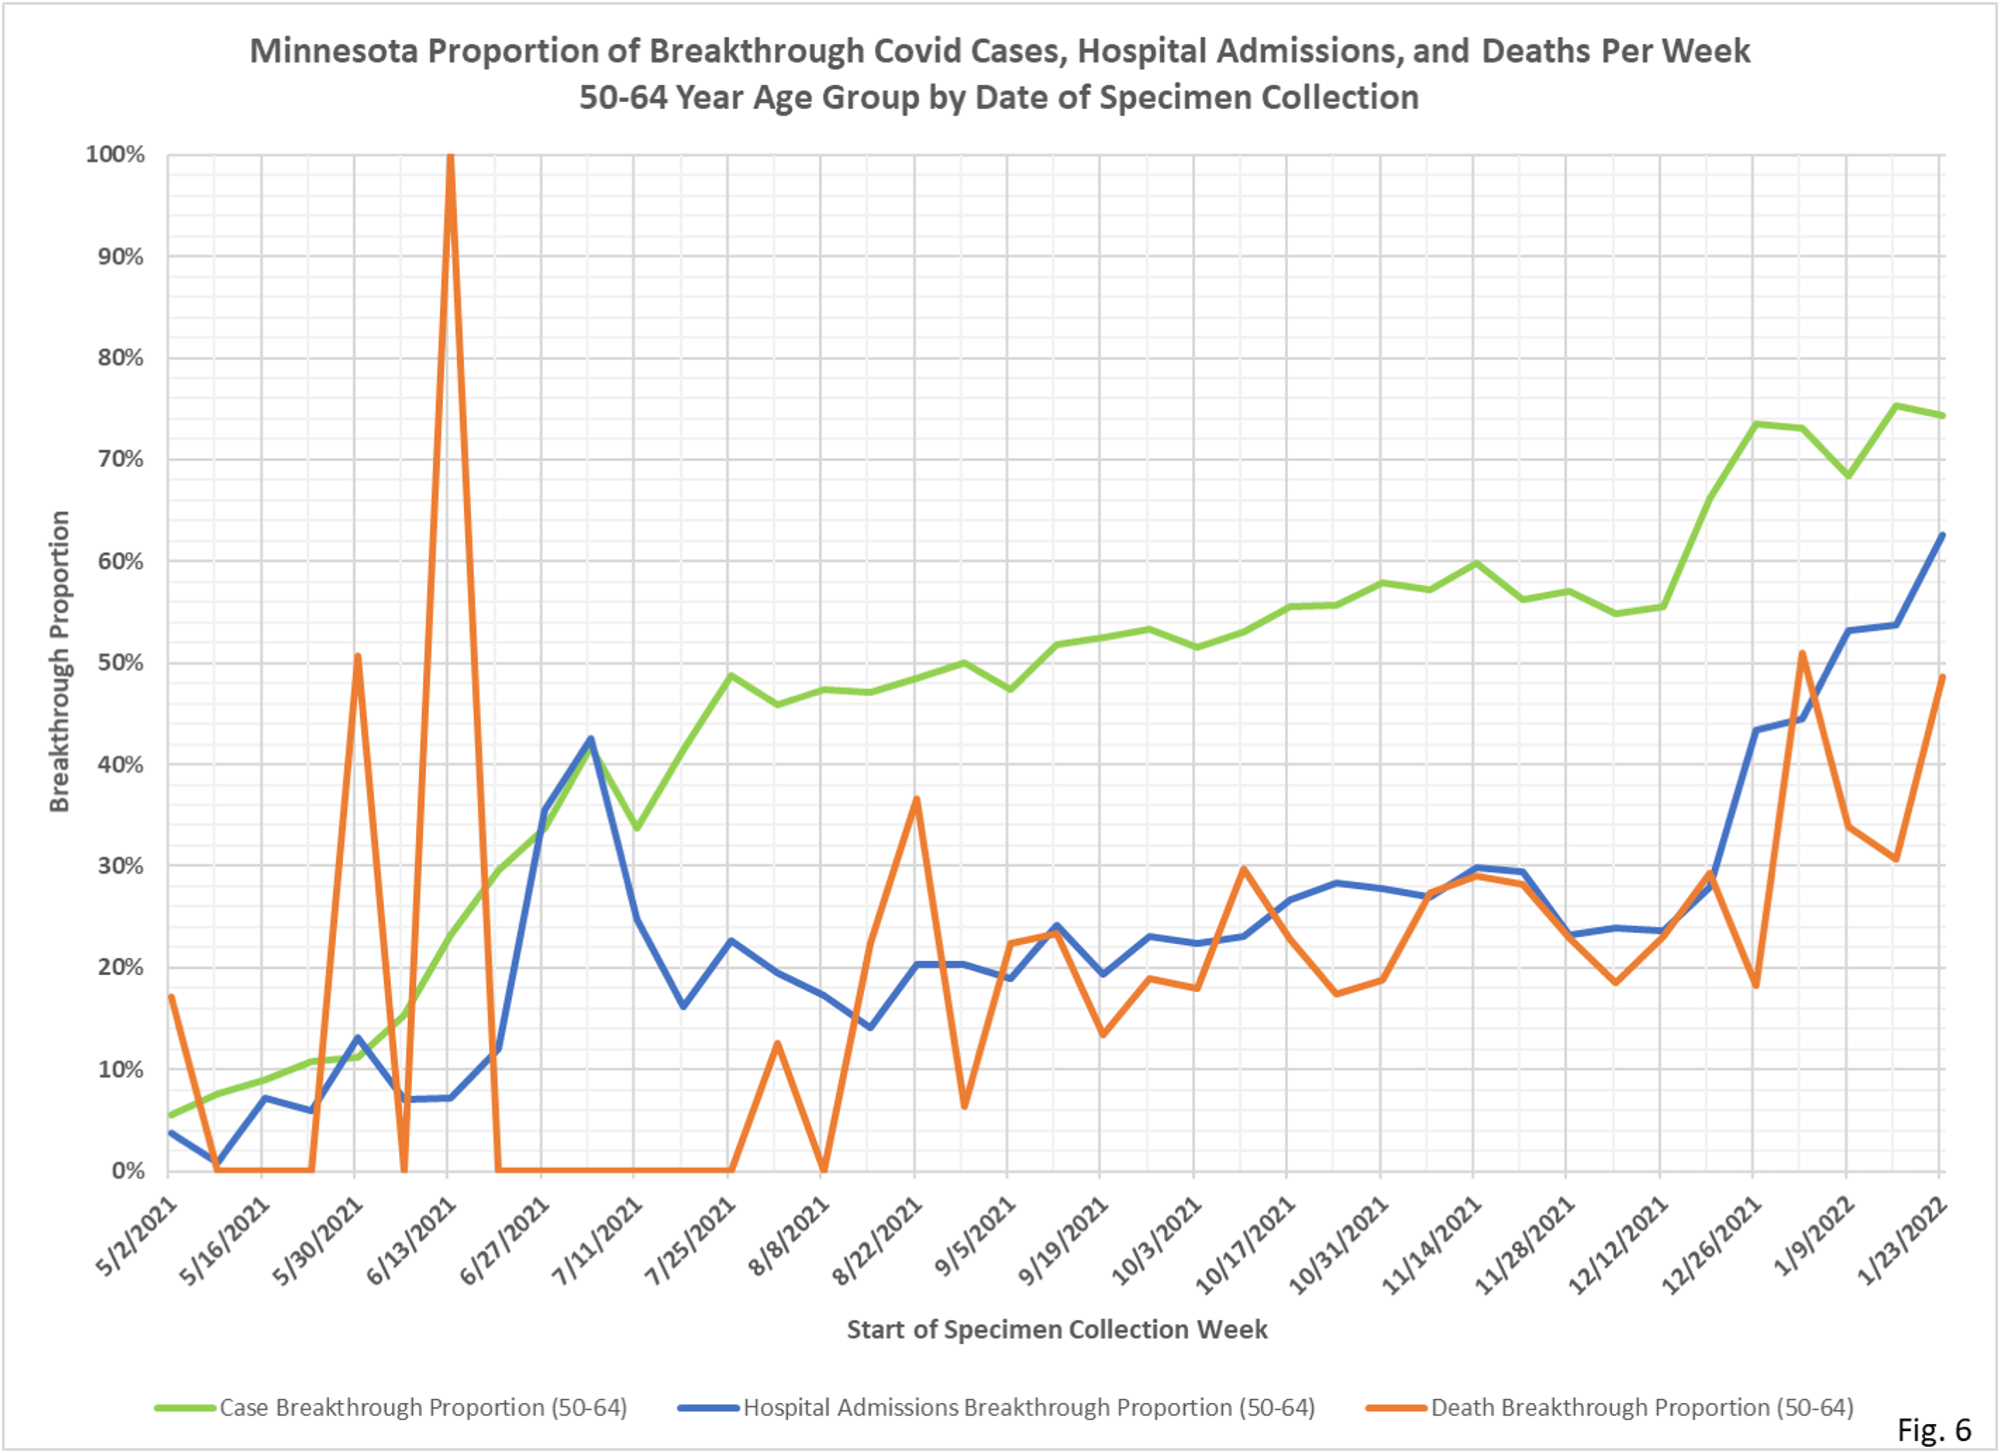
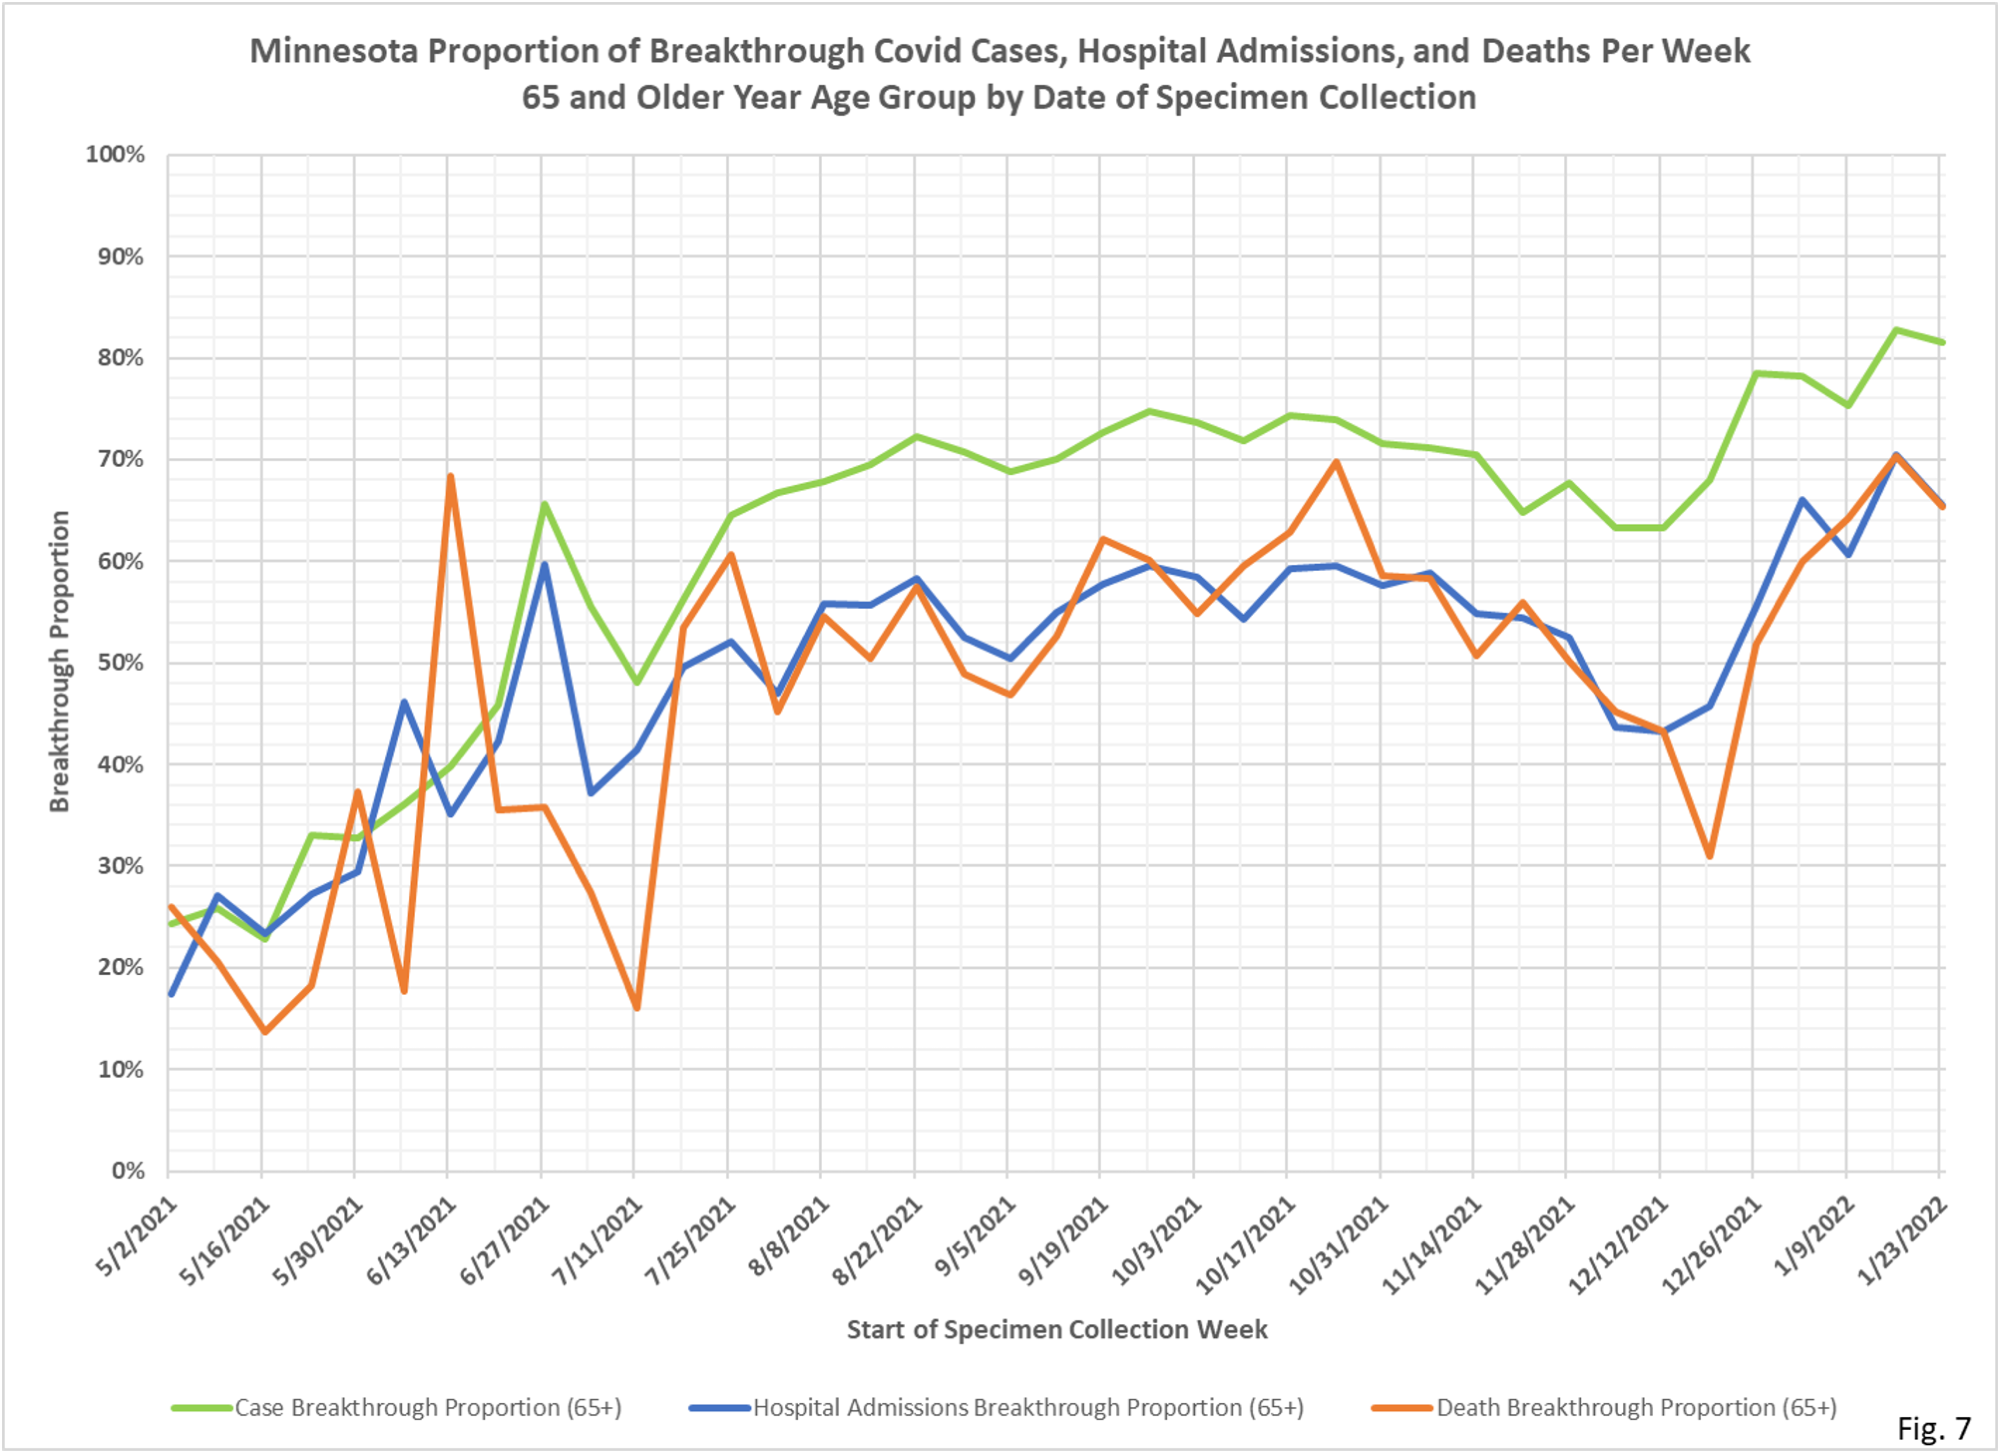
- The data source for the breakthrough proportions by age group (Fig. 4 through Fig. 7) is the data file vbtcirates.xlsx, found on the Minnesota Department of Health (MDH) web page: https://www.health.state.mn.us/diseases/coronavirus/stats/vbtcirates.xlsx . This data file gives the rates per 100k of cases, hospitalizations, and deaths in full vaccinated and not fully vaccinated people, broken out by age group. The rates per 100k in vbtcirates.xlsx are converted into cases, hospitalizations, and deaths by multiplying by the appropriate population. The number of vaccinated people by age group can found on the Vaccine Data page, https://mn.gov/covid19/vaccine/data/index.jsp , in the data file People Vaccinated by Age. The unvaccinated population is found by taking the US Census American Community Survey 5-Year Estimate (Data Table S0101, https://data.census.gov/cedsci/table) and subtracting the vaccinated population. The breakthrough proportion is then found by dividing the breakthrough events by the total of the breakthrough and non-breakthrough weekly events.
- MDH defines a breakthrough event as a Covid case, hospital admission, or death that occurs 14 or more days after completing the vaccination series (not including boosters).
- Fig 1: This table is the weekly announced cumulative breakthrough cases, hospital admissions, and deaths, as well as the weekly totals, and change in weekly totals. New breakthrough cases announced on 2/28/2022 total just 6,310 cases. It’s still not clear how the MDH’s reporting backlog during the worst of the Omicron surge has affected breakthrough reporting.
- Fig. 2 and Fig. 3, Overall Breakthrough Proportions: The overall proportion of breakthrough cases of total cases for the week starting 1/23/2022 was 64.3%, just off last week’s record high of 65.3%. The proportion of breakthrough hospitalizations rose to a new record of 52.4% of all hospitalizations, while breakthrough deaths rose to another new record of 55.8% of the total weekly deaths.
- Fig. 4 through Fig. 7: Breakthrough Proportions by Age Group: The breakthrough proportion of cases are generally trending higher in all age groups for the week starting 1/23/2022, except for small decreases off record highs for the 65+ age group.