Everything is crashing, across all age groups. Dave’s notes:
1. There are 2 slides for each set of data, one showing data for the whole pandemic and a second chart showing only data since early July, 2021. Note that the full pandemic slides have different start dates, because Minnesota Department started publishing different data on different dates. This week the shorter time period chart of each pair has been started 4 weeks later than previously.
2. The data for the charts on testing, hospital admissions, and deaths comes from the Minnesota Weekly Report (available here: https://www.health.state.mn.us/diseases/coronavirus/stats/index.html). The data in the Weekly Report is presented as cumulative totals for each data type each week. I am taking weekly differences and assembling the data into charts. This data is by date of report, meaning the charts are documenting new events reported this week, even though the underlying event occurred sometime in the past. The data is provided for 5 year age groups, and I am assembling into 10 year age groups to make the charts more readable.
3. The data for the Covid cases per week come from a data file published along with the Minnesota Weekly Report, here: https://www.health.state.mn.us/diseases/coronavirus/stats/index.html#wagscd1 This data is published by date of specimen collection, rather than by date of report as the other data is. The data is provided as cases per week in 5 year age groups. I am compiling the data into 10 year age groups in order for the charts to be more readable. This data is updated by date of specimen collection, so it is possible that past week’s data will be updated.
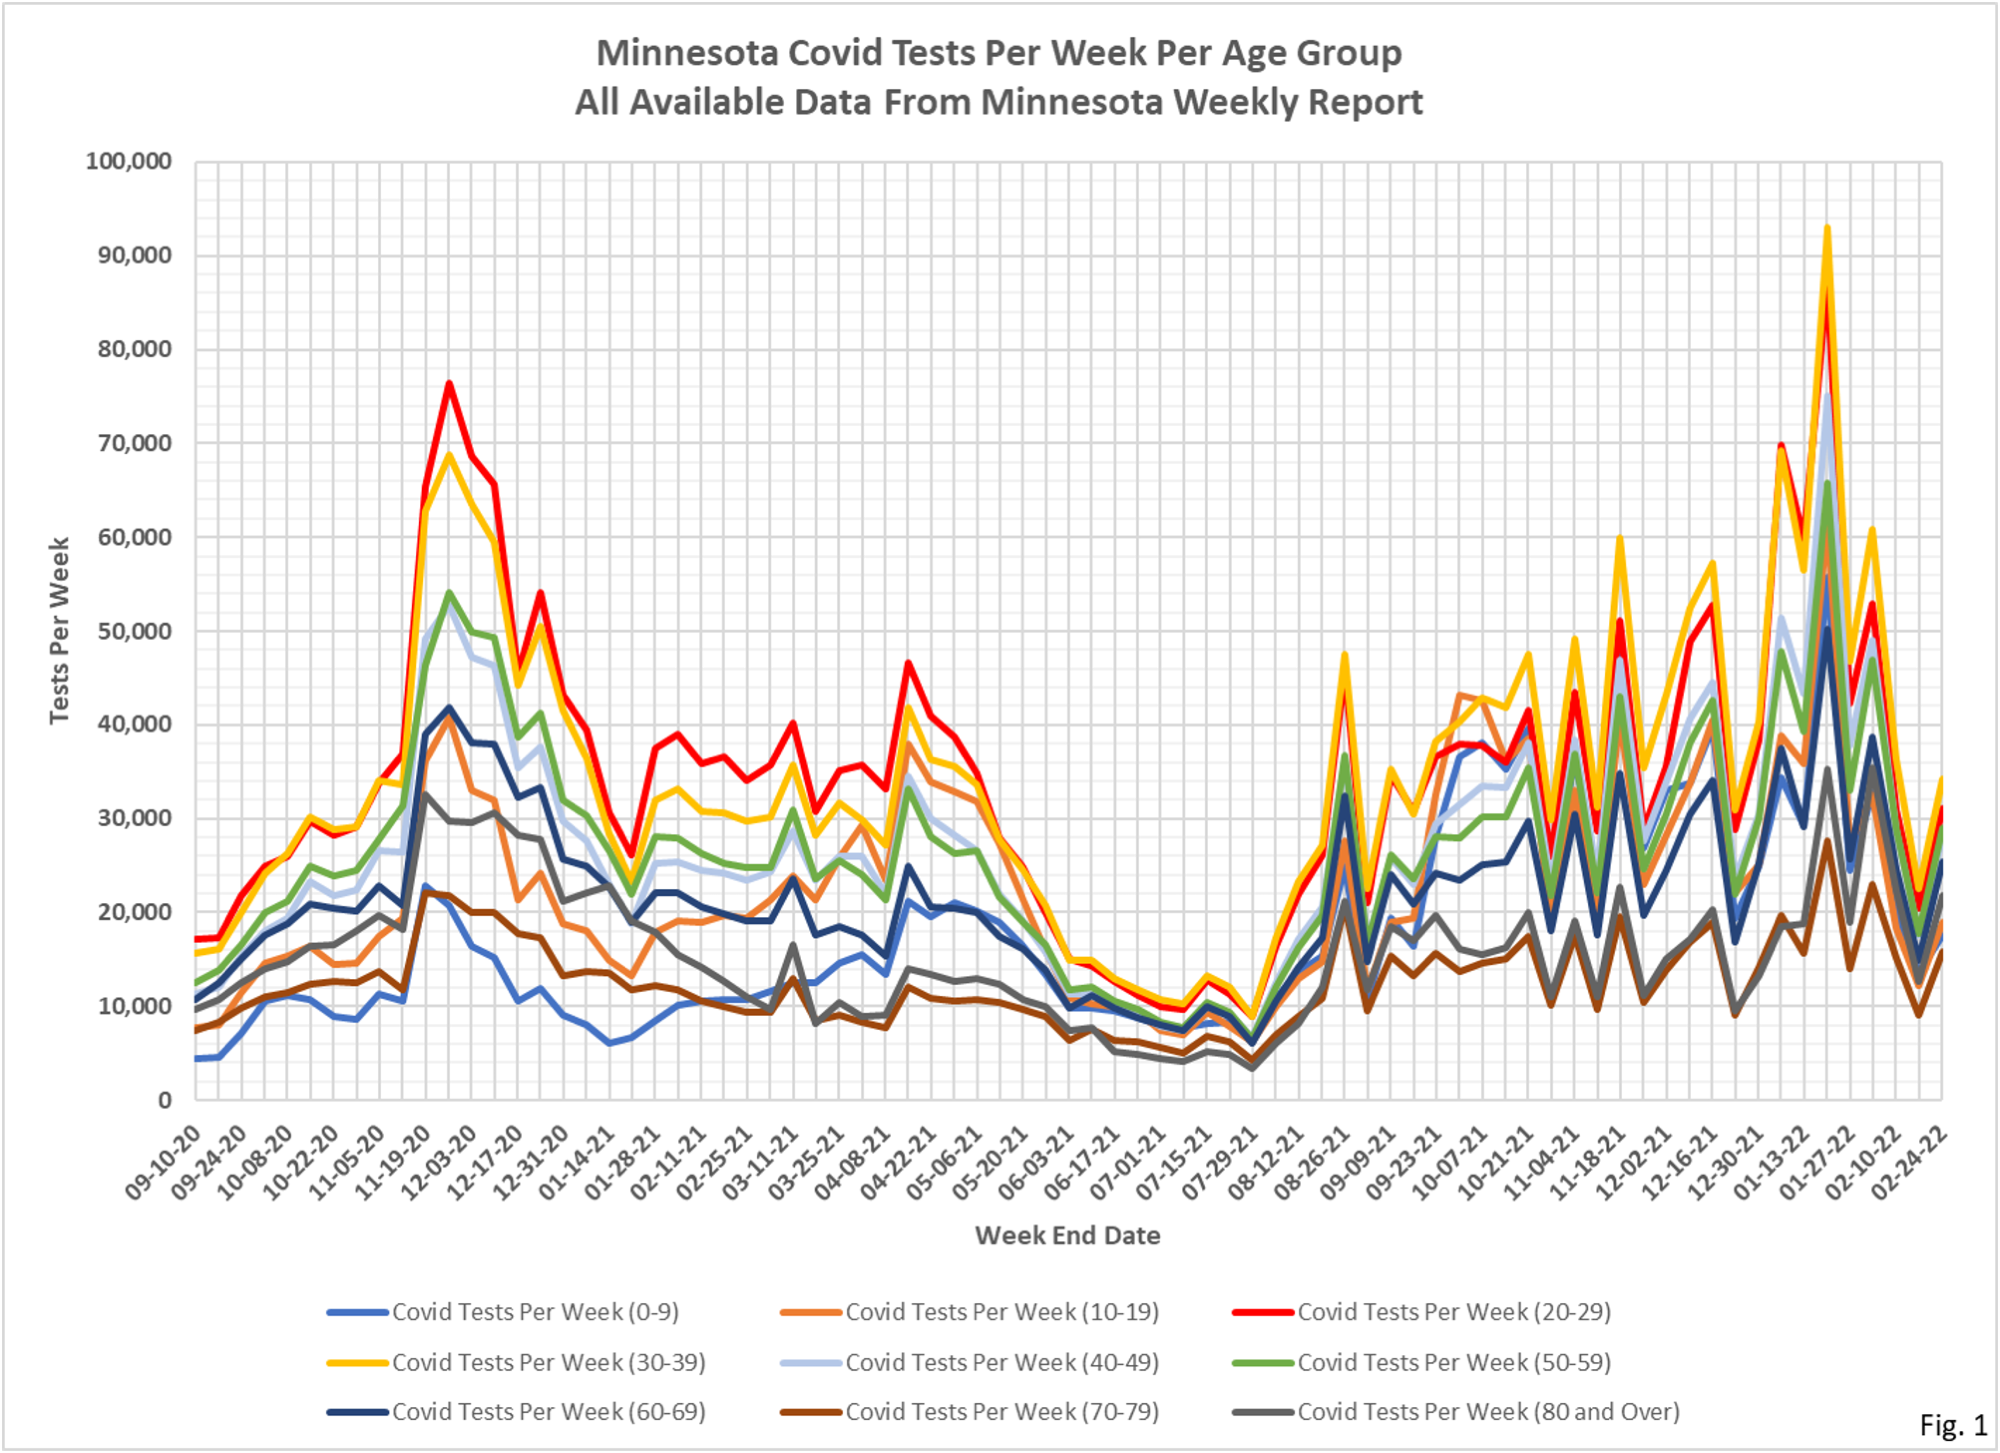
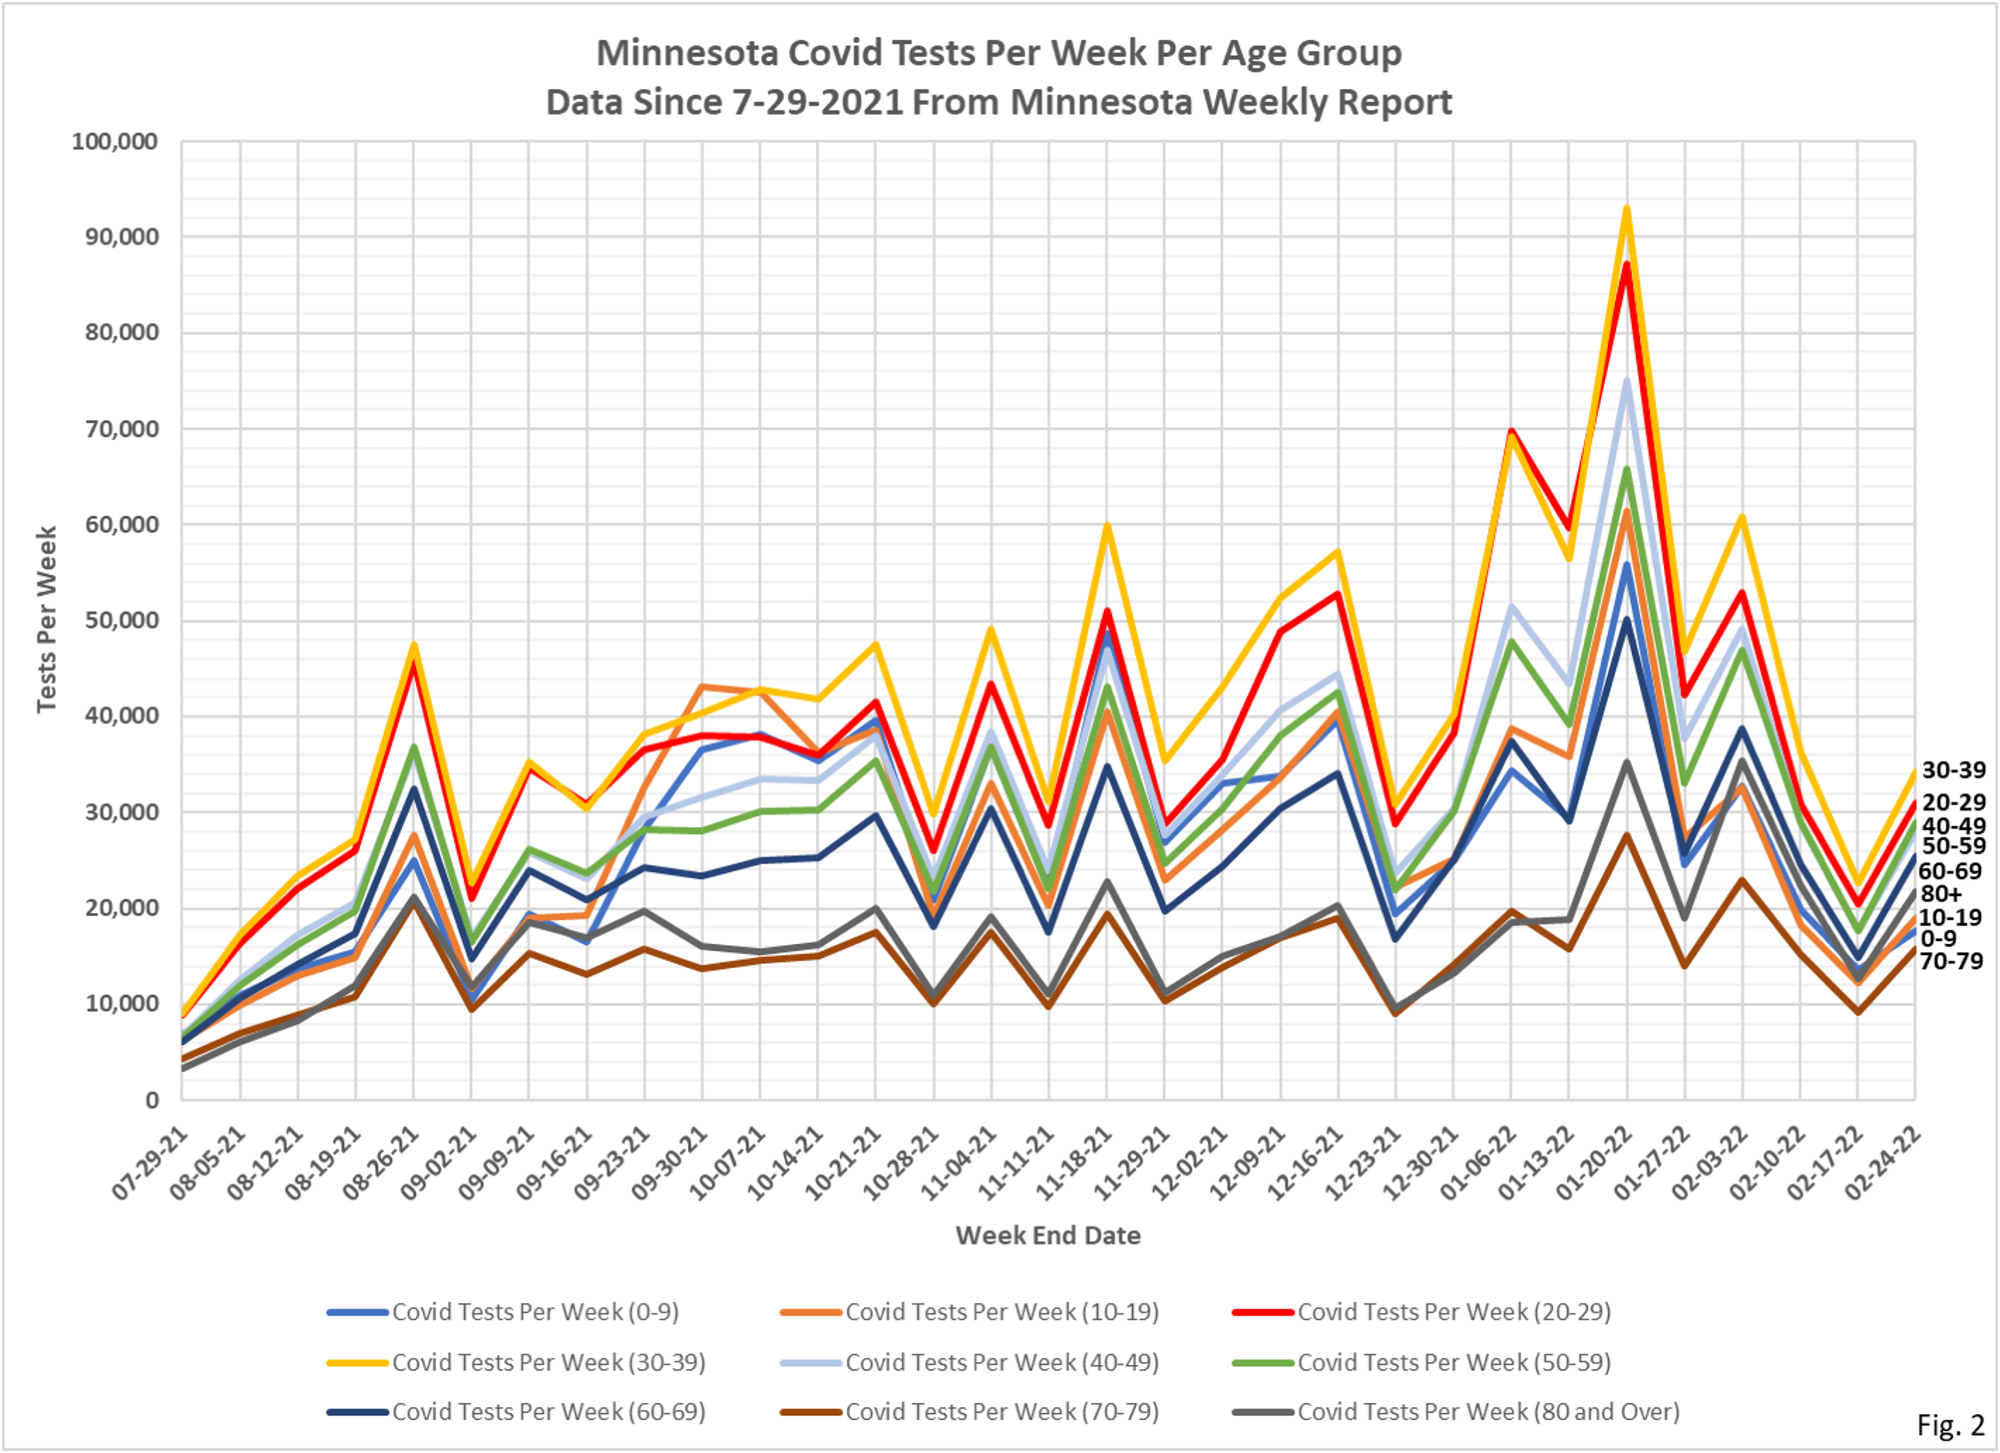
4. Fig. 1 and 2: Covid Tests Per Week. Reported testing higher this week, but this data lags. Actual testing, by date of test is trending lower on the Minnesota Situation Update web page. https://www.health.state.mn.us/diseases/coronavirus/situation.html
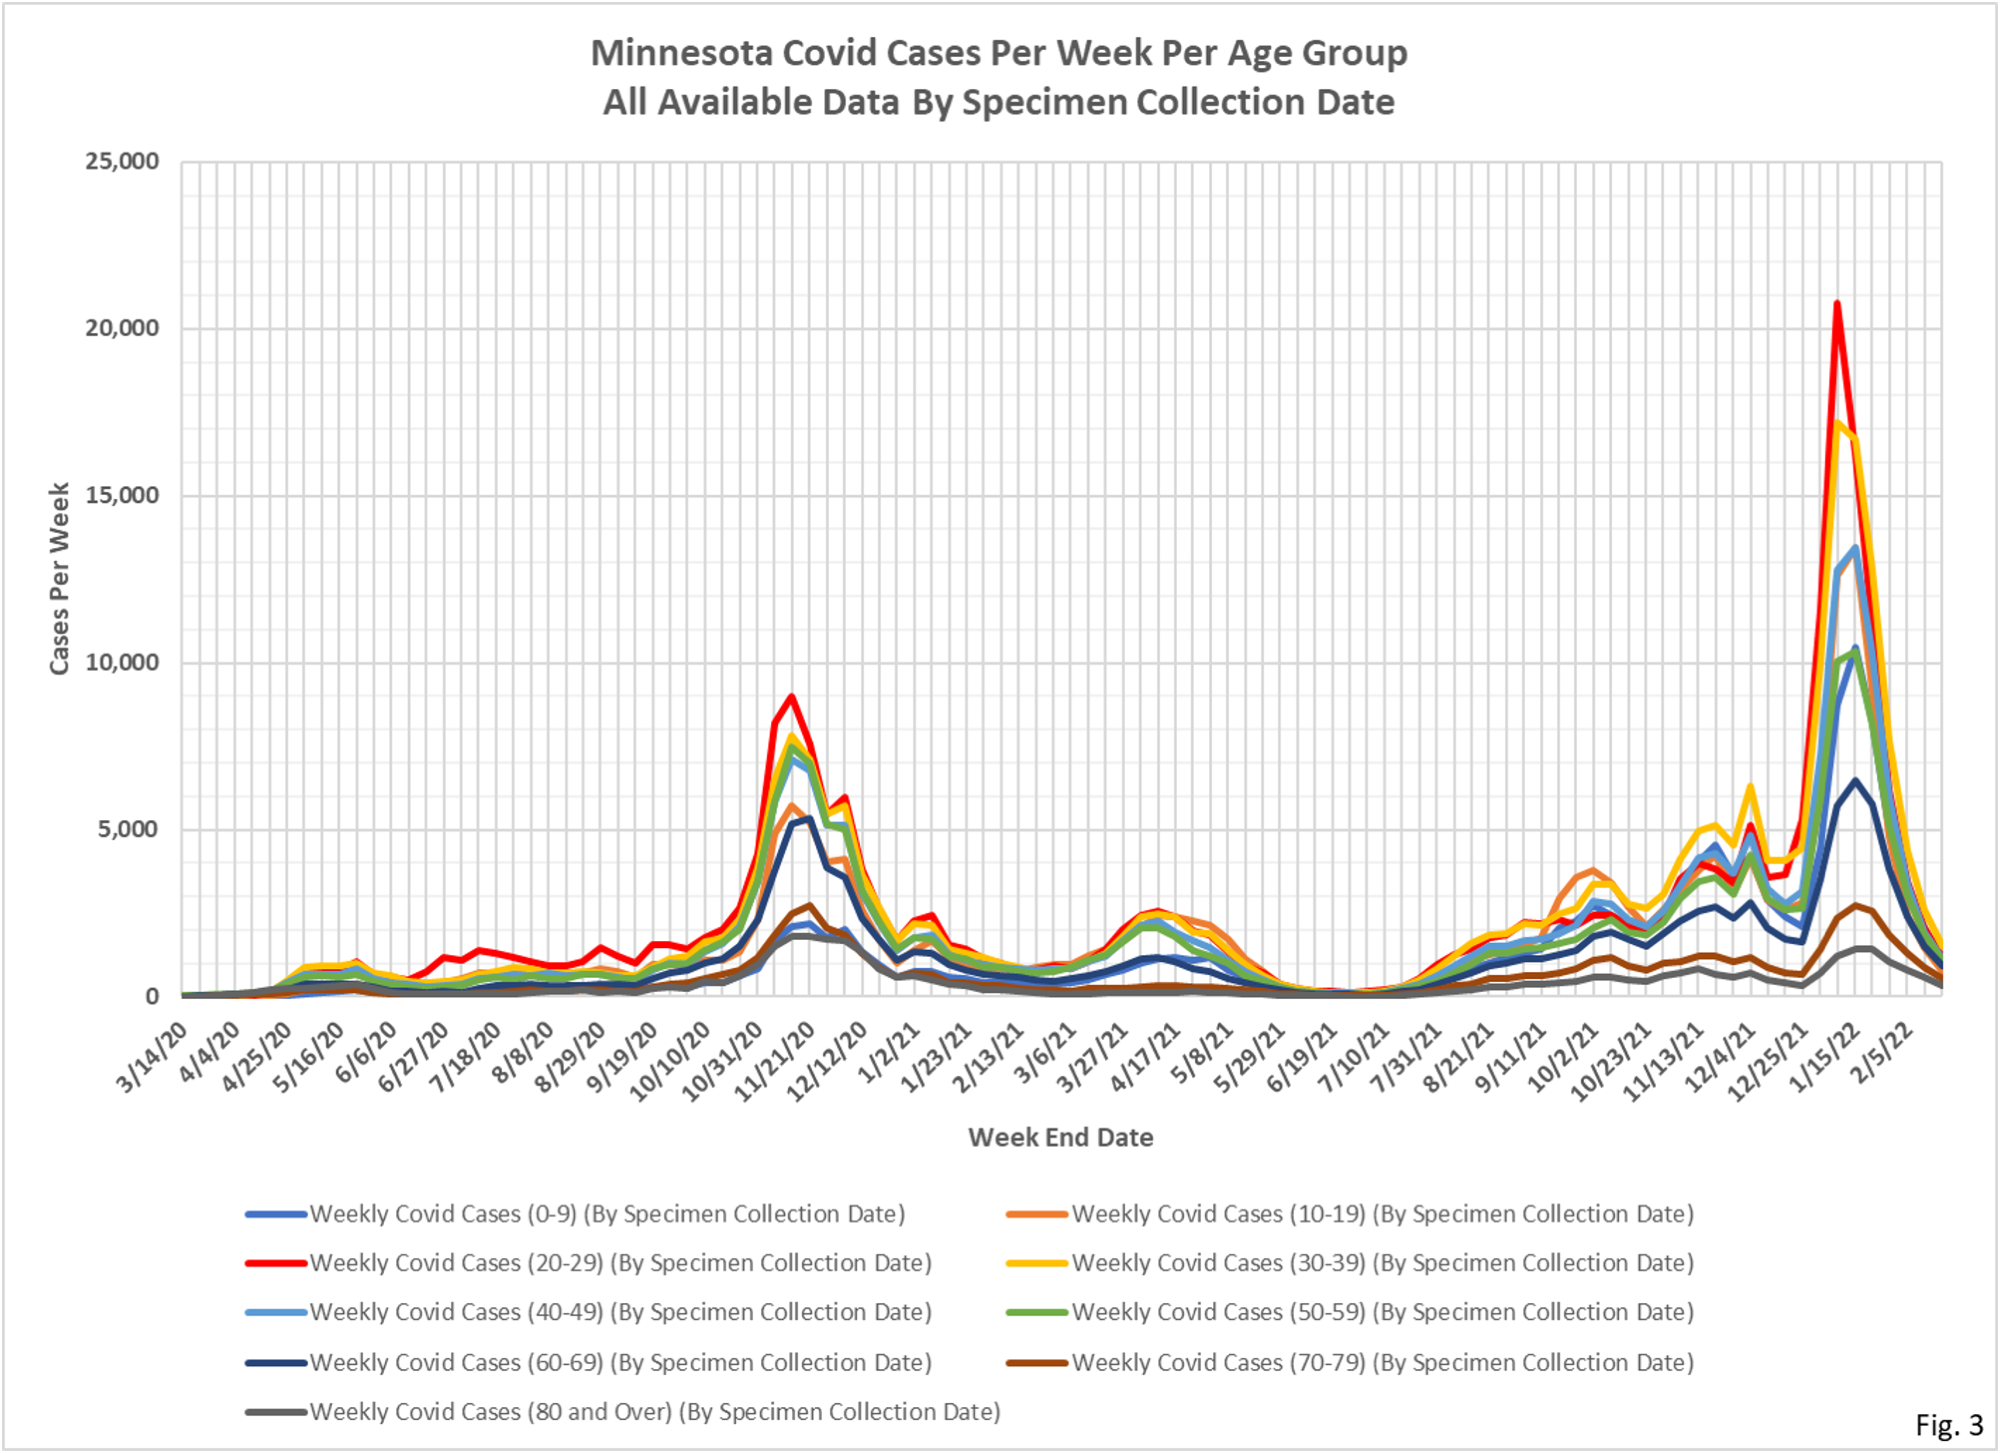
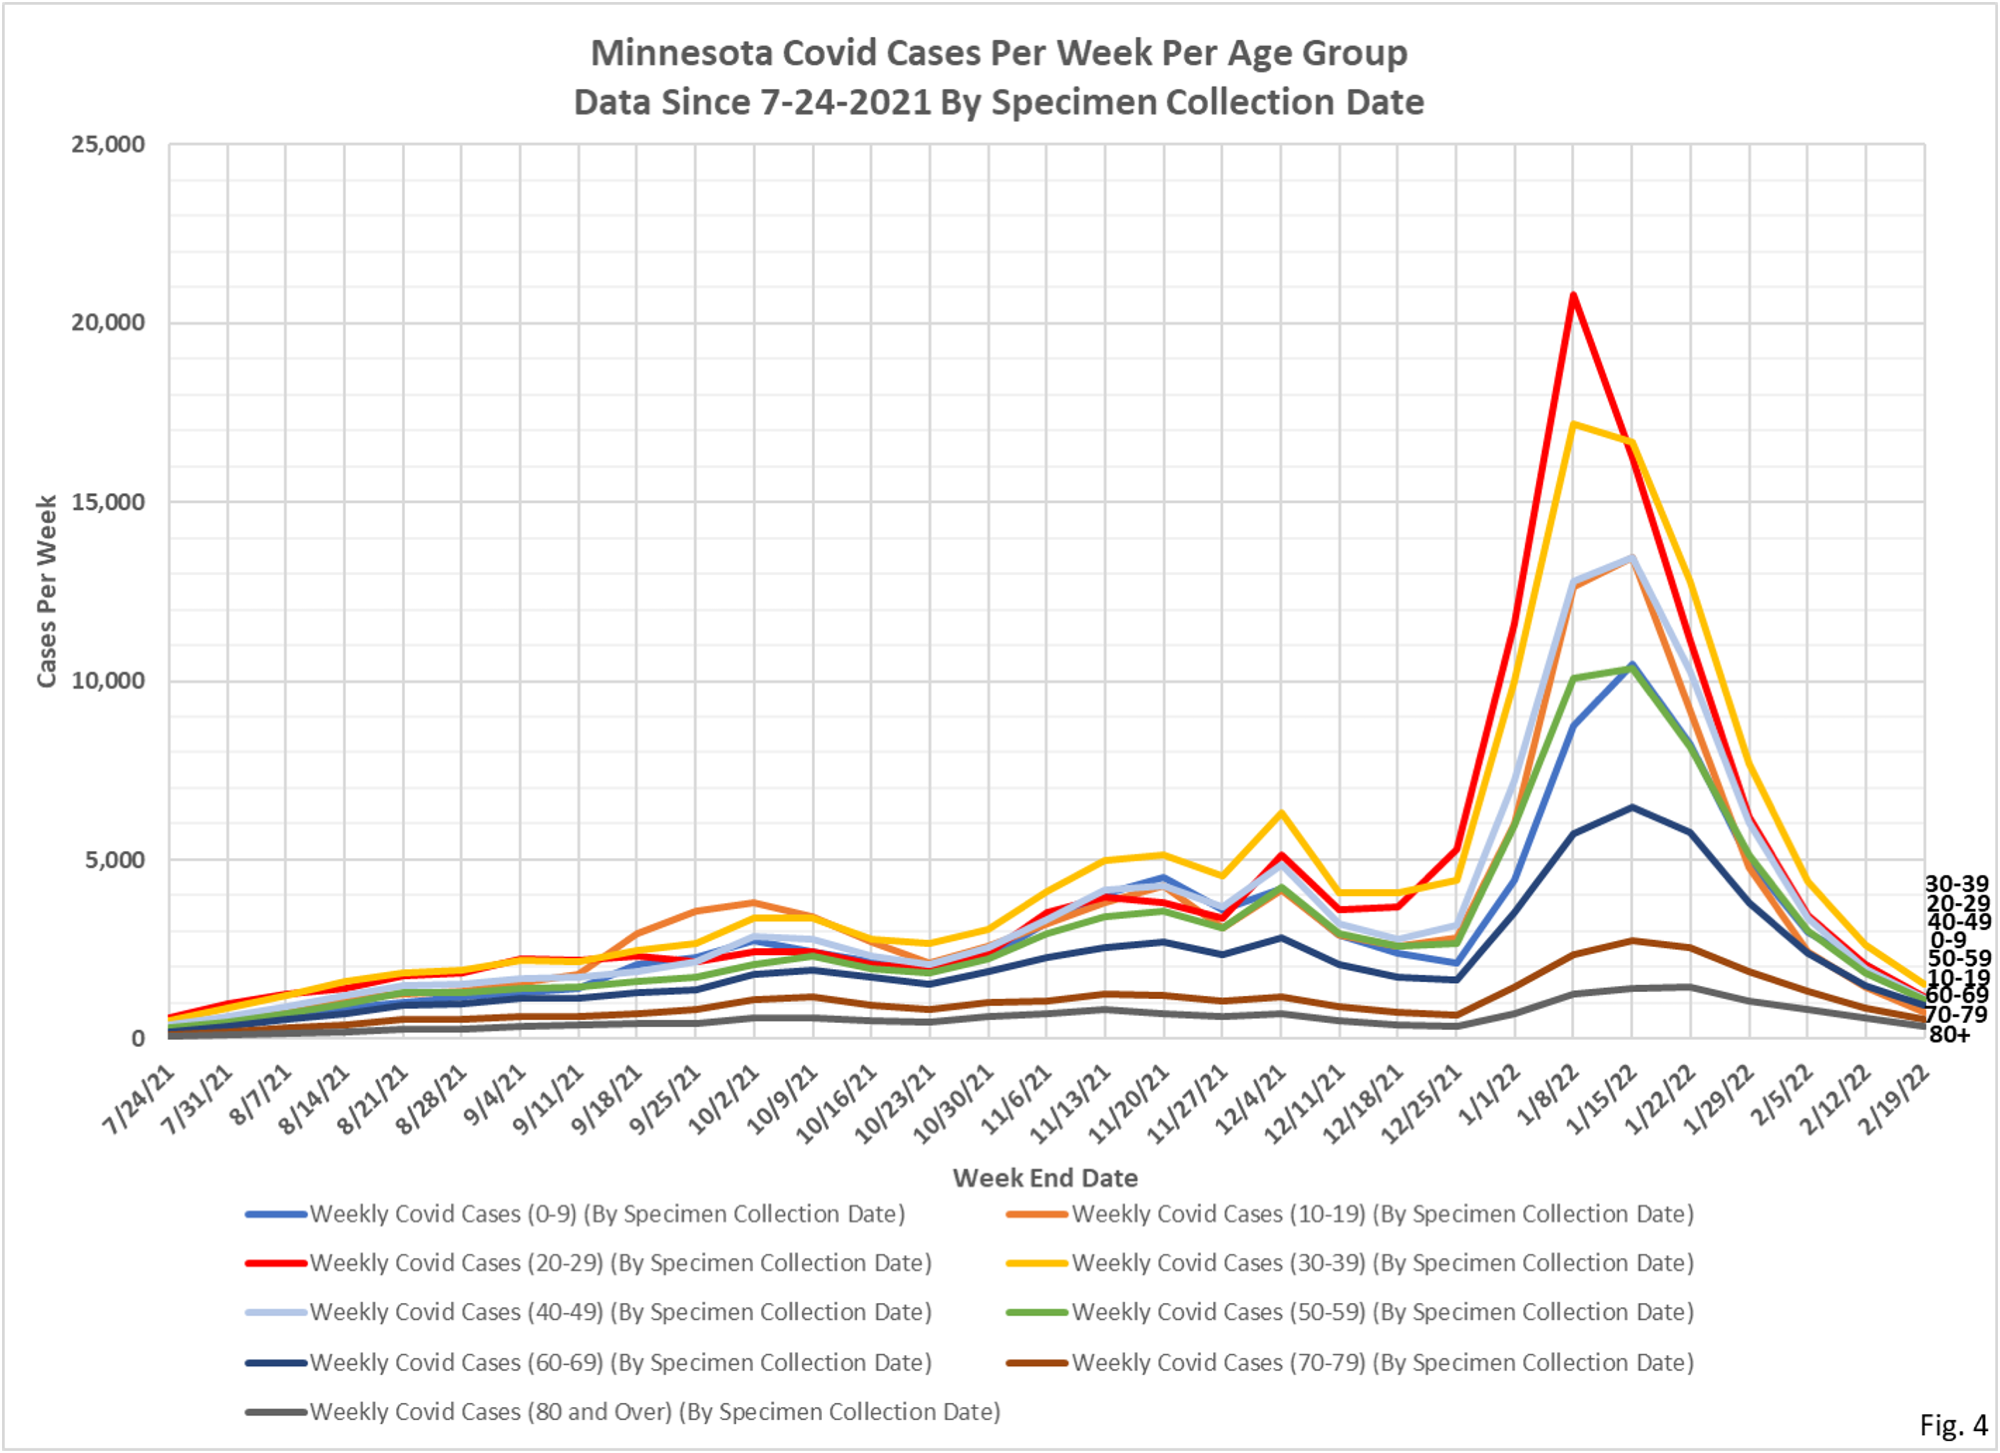
5. Fig. 3 and 4: Covid Cases Per Week. The reported Covid cases this week were lower this week in all age groups, continuing the trend we have seen since the peak 6 weeks ago. Total cases for the week were reported as 8,578, a 42.5% decrease from last week’s revised total of 14,942 cases. This week’s reported cases were the lowest since 8,460 cases were reported for the week ending 8/14/2021.
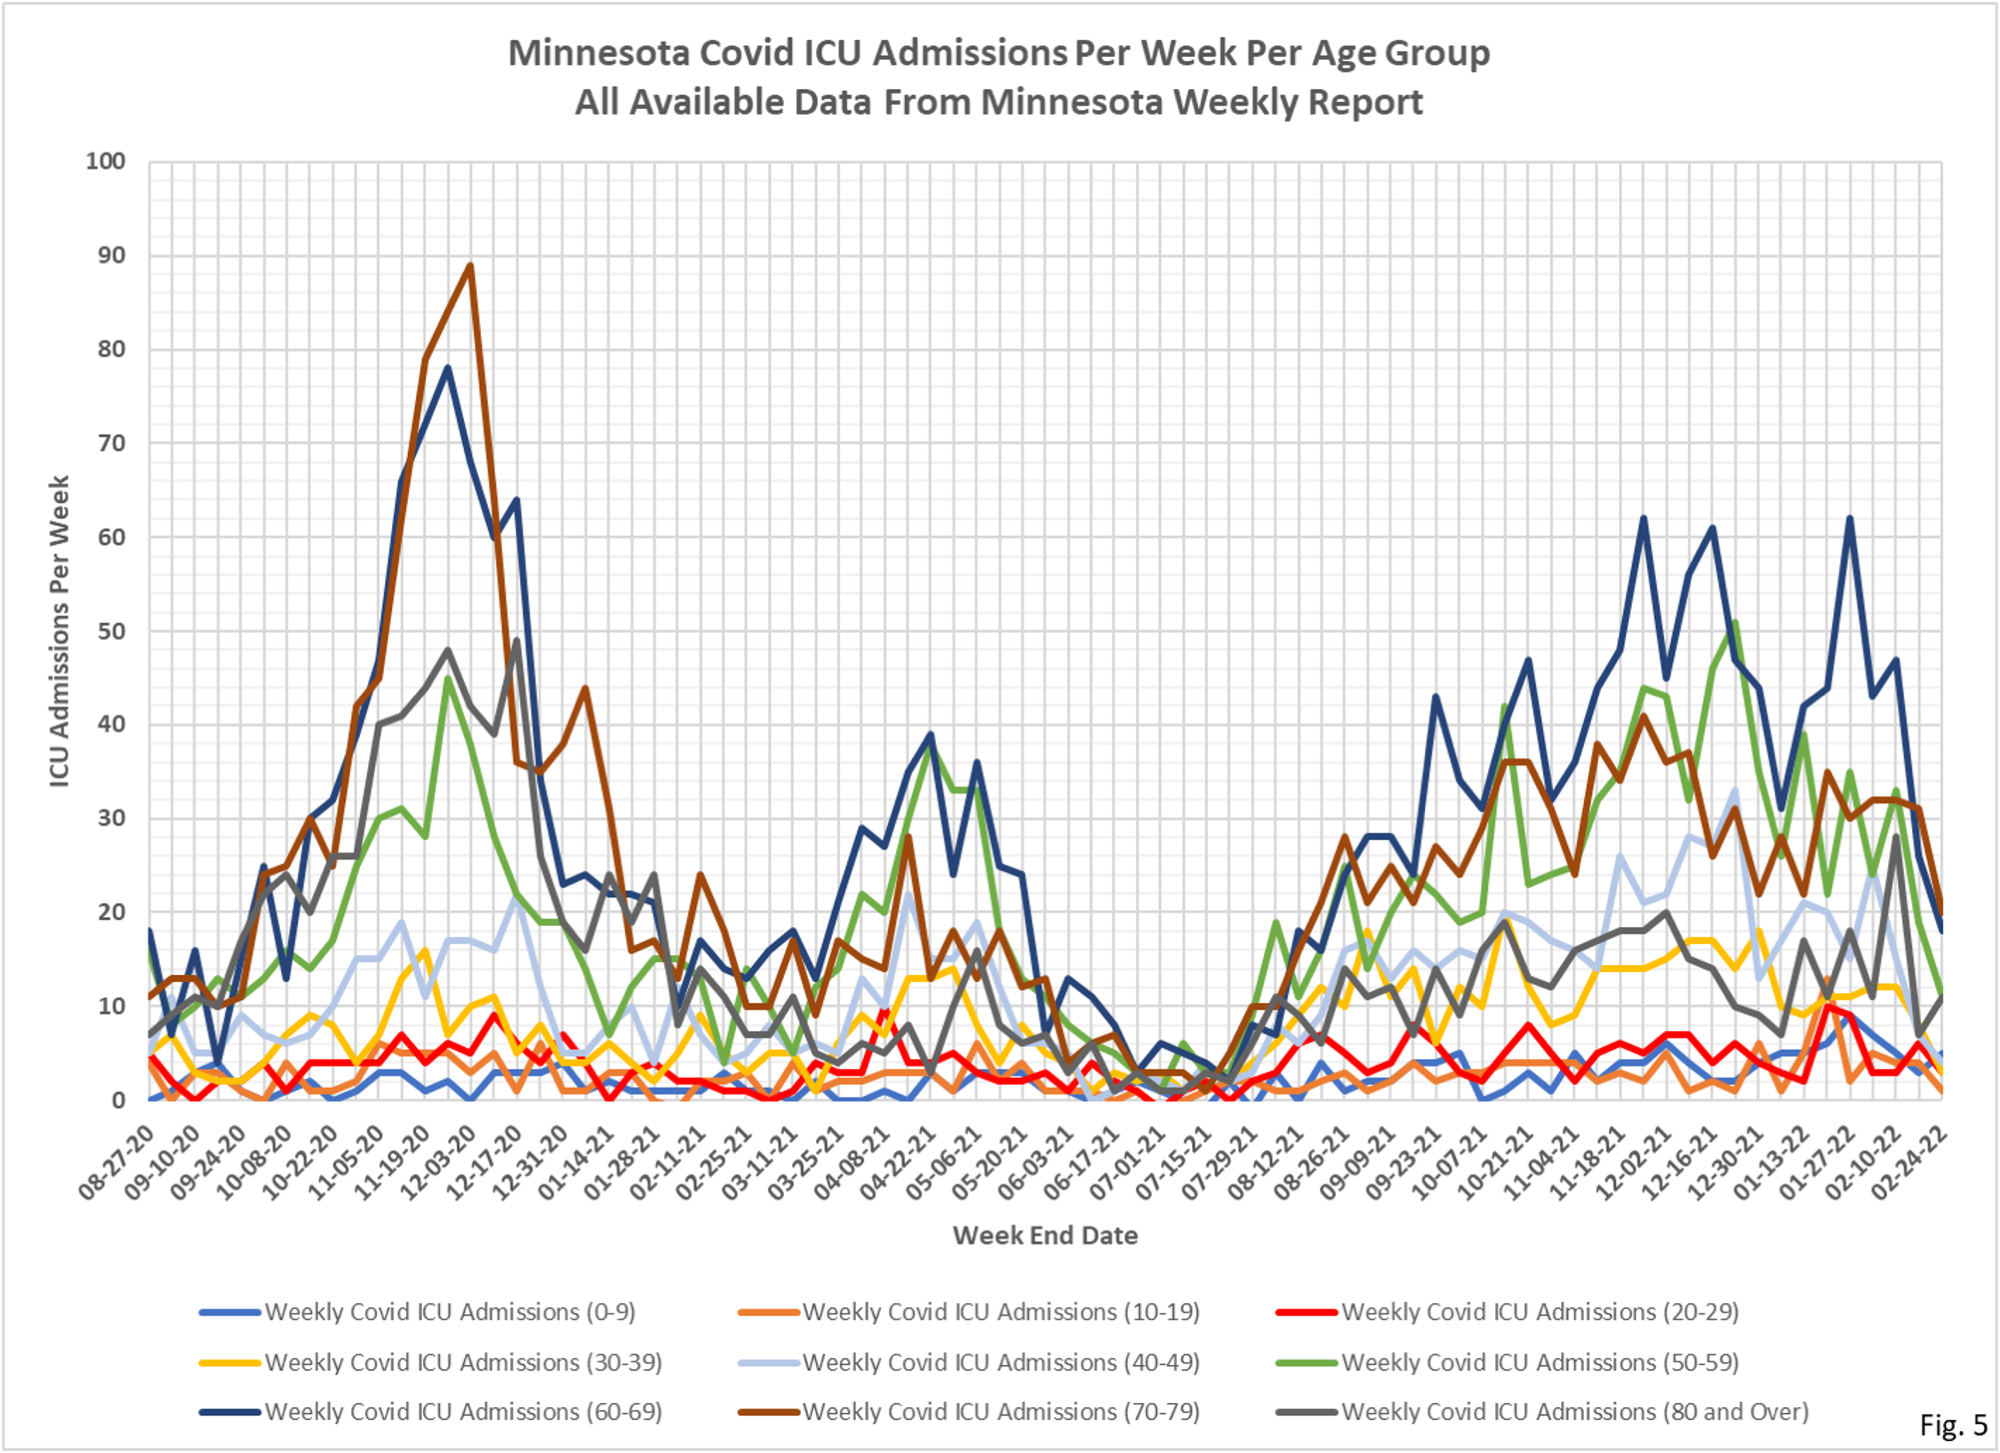
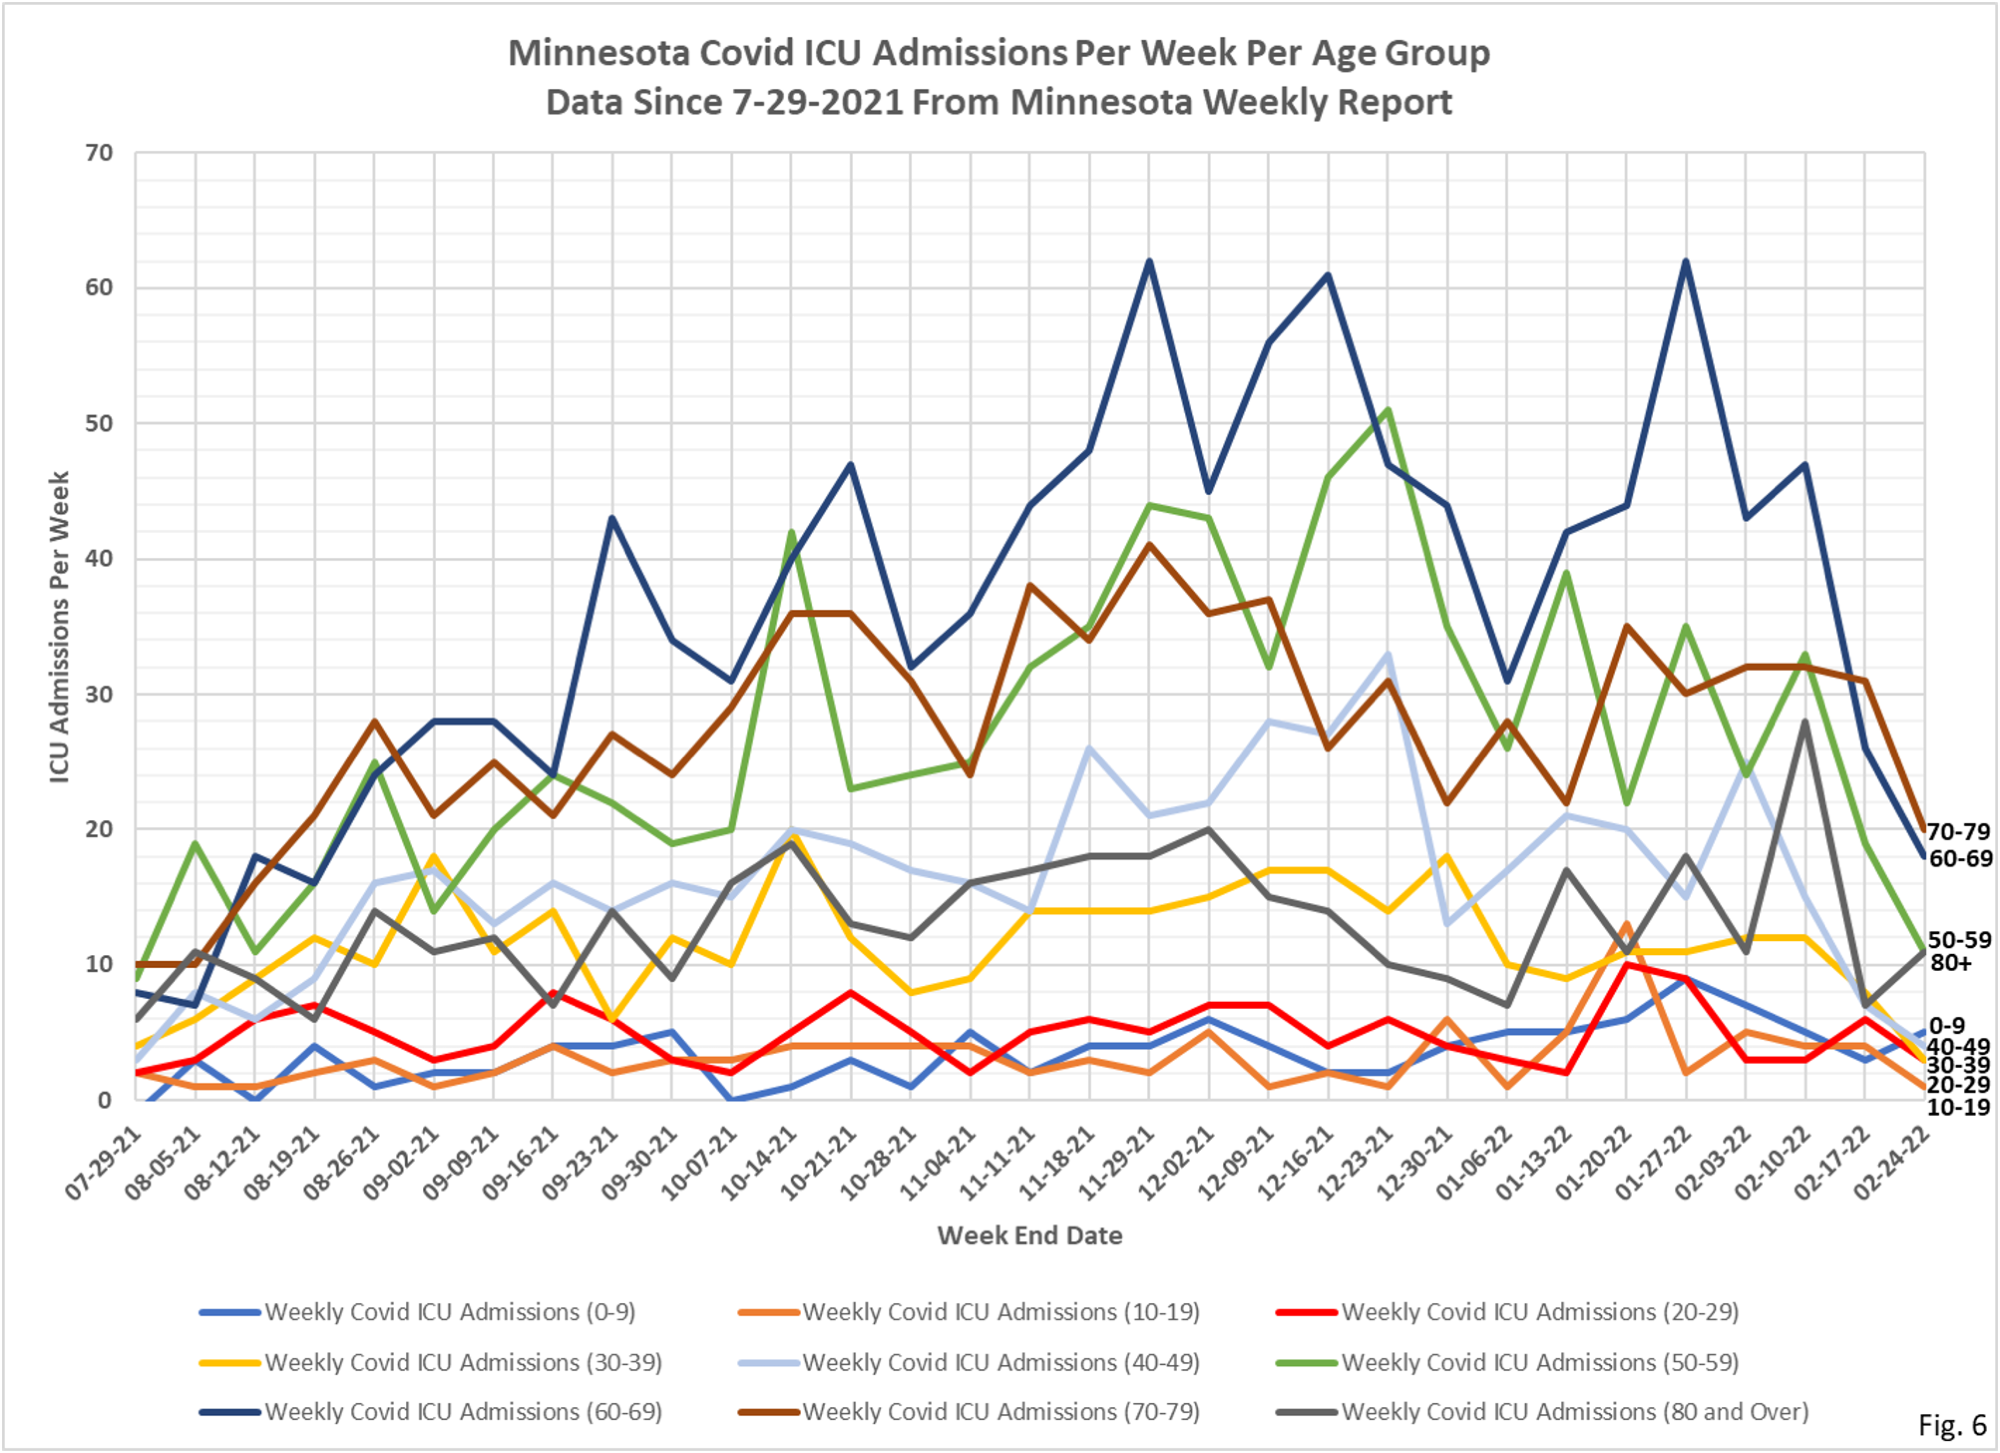
6. Fig. 5 and 6: ICU Covid Admissions Per Week. Reported ICU Covid admissions were generally lower this week, with large decreases in all age groups, except for modest increases in the 0-9 and 80+ age groups. Reported total ICU admissions for the week were 76, an decrease of 35 from the 111 reported ICU admissions the prior week. The 76 ICU admissions for the week was the lowest since there were 76 reported ICU admissions the week ending 8/12/2021.
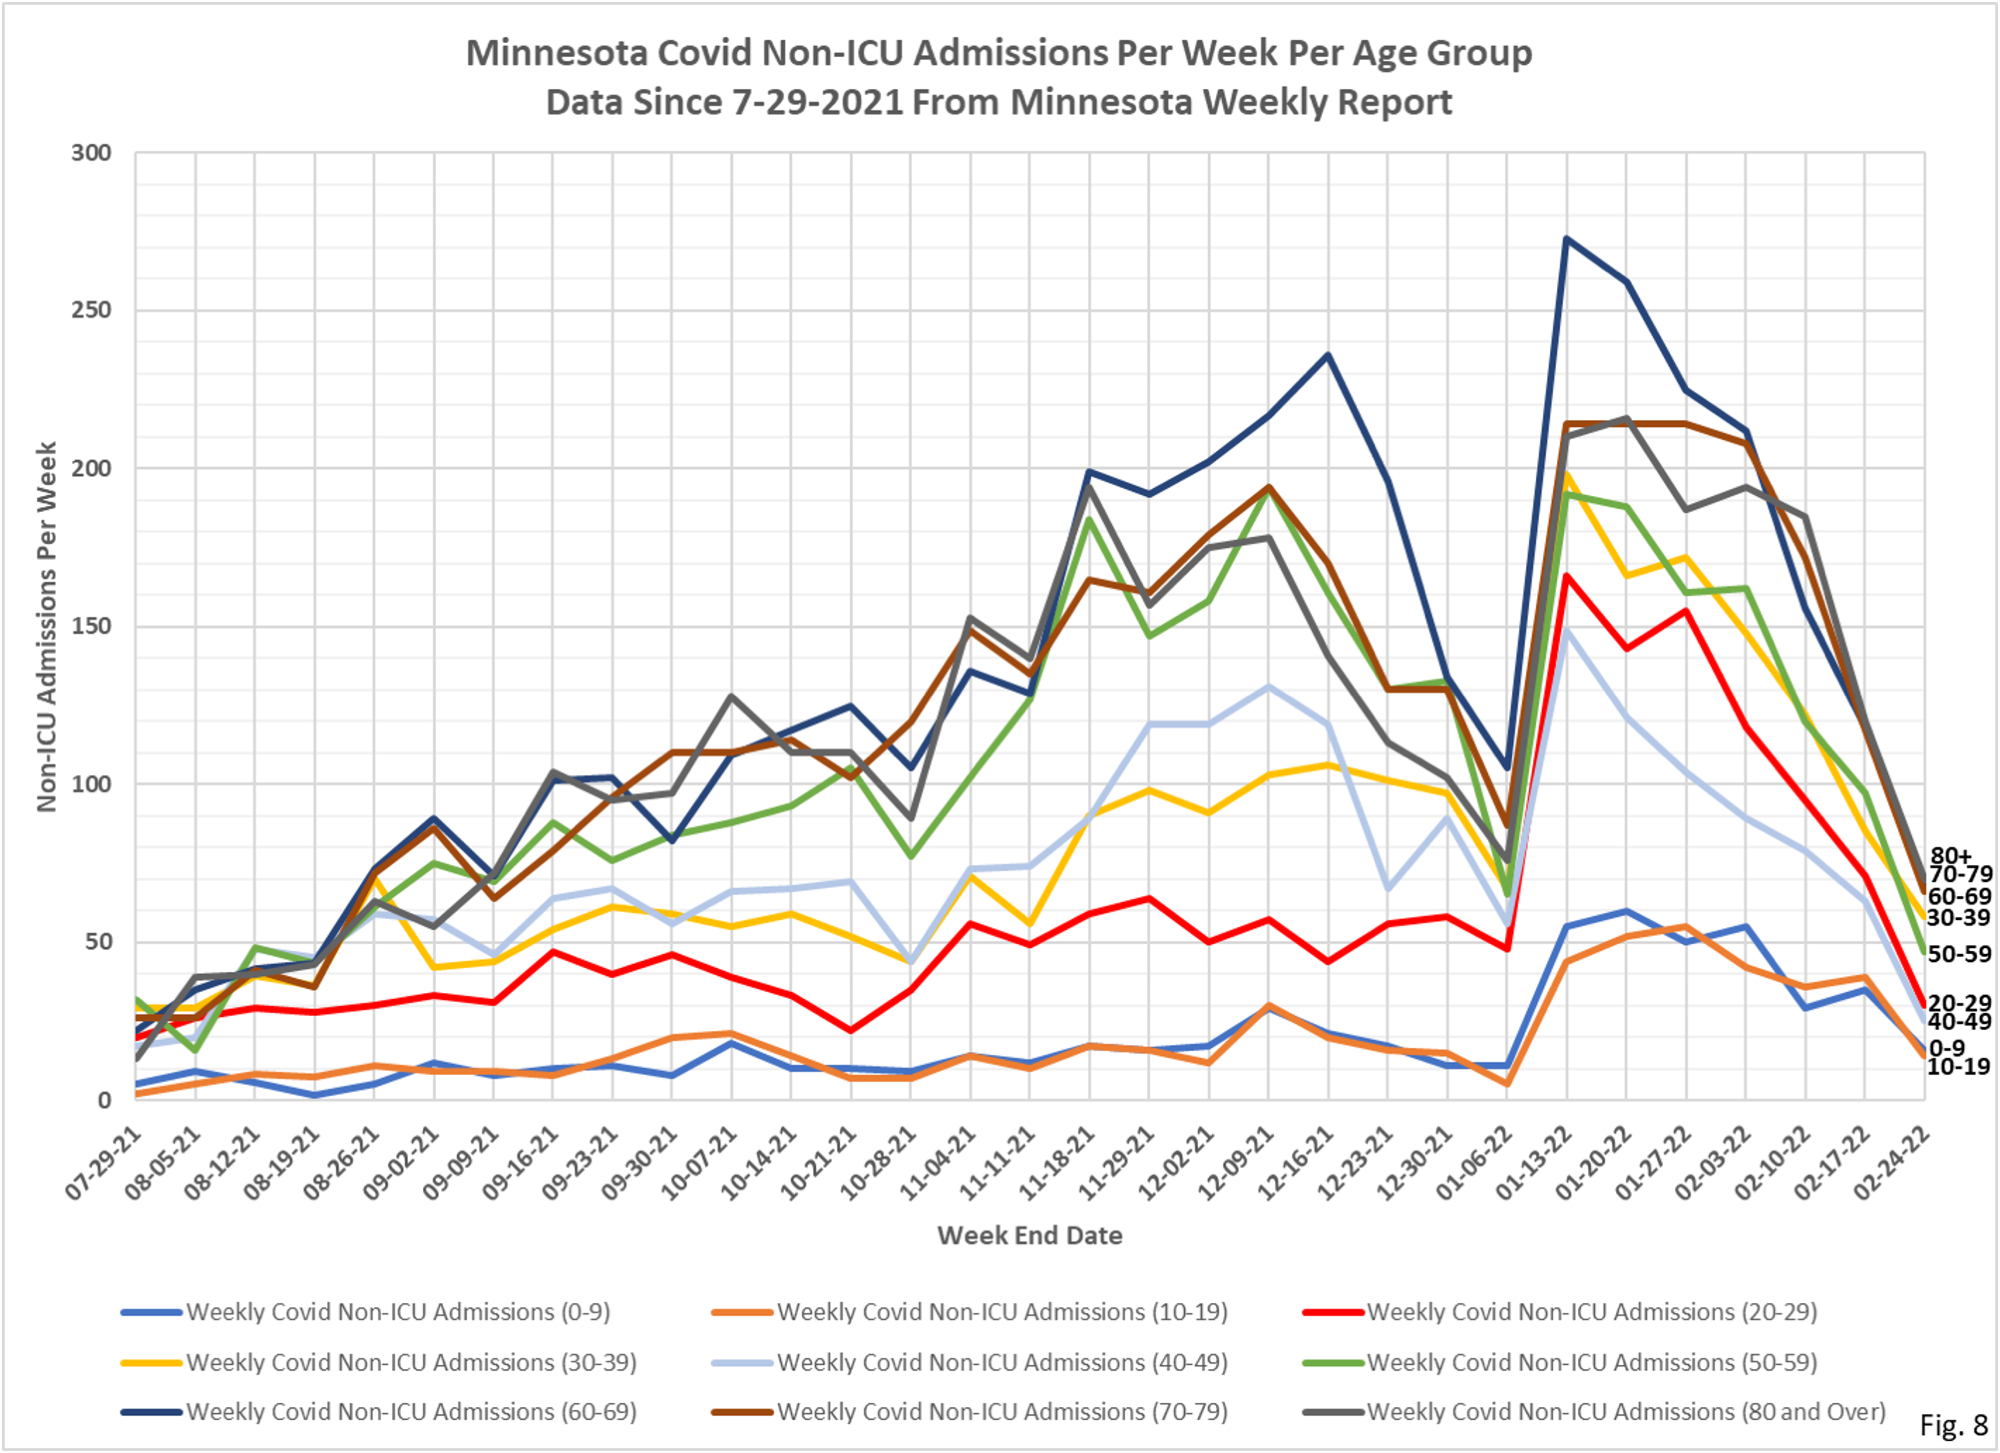
7. Fig. 7 and 8: Non-ICU Covid Admissions Per Week. Reported Non-ICU Covid admissions were sharply lower this week in every age group without exception. Total Reported Non-ICU Covid admissions for the week were 393 a decrease of 352 admissions from the prior week. 393 Non-ICU admissions were the lowest since the 285 Non-ICU admissions reported for the week ending 8/19/2021.
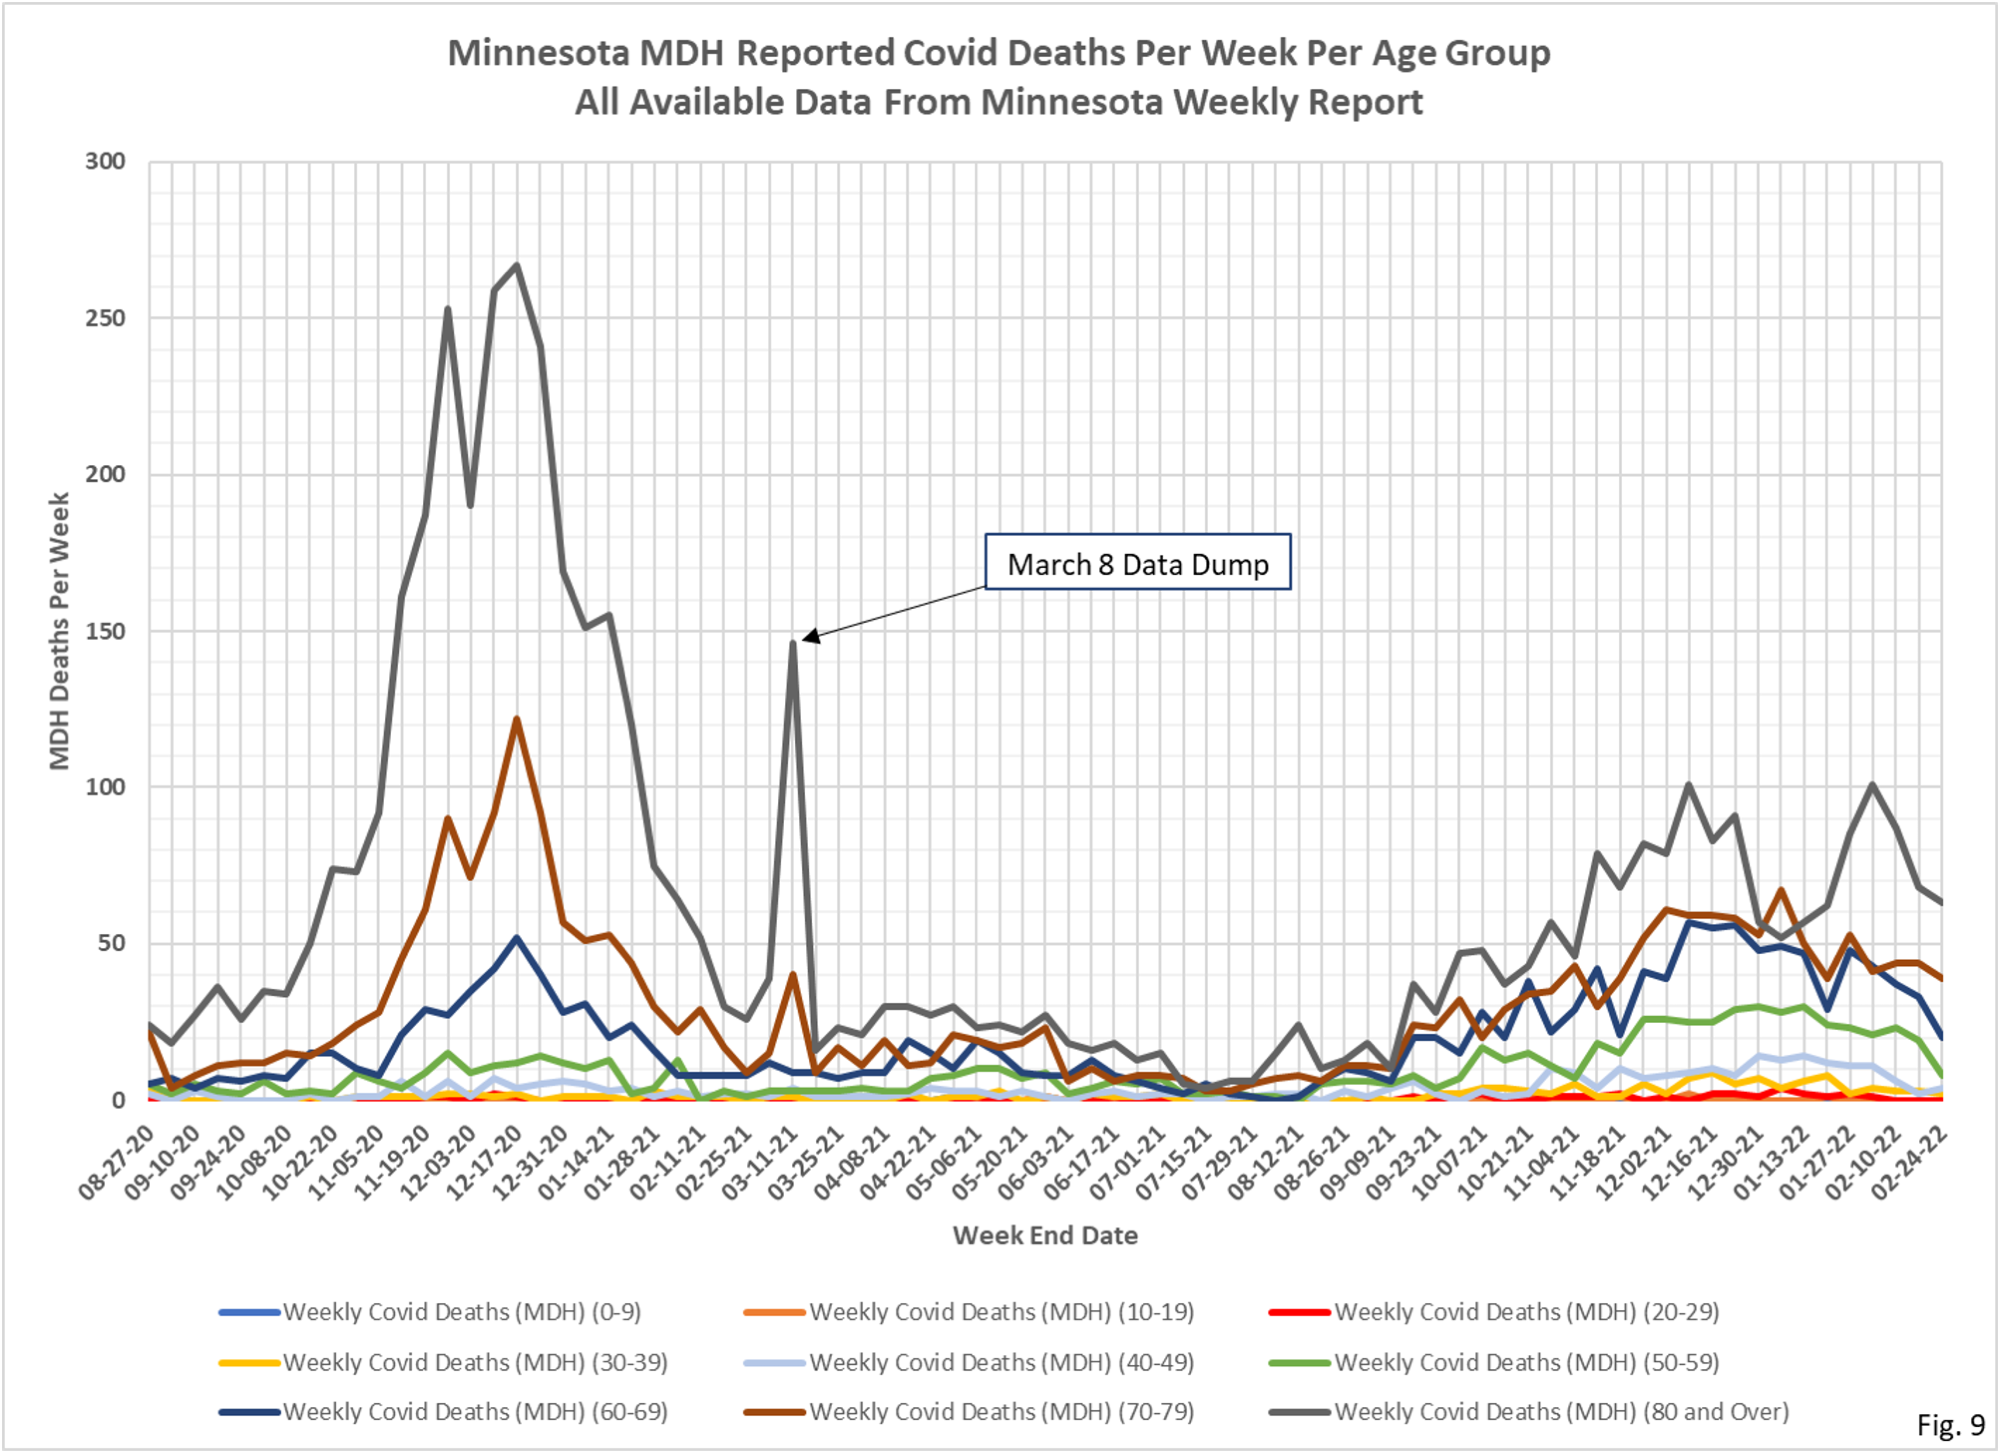
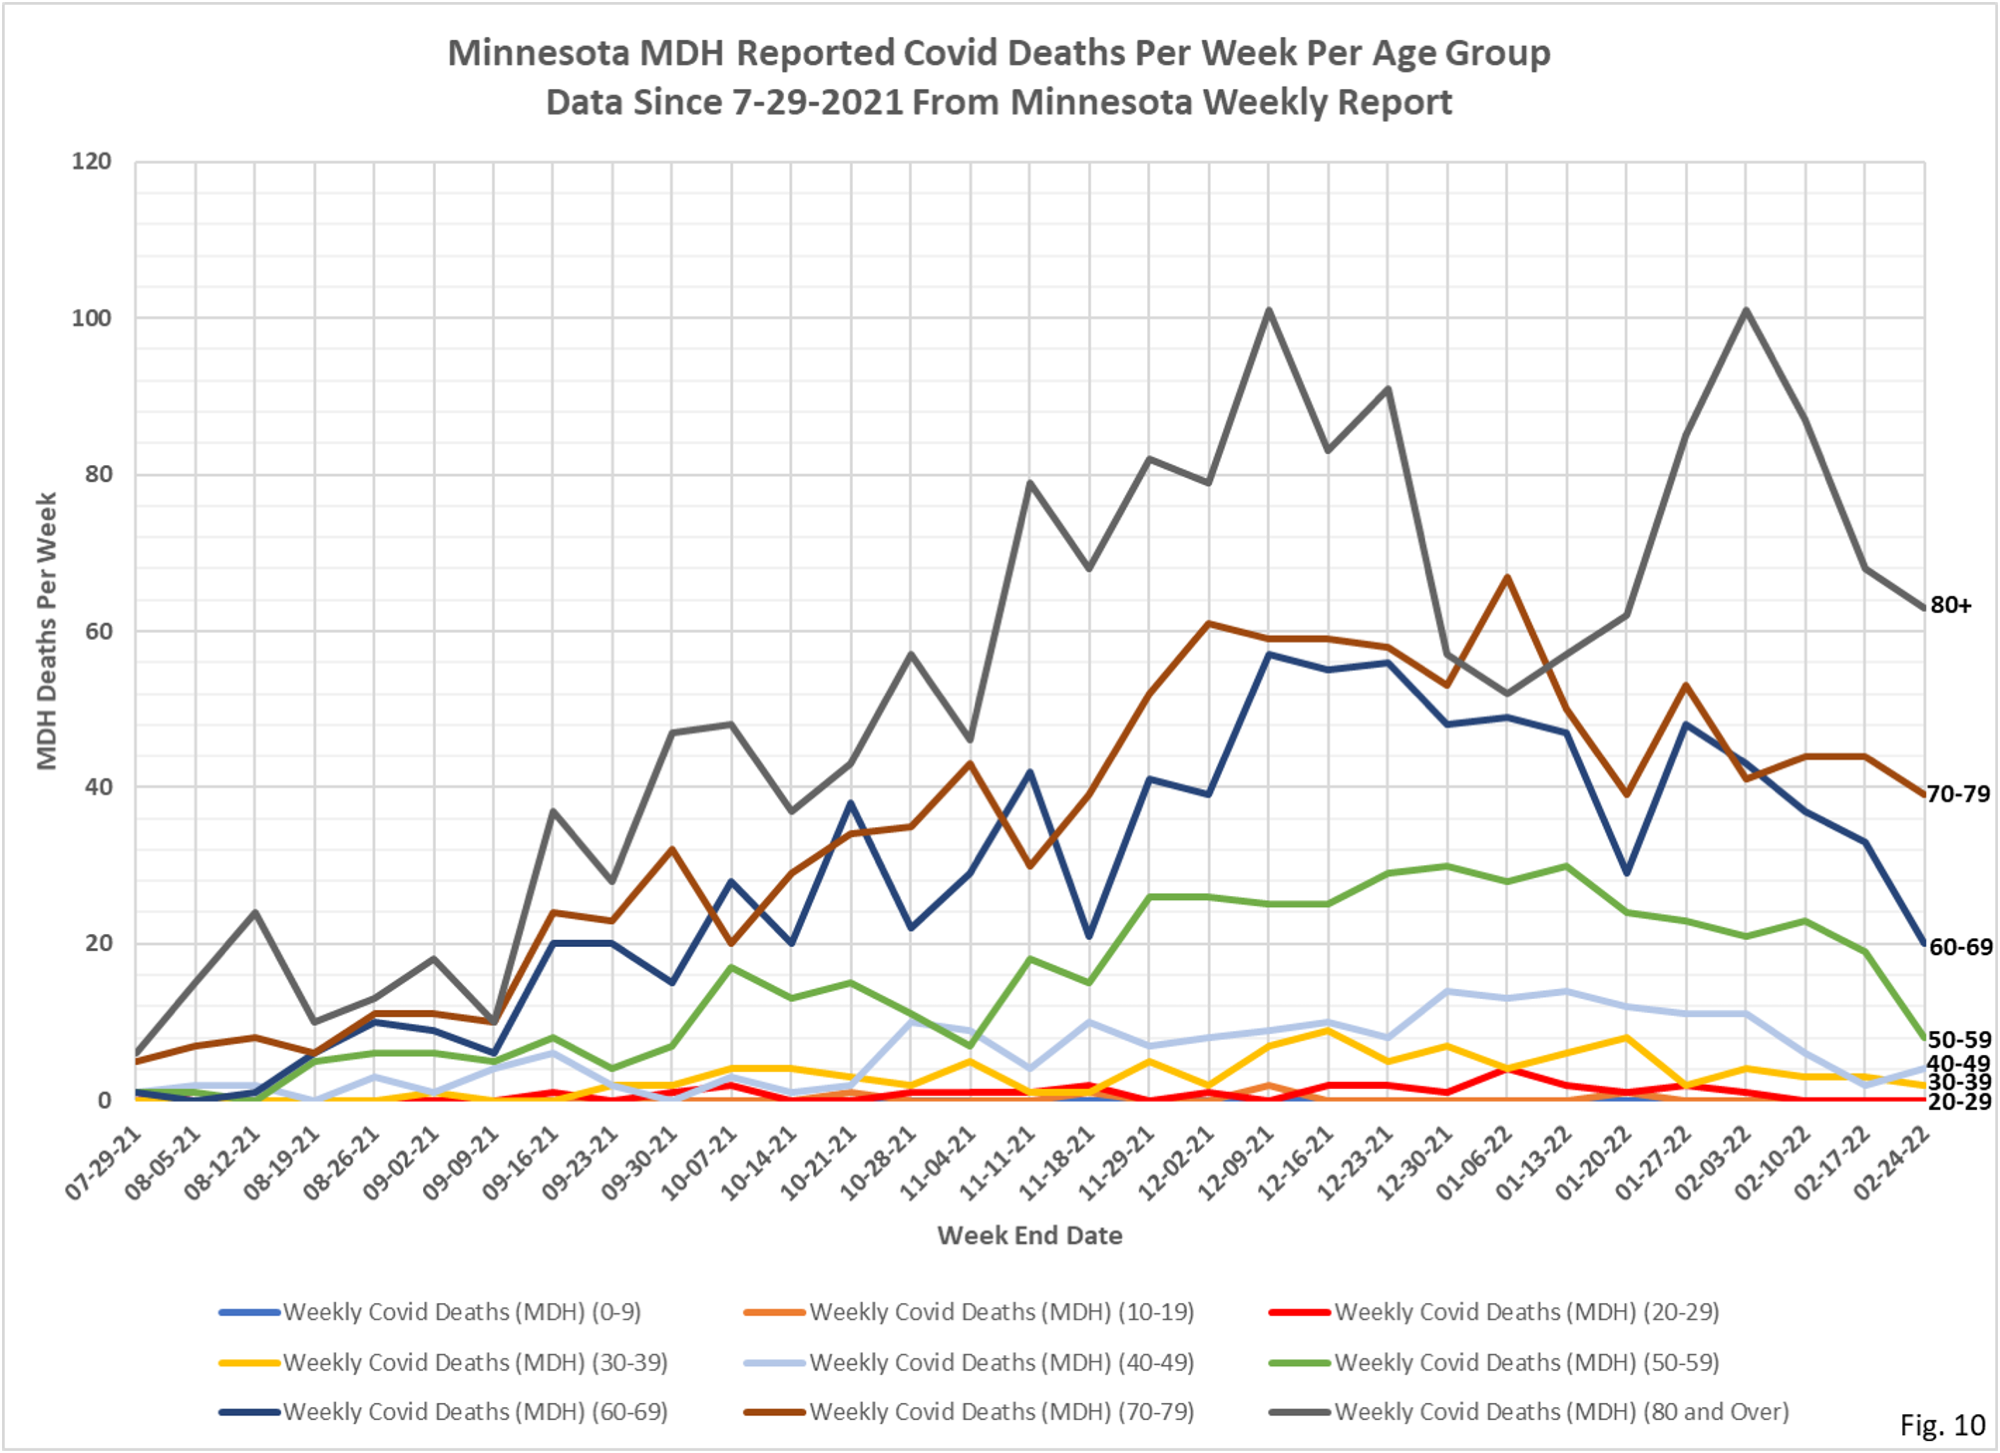
8. Fig. 9 and 10: Covid Deaths Per Week. Total reported Covid deaths for the week were 136 a decrease of 33 from the 169 reported deaths the week before.