One more run of these. CV-19 isn’t disappearing, but it is receding to very low levels, and if we only tested where the results may be clinically meaningful, we would barely know it is around. Dave Dixon’s latest regional case chart and national case and death animation. You can see Omicron was everywhere at the same time, pretty much. Something about it defeated any seasonal factors. And interesting to compare total cases or deaths by region, kind of looks like ones that more deaths in earlier waves, had fewer in later ones and the same with cases. Dave’s notes:
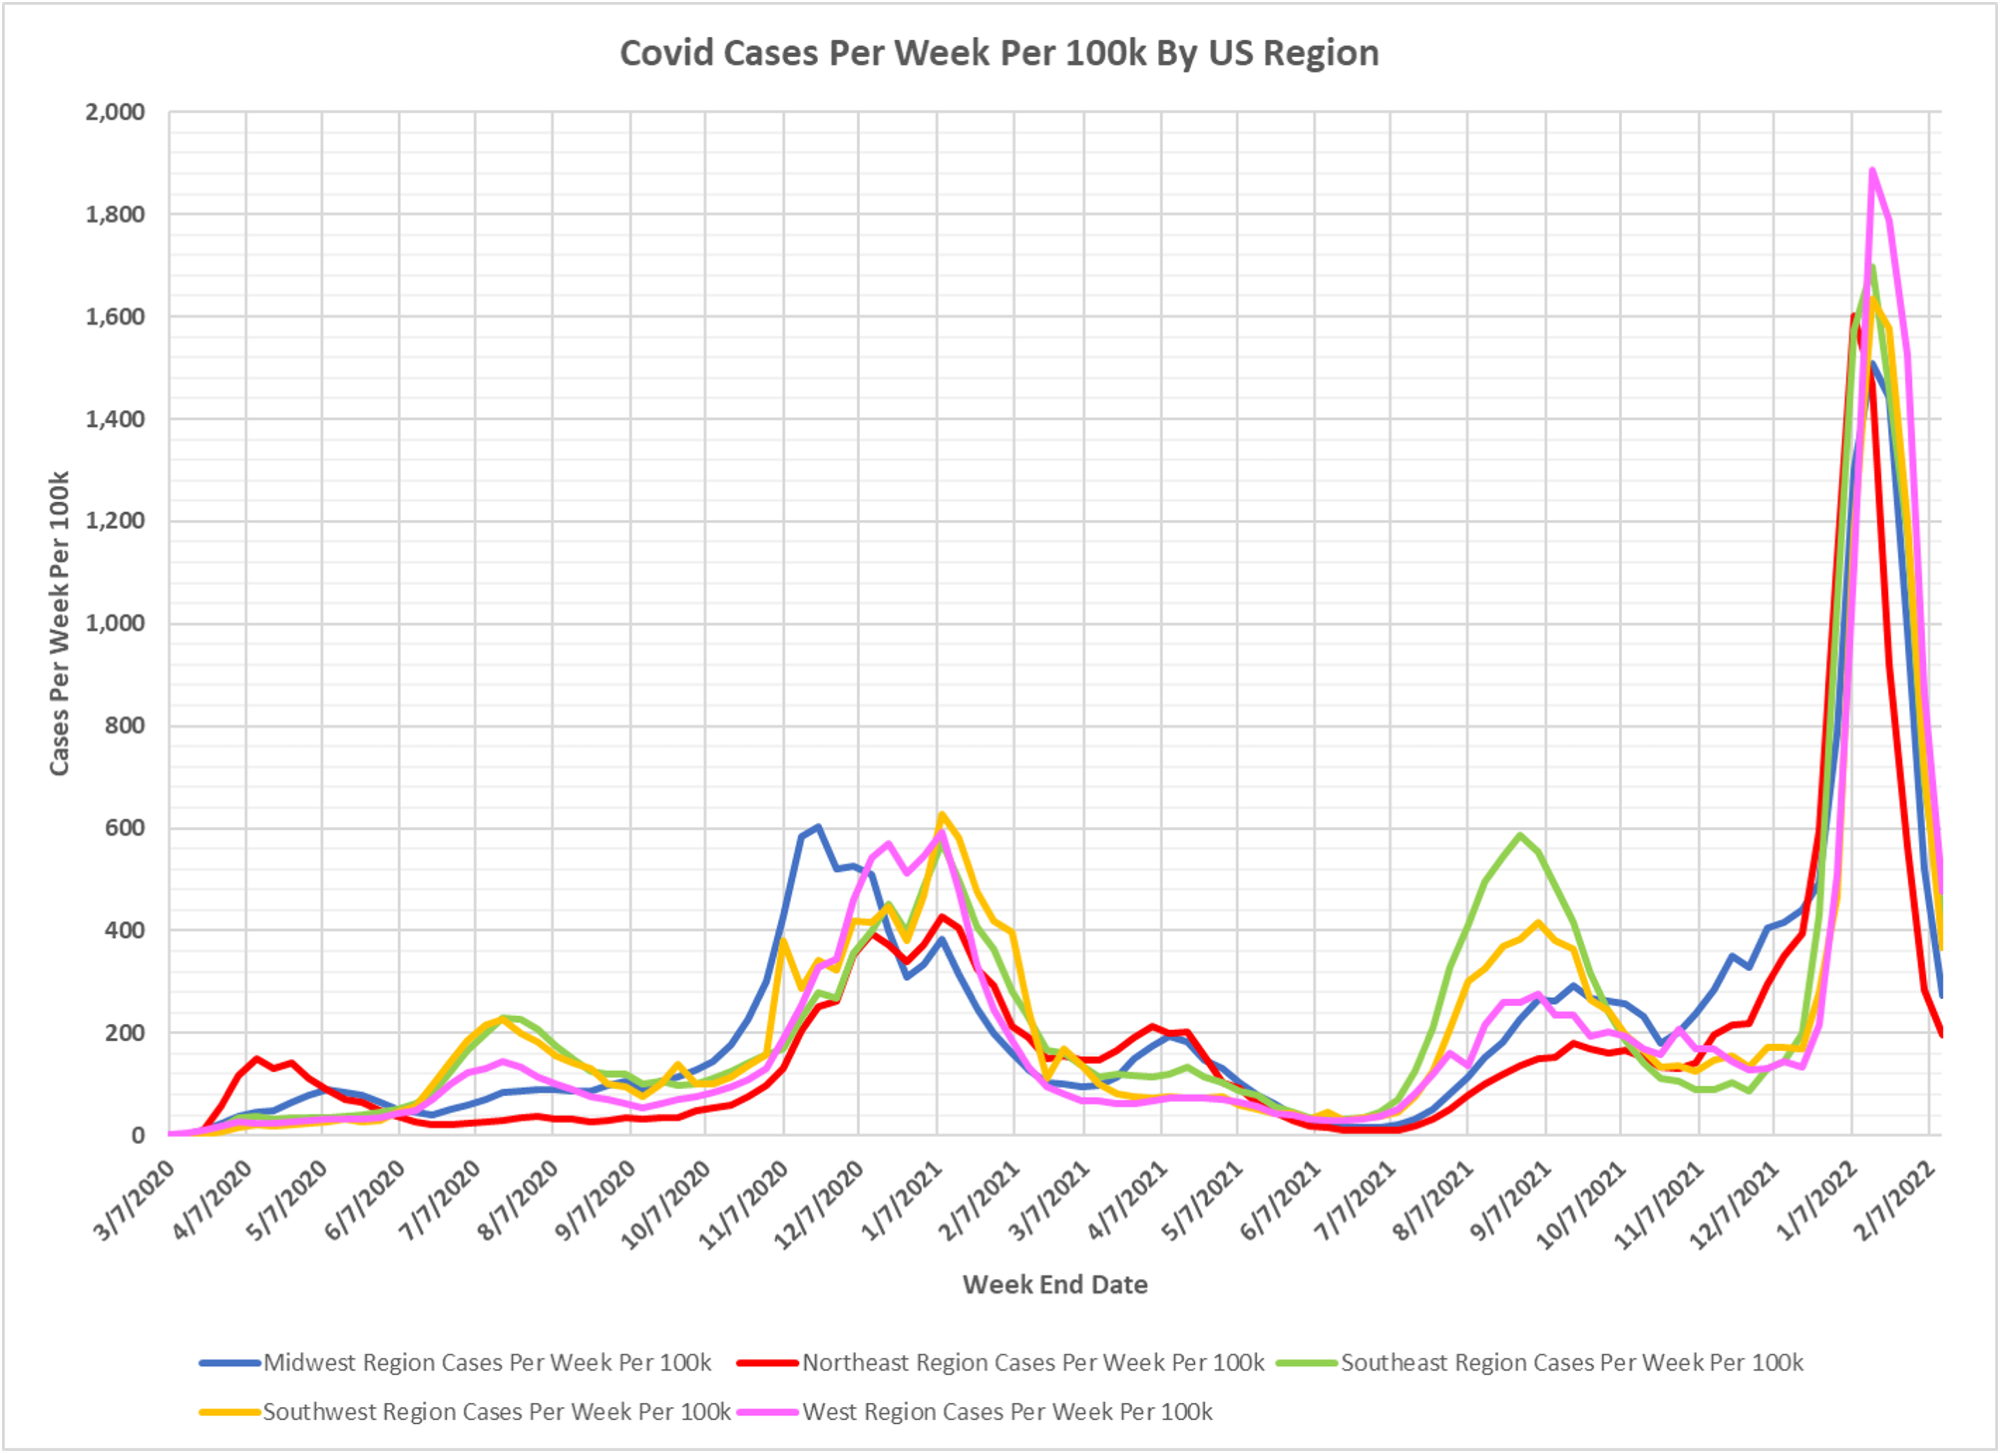
- The chart of US regional cases displays the entire pandemic. The animation of cases per week per 100k starts the week ending 7/03/2021.
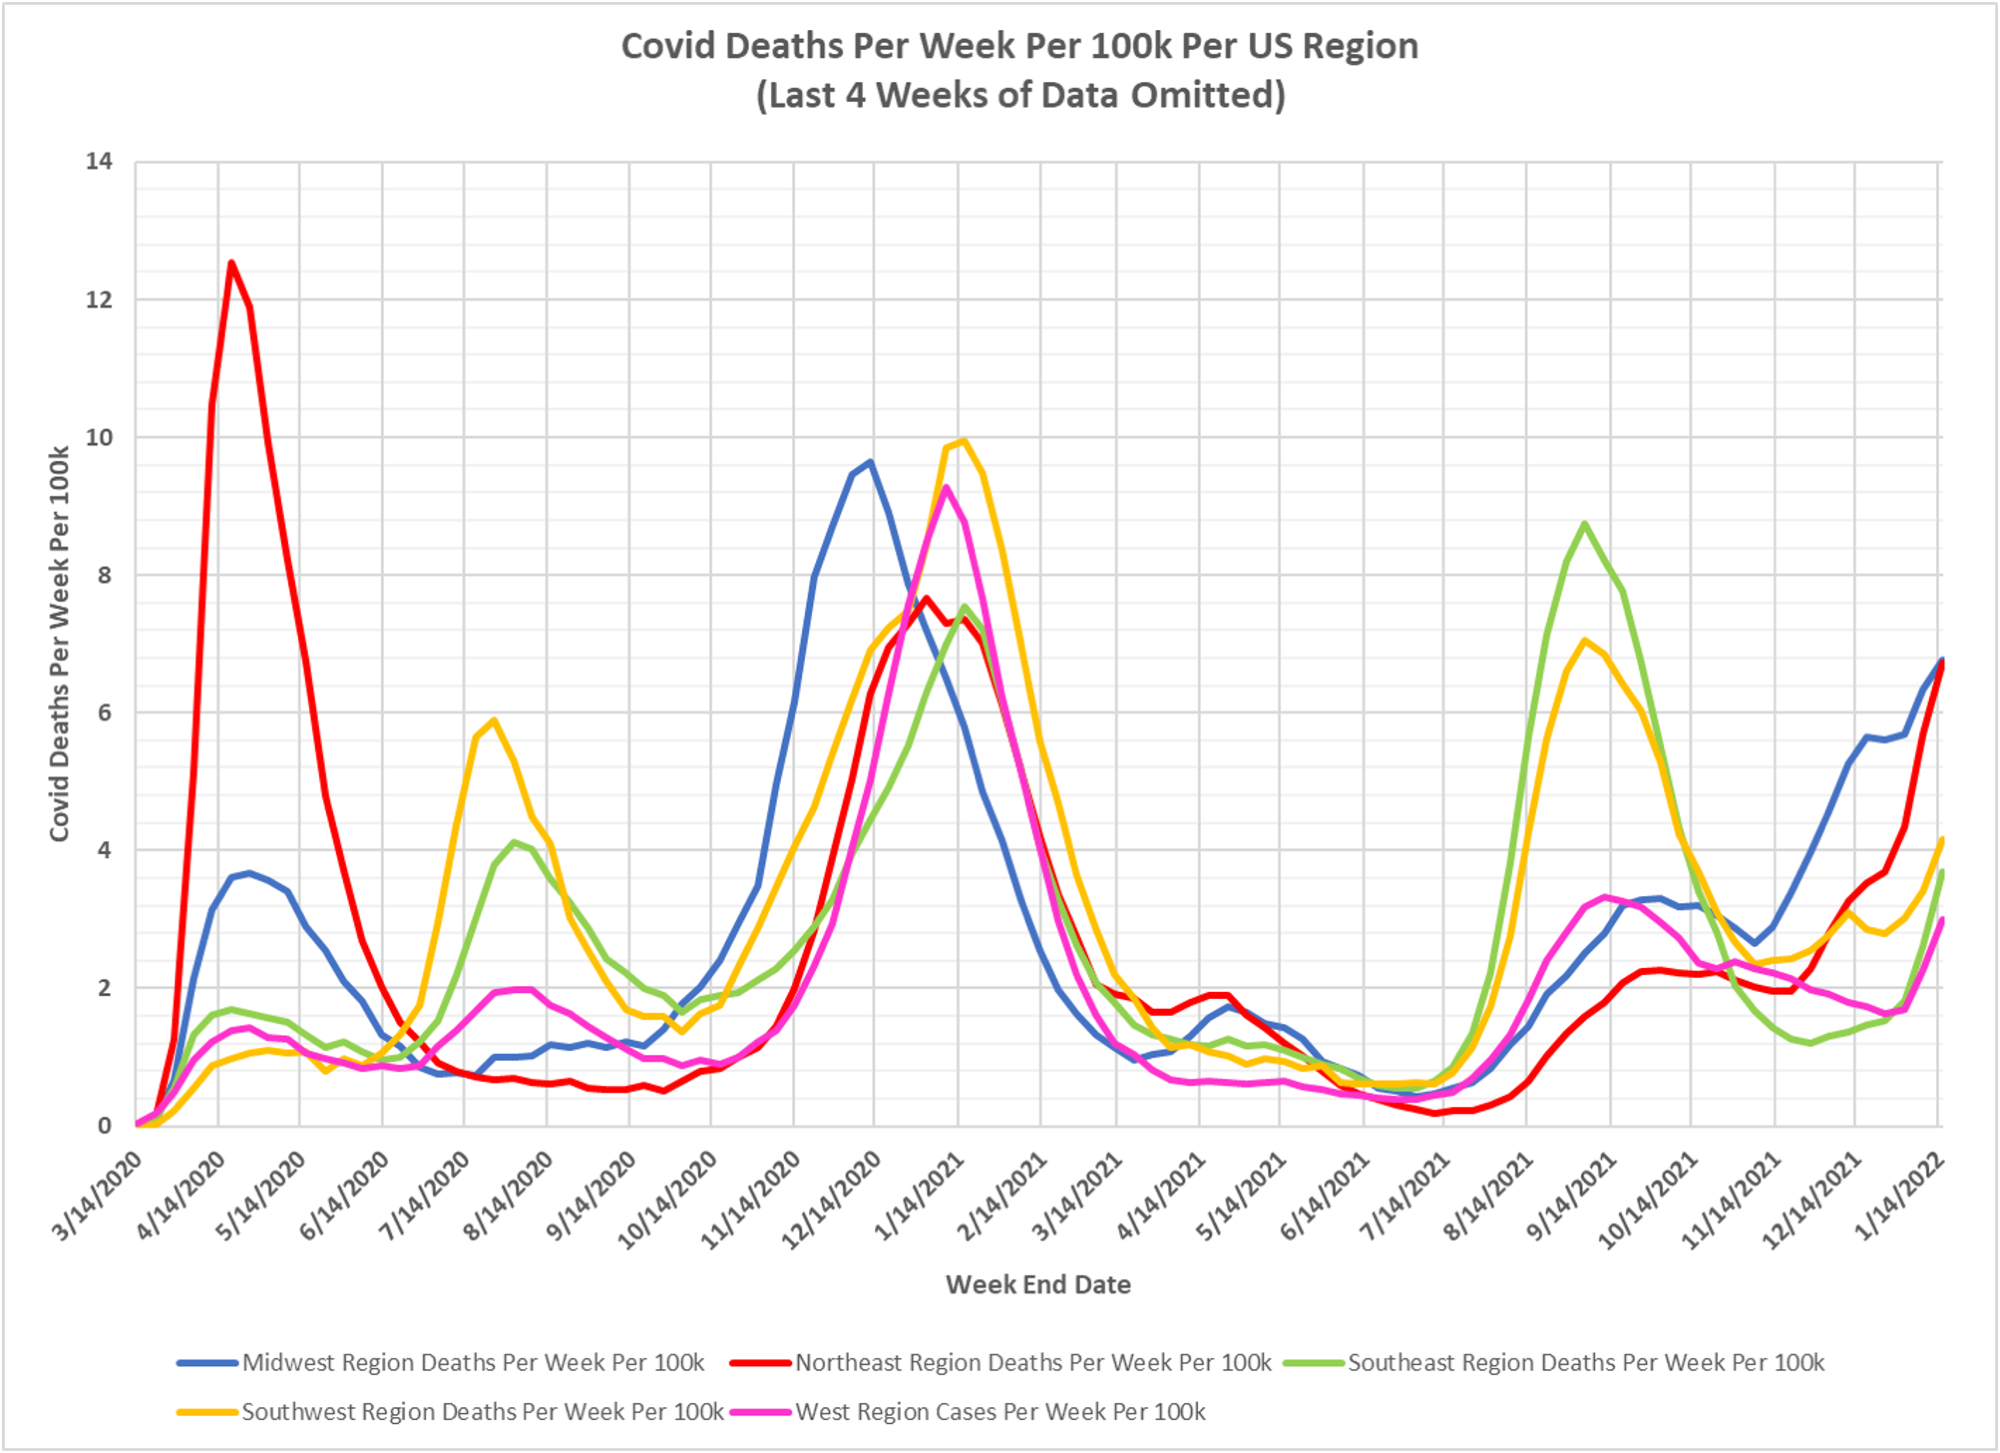
- US case data by state is taken from a CDC data base: https://data.cdc.gov/Case-Surveillance/United-States-COVID-19-Cases-and-Deaths-by-State-o/9mfq-cb36 , This data base appears to be corrupted, especially for California, in early 2021. Therefore, all data for all states prior to 8/1/2021 is the version published by the CDC on 10/24/2021. All data starting 8/1/2021 is the most current available data, published by the CDC on 2/18/2022, plotted to 2/12/2022. Deaths are plotted to 1/15/2022. Omitting the last 4 weeks of data due to incomplete reporting.
- State population estimates used to calculate rates per 100k are taken from the CDC data file nst-est2019-01.xlsx, available here: https://www.census.gov/newsroom/press-kits/2019/national-state-estimates.html
- Cases per 100k have peaked are and declining rapidly in all regions. The West region peaked latest and highest, despite a perception of stricter interventions. Differences in testing rates can also impact the cases per 100k as well.
- Regional death rates can be seen to be rising, but not in proportion to cases. Because of the lag in reporting deaths by the CDC, it is not known at this time what the peak regional deaths rates for the Omicron surge will be.
- The animation of state case rates starts for the week ending 7/03/2021. In the Fall of 2021 we can see the prior seasonal effect, with the Midwest having higher case levels in November and December. As Omicron became dominant the prior geographical trends were completely overwhelmed as cases everywhere rose rapidly and at similar rates and times.