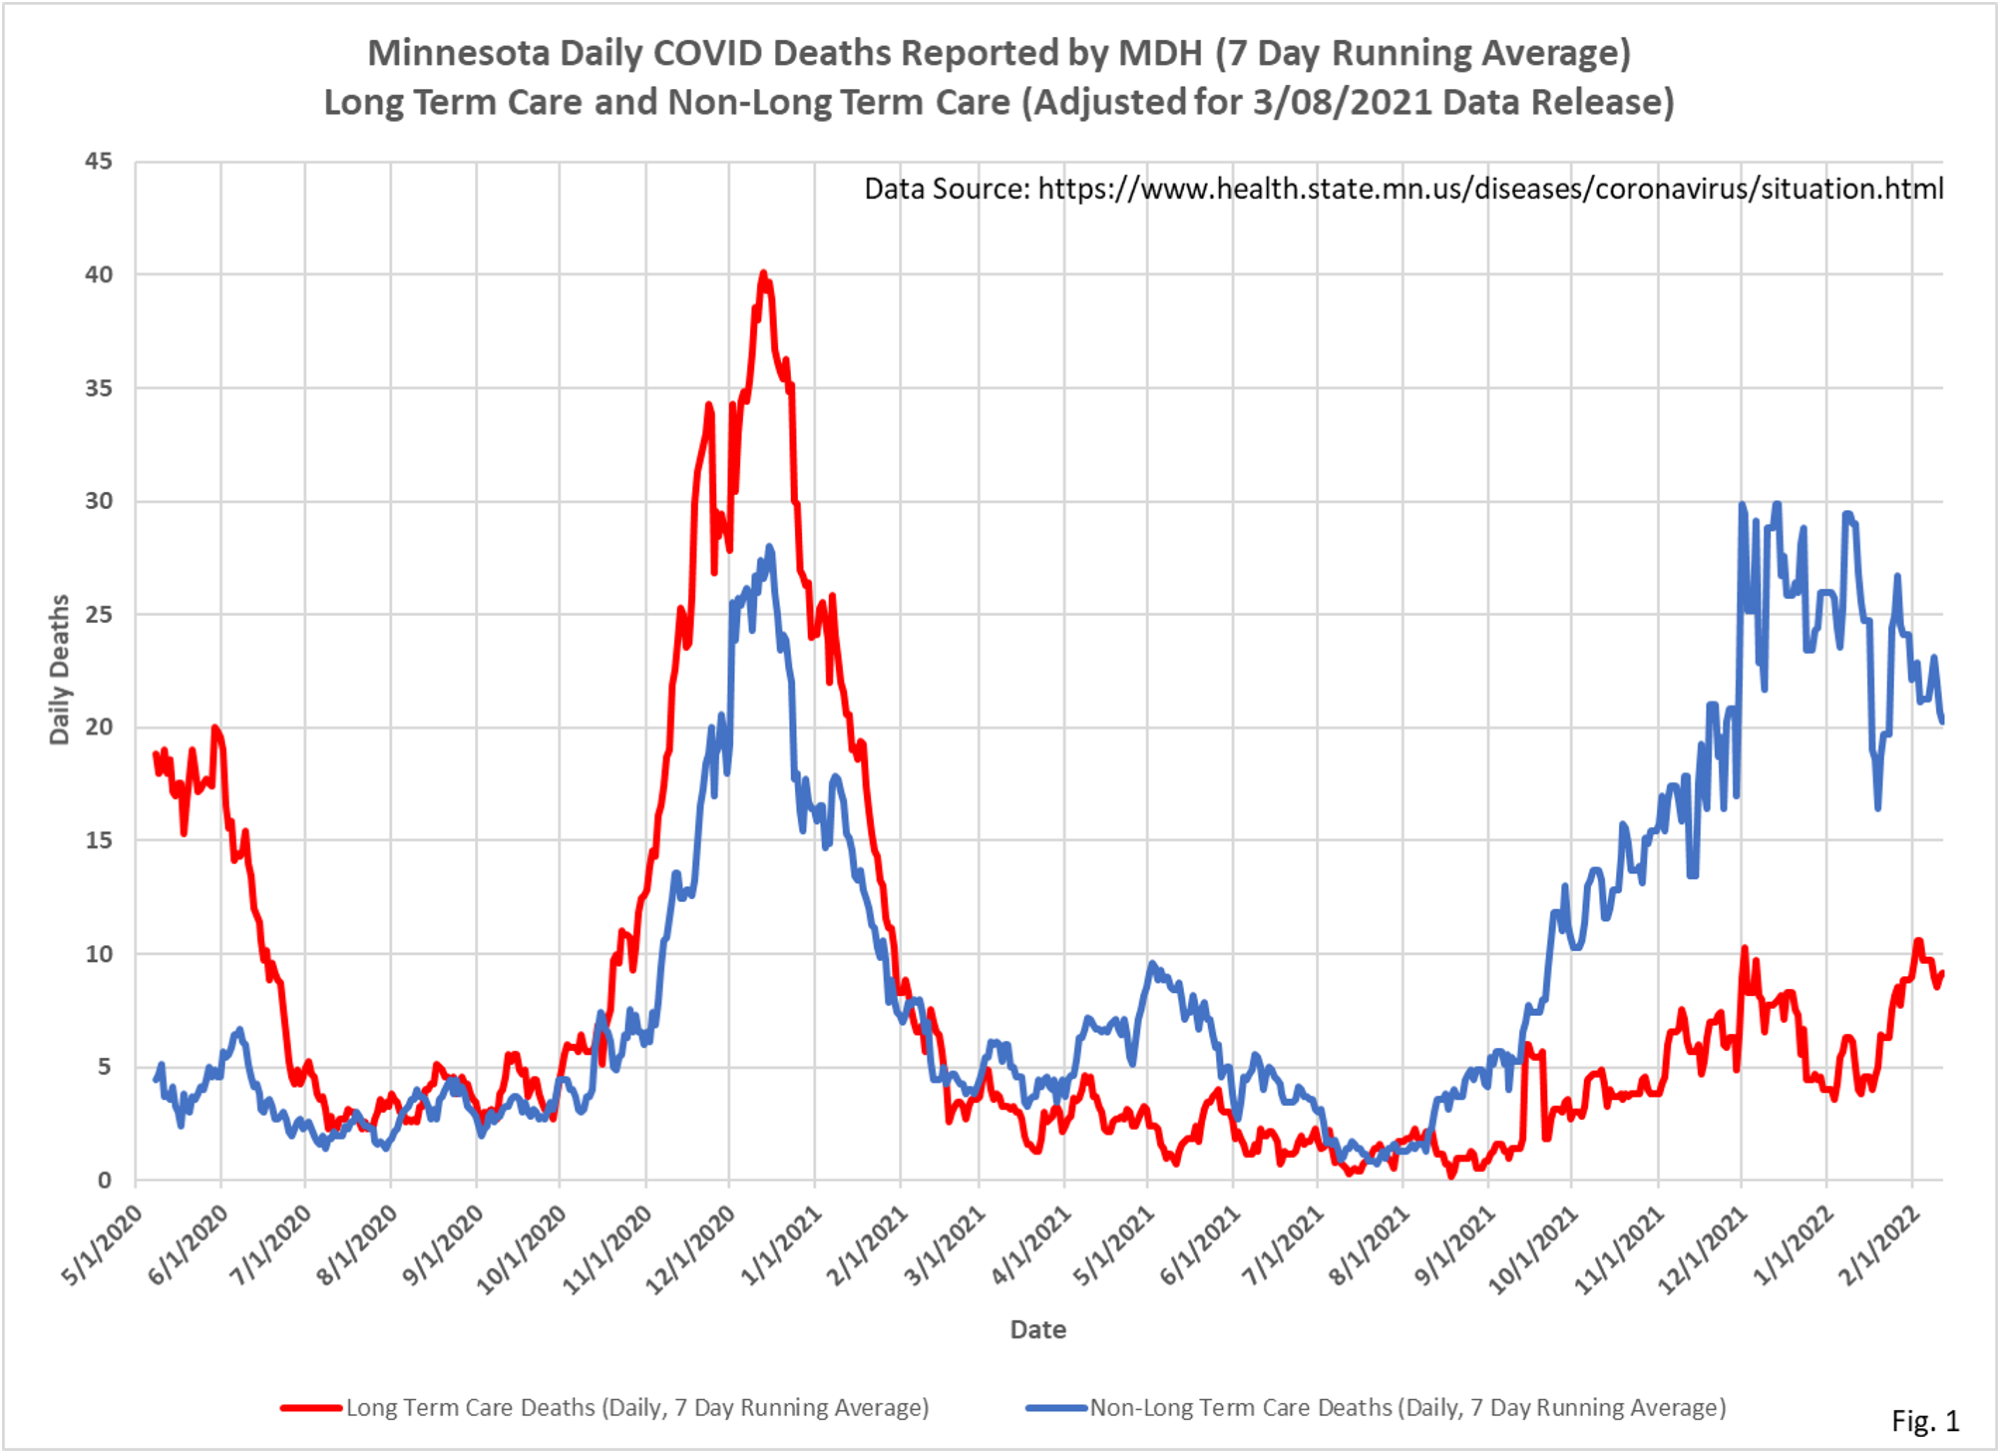
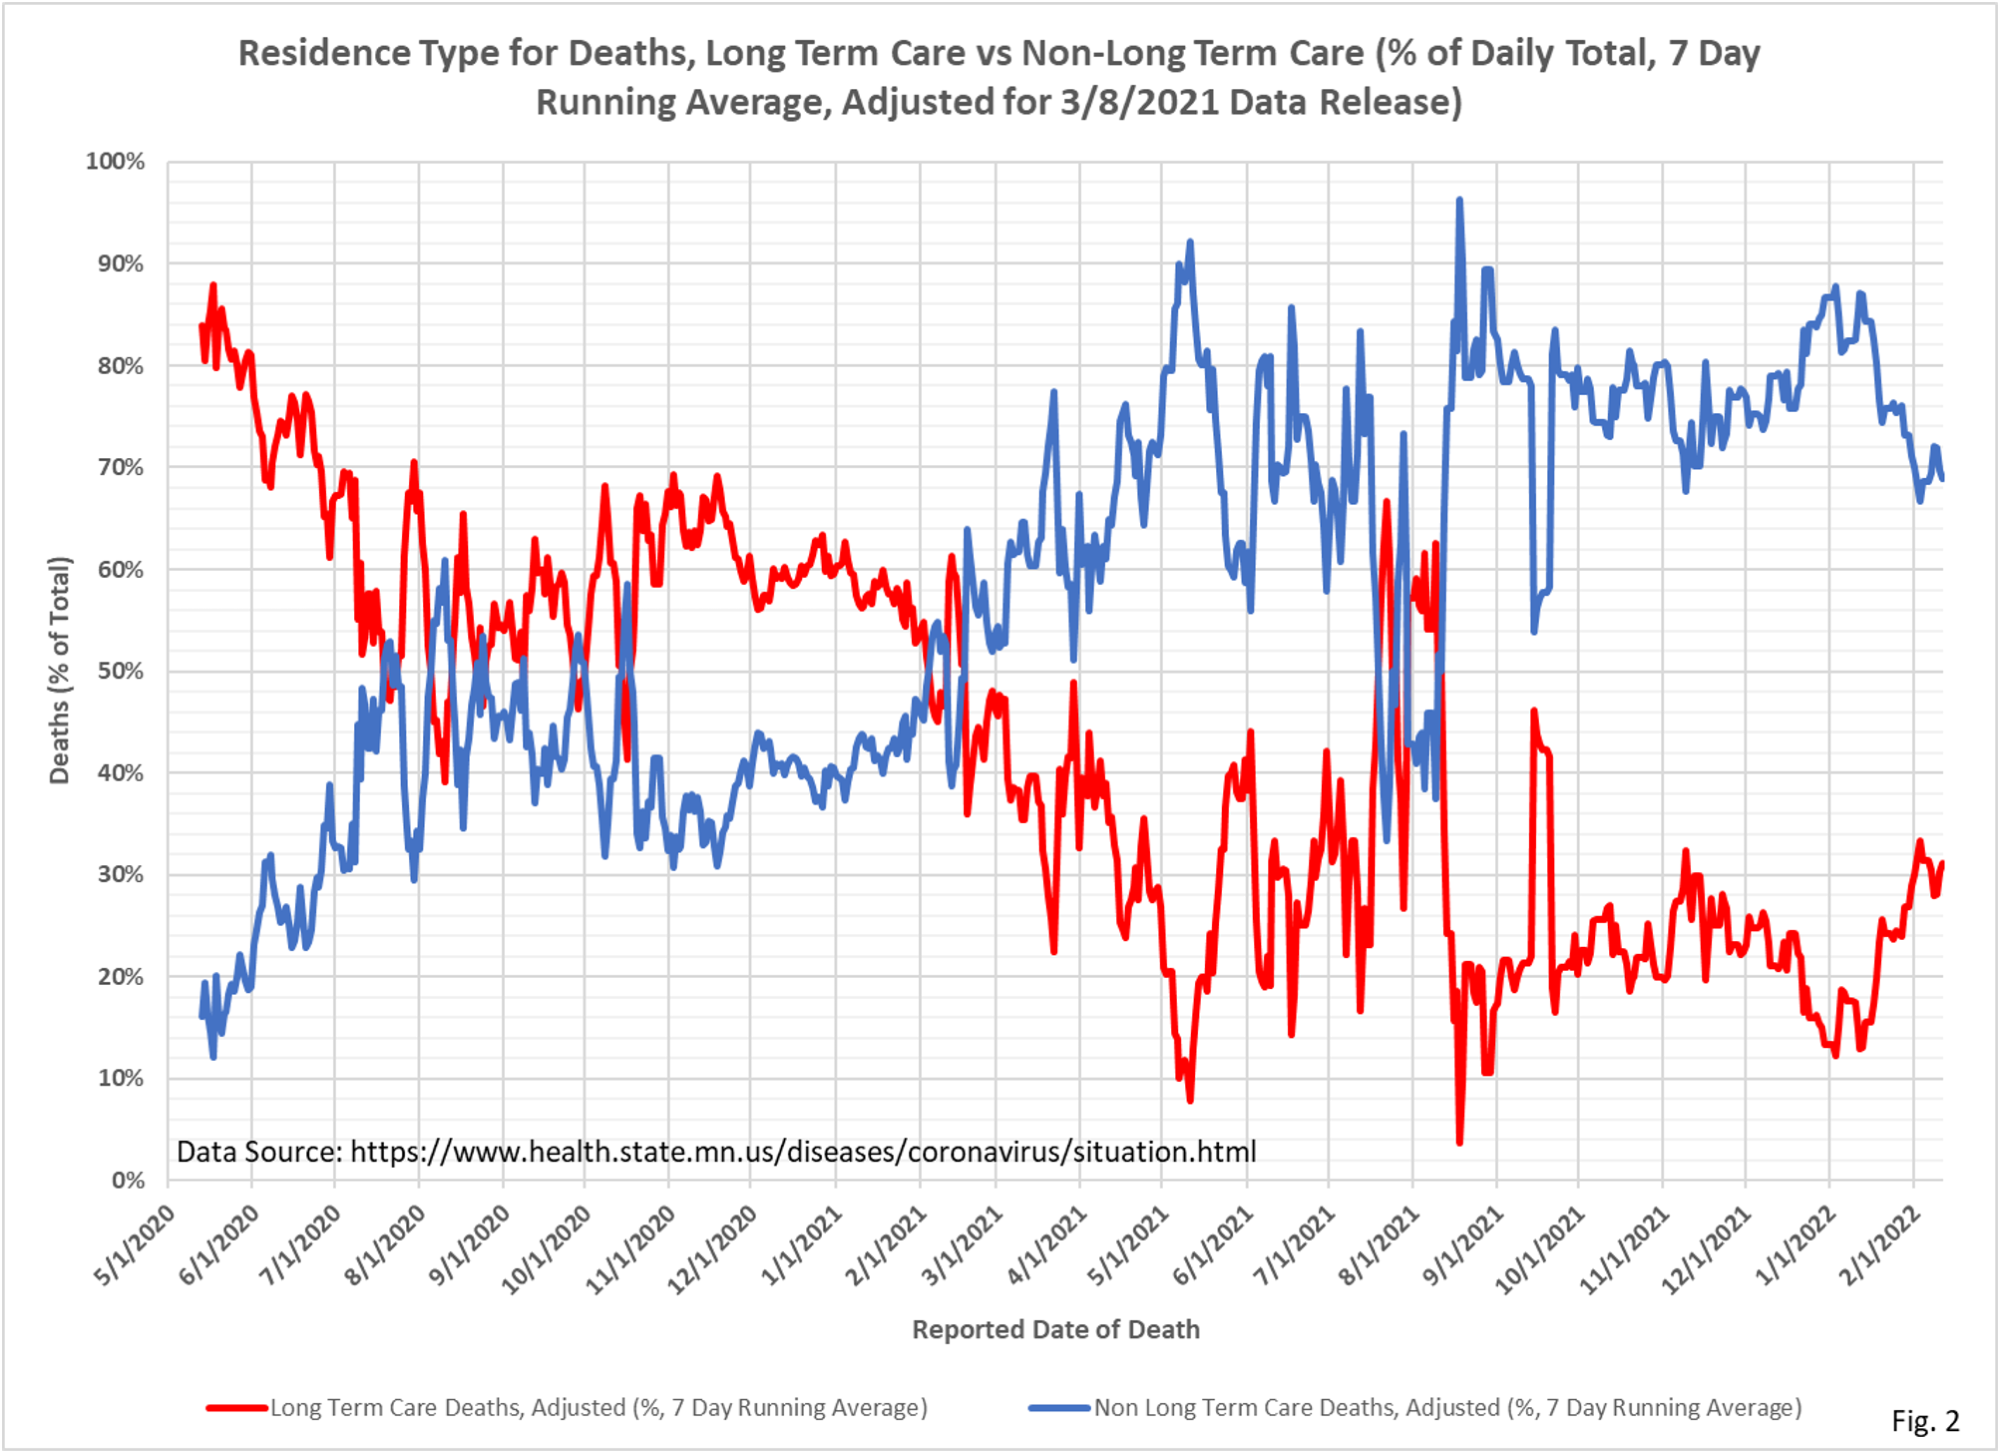
It is interesting to look at this chart and it likely shows a couple of things. One is that early on, the frail elderly really bore the vast bulk of the serious illnesses and deaths. In the summer of 2020, the whacko death attribution methods go into effect an a lot of deaths start being called CV-19 in the general population. In the winter with a more serious case wave, LTC deaths begin moving up as a percent. As vaccines began rolling out, with the emphasis on the elderly, you see the switch from the vast majority of deaths down to a minority of deaths, which takes place fairly quickly. This change is largely due to vaccines, with some potential affect from depletion of the vulnerable elderly pool. But as vaccine effectiveness waned, you see the relative proportion begin to creep back up again, with an interruption by booster rollout, which disappears in the Omicron wave. As CV-19 recedes in the background, the proportion would return to what is was early on, if we stop with the crazy death attribution.