Plummeting to very low levels, for anyone but DOH and the epi-terrorists. Dave’s notes:
1. Active cases are a theoretical measure of how many infectious people may be in Minnesota at any one time. Active cases are calculated as the cumulative number of positive cases minus the cumulative number of people No Longer Needing Isolation (NLNI) minus cumulative deaths. All of this data is available on the Minnesota Situation Update for COVID-19 web page https://www.health.state.mn.
2. Minnesota Department of Health (MDH) defines No Longer Needing Isolation this way on the Situation Update web page: “Cases no longer needing isolation represents individuals with confirmed or probable COVID-19 who no longer need to self-isolate”. MDH defines PCR test results as “Confirmed” and antigen test results as “Probable”.
3. On 11/17/2020 we asked MDH how they determined the number of people No Longer Needing Isolation. They informed us on 11/30/2020 that people are No Longer Needing Isolation when 1) It is 10 days past the onset of illness, 2) They have been fever free for 24 hours, and 3) Their respiratory symptoms are improving. Since this reply was received we have not inquired further.
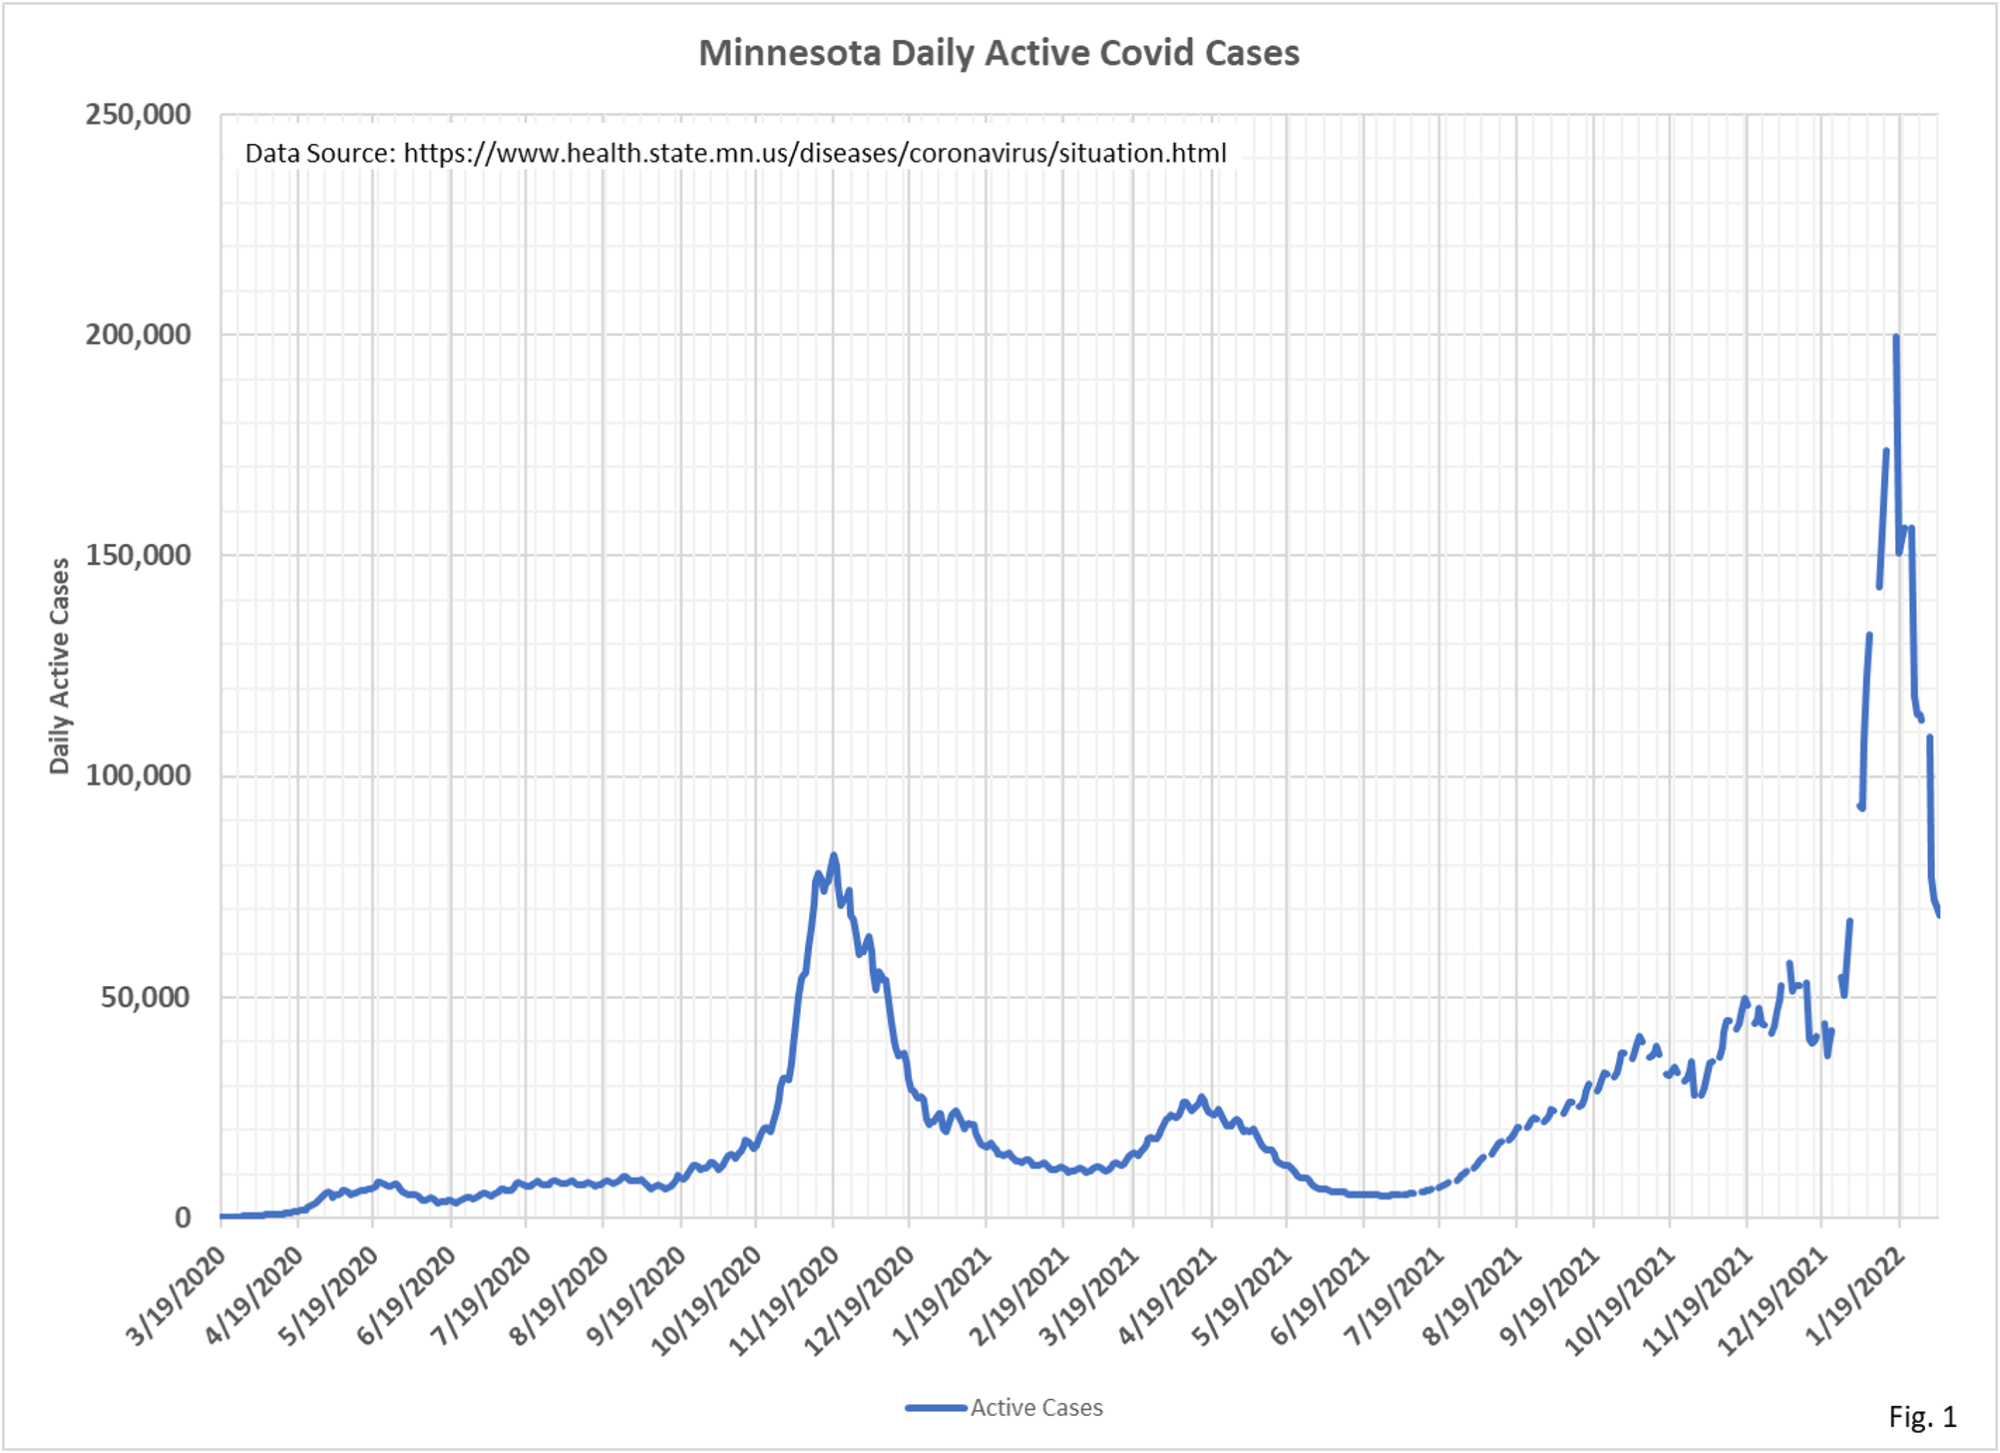
4. Fig. 1, Active Cases: Active cases peaked at 199,529 on 1/18/2022, revised from the 1/18 peak of 193,555 active cases we reported on 2/4/2022. The peak in active cases has risen, but the date has not moved, in response to MDH processing the backlog of case reports.
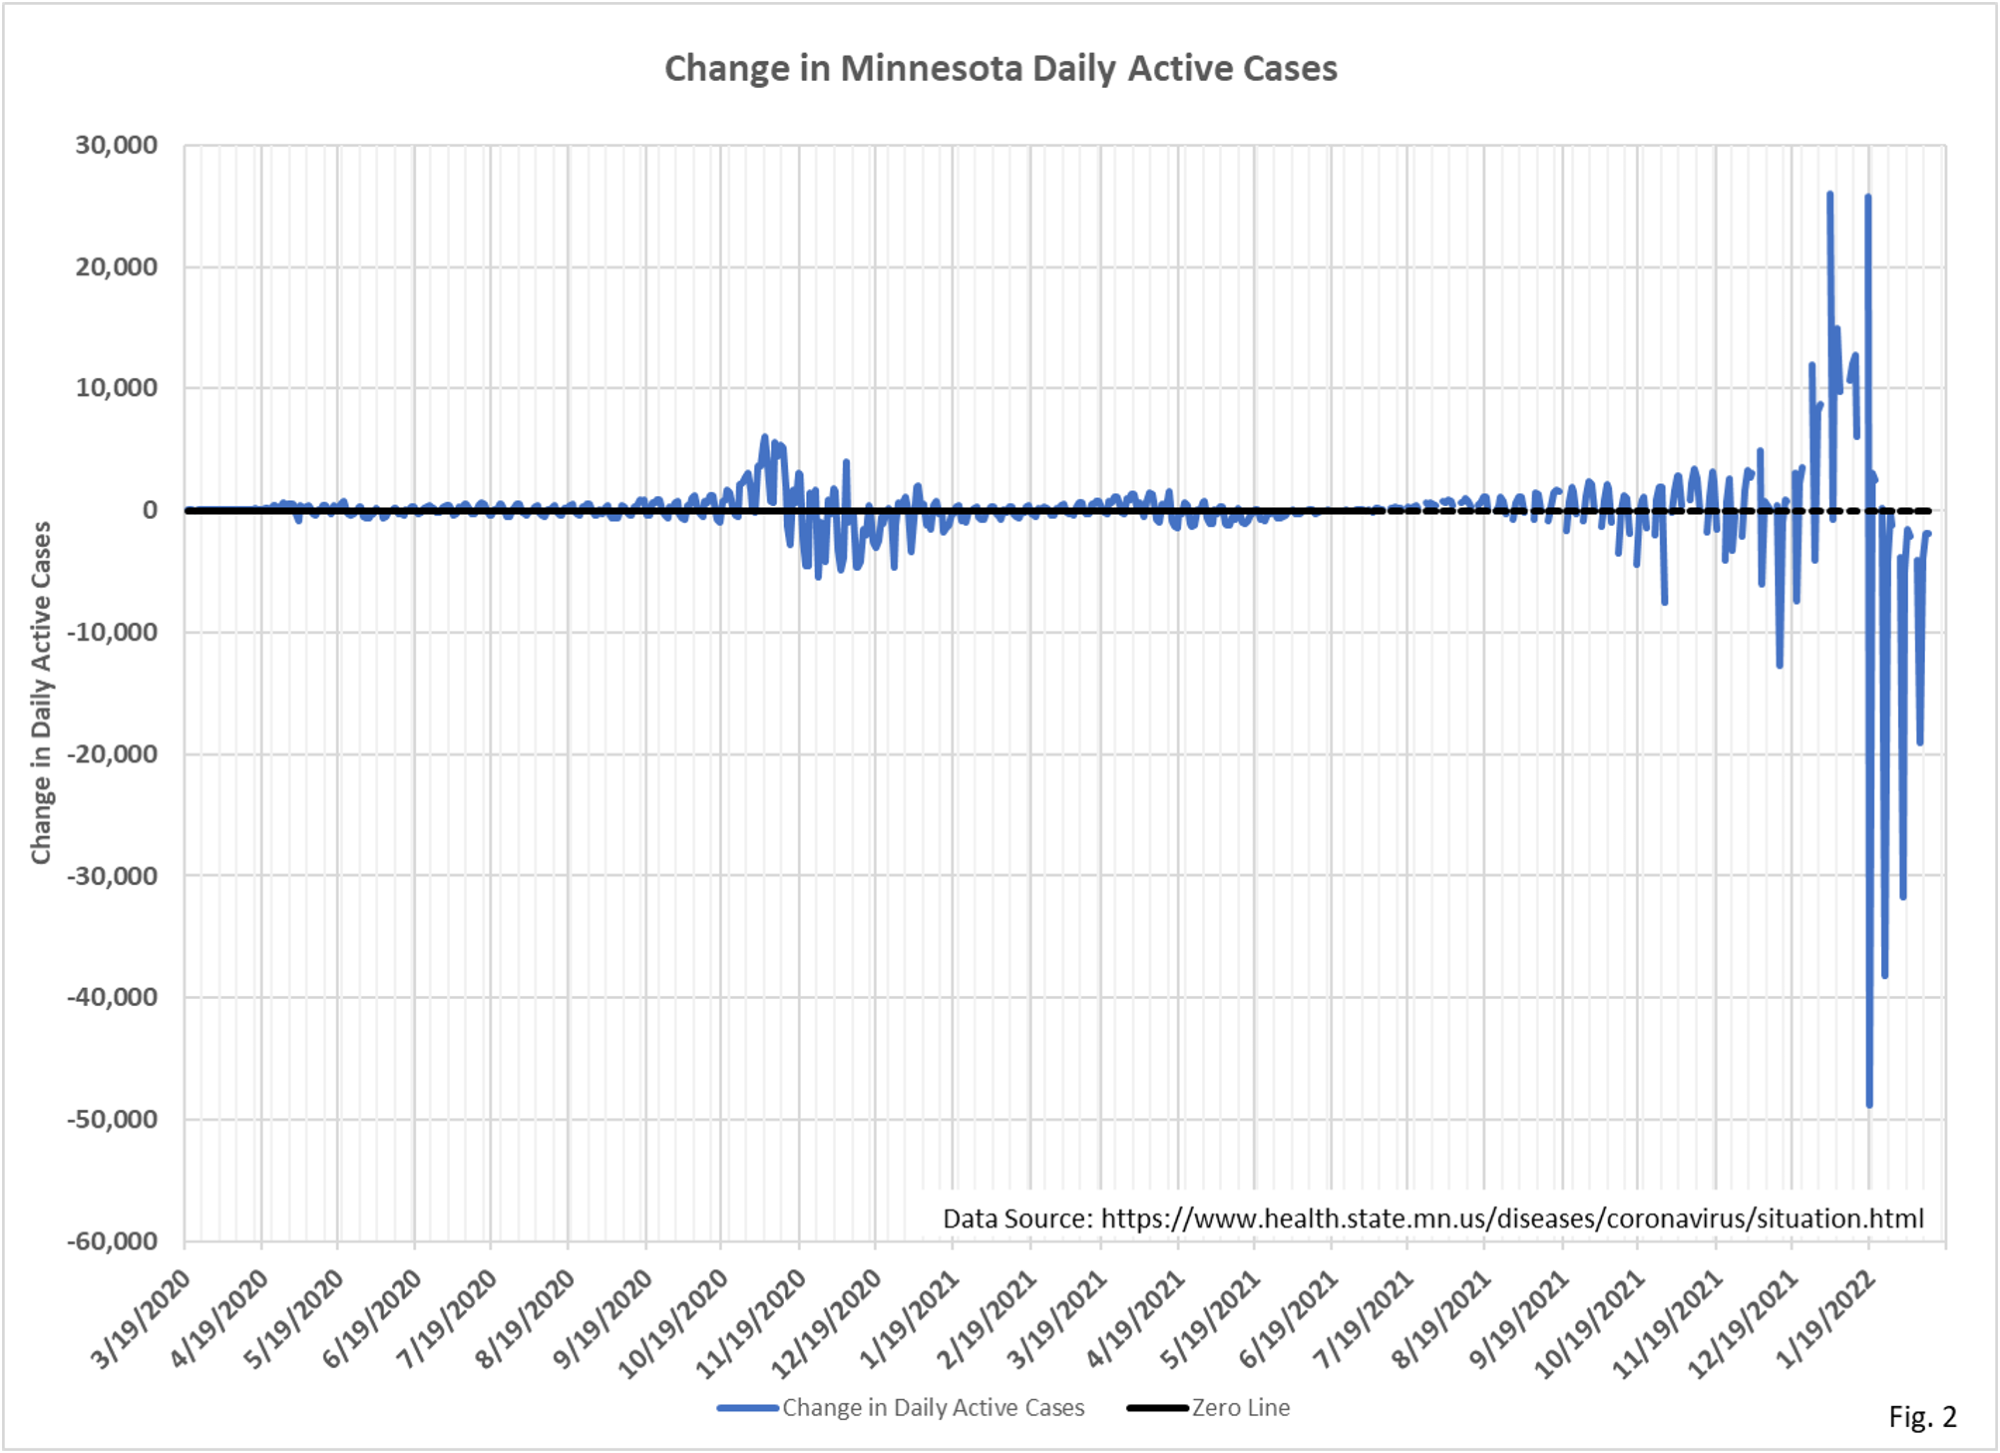
5. Fig. 2, Change in Daily Active Cases: The change in Active Cases can be seen to be dominated by the drop of 44,794 cases on 1/19/2022, and the large weekly drops since then. While new daily cases are updated on each date as case reports are evaluated, the NLNI totals are not updated after the fact.
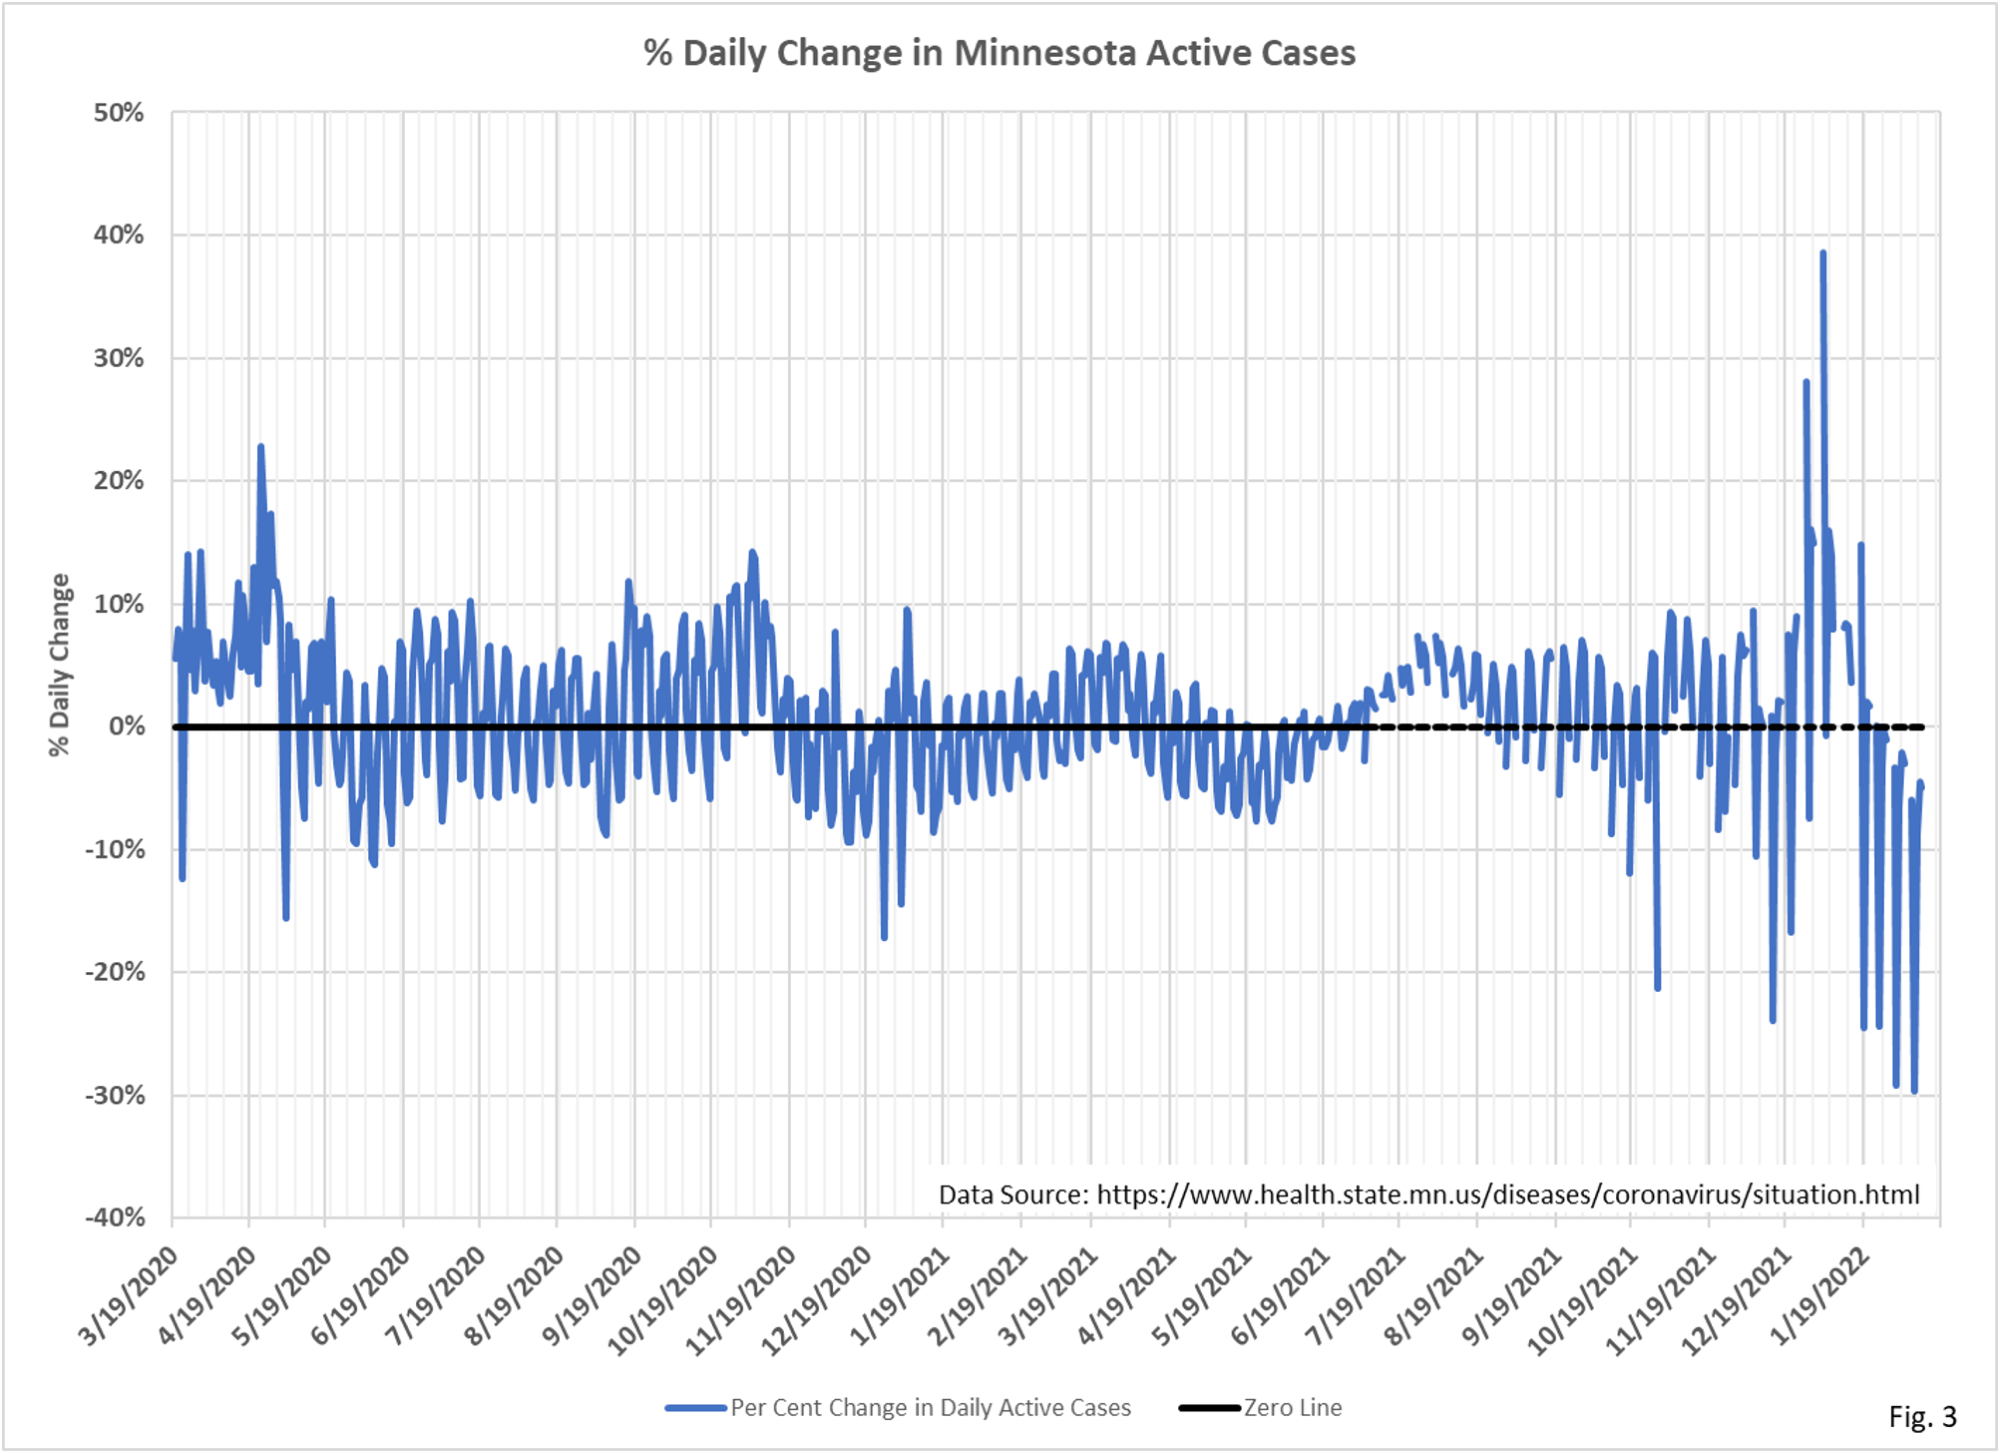
6. Fig. 3, Percent Change in Daily Active Cases: The percent change in daily active cases is simply the change in active cases divided by the previous days active cases. The percent change on 1/19/2022 looks more proportional when it is considered as a percent change, and looks less out of place on this chart.
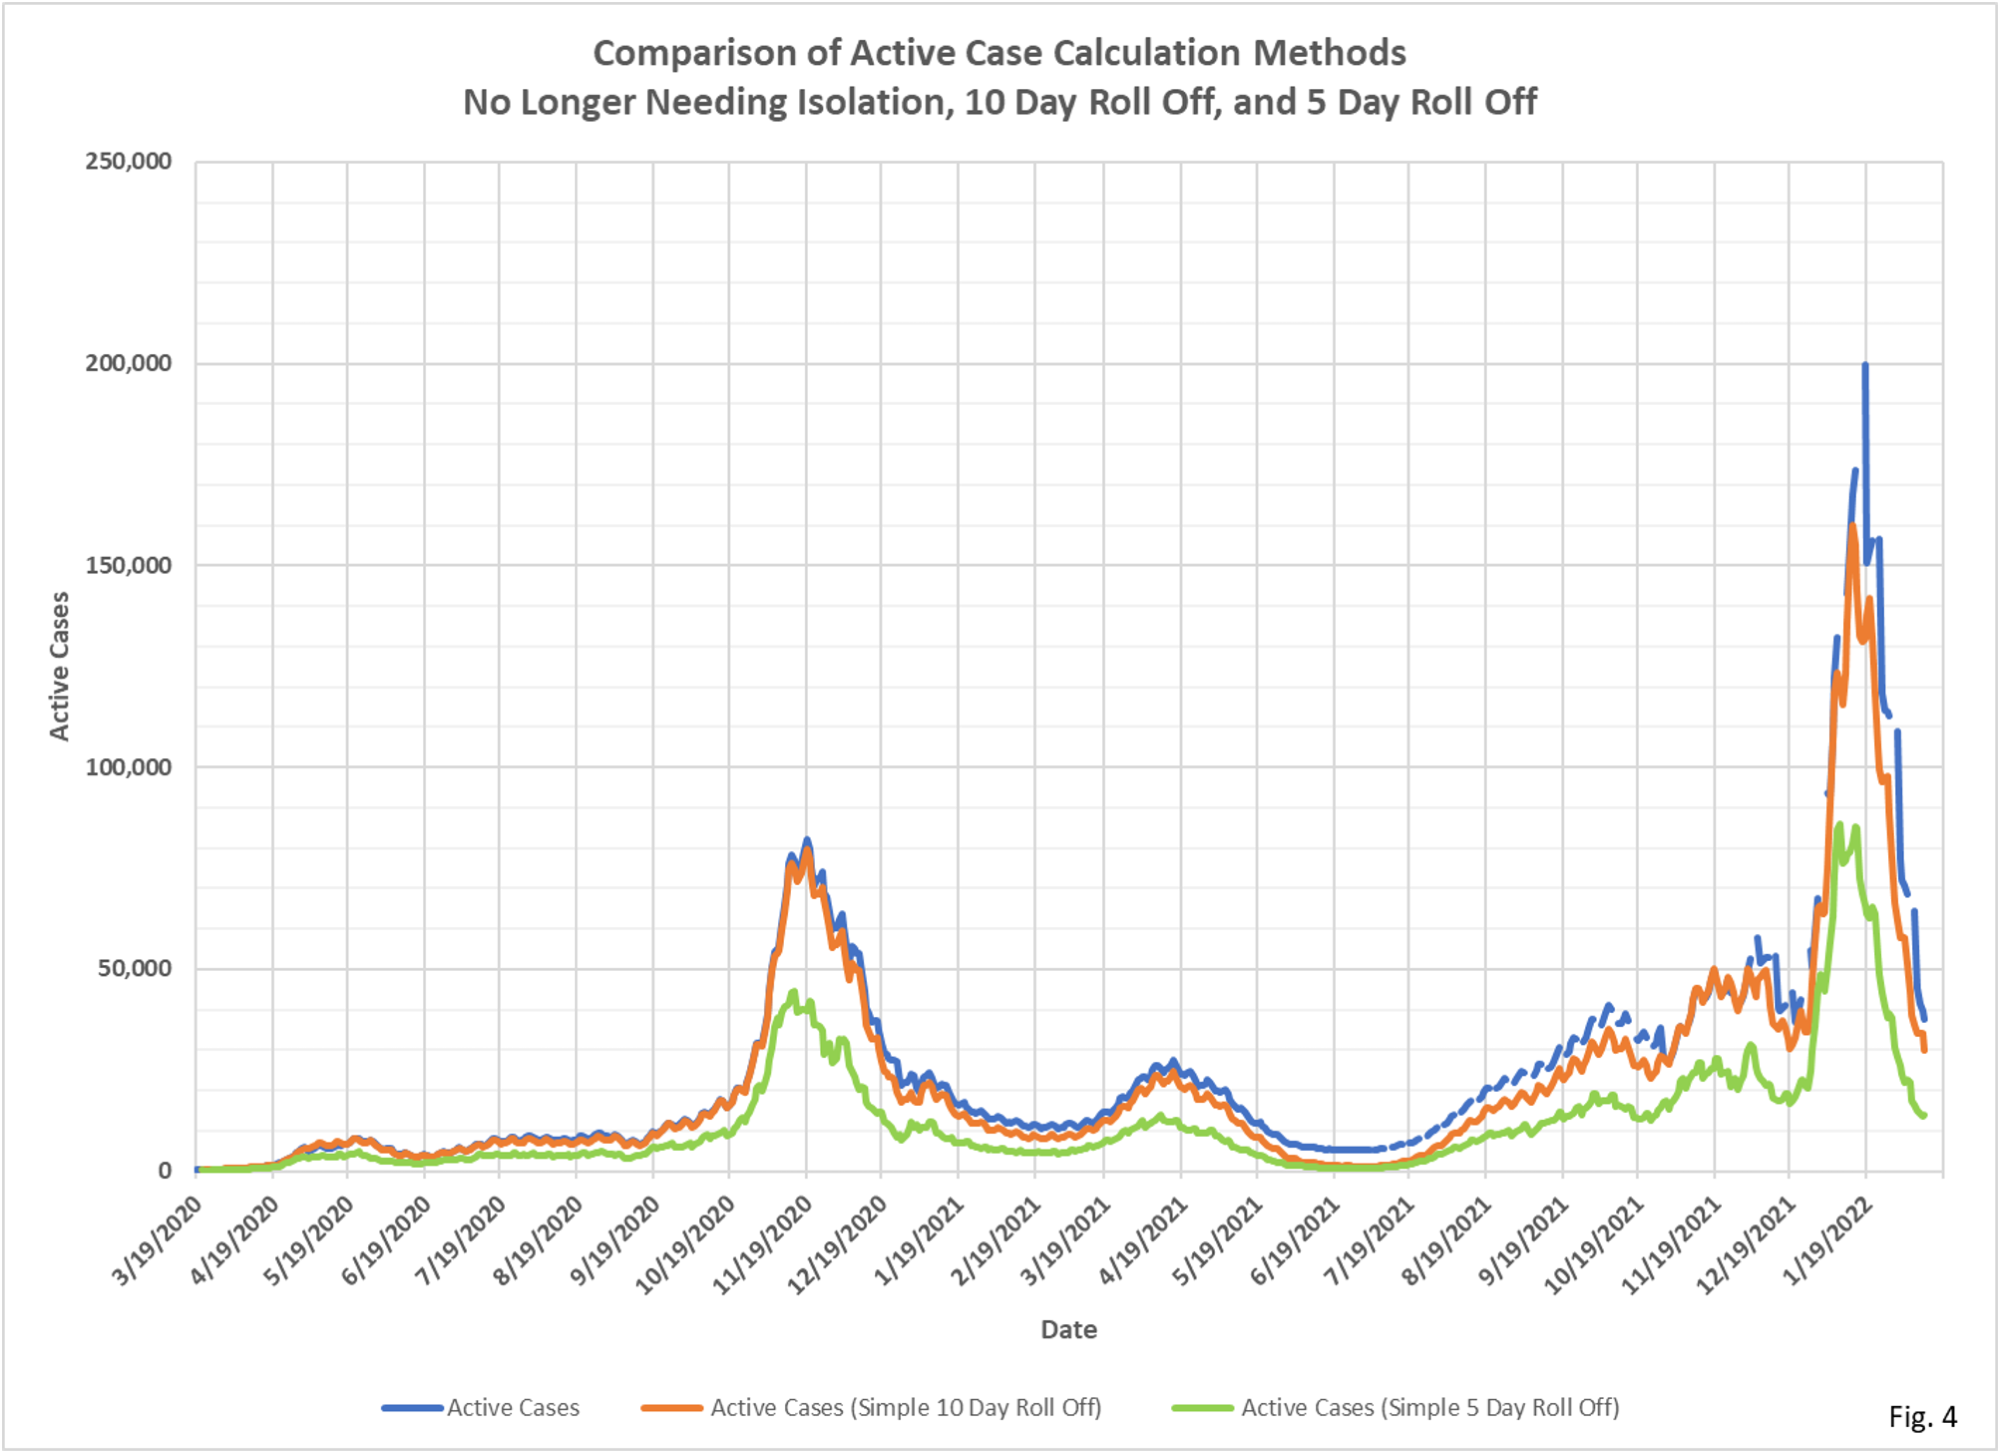
7. Fig. 4, Comparison of Active Case Calculation Methods: The active case curve in blue is the same curve shown in Fig. 1, calculating active cases using the NLNI statistic. If MDH was using a strict 10 day criteria to move people from Active to NLNI the blue active case curve would be identical to the red 10 day roll-off curve. Since the active case curve is higher we know that MDH must be applying other criteria than a simple 10 day roll-off. There also appears to be a small time shift between the active case curve and the 10 day roll-off curve, implying a lag in moving cases into NLNI status.

Mr Roche: it seems, from my interaction with Facuites, that the problem is there are not enough Americans who have been jabbed. Vaccines, according to them, are needed for herd immunity and will reduce the likelihood of variants. From what i’ve read this assertion is tenuous at best – it is also a shift in the argument for vaccine mandates and shows a very disjointed understanding of herd immunity with respiratory viruses. My understanding is that vaccines reduce the probability of death and hospitalization from severe illness. Do you have a comment on vaccines and herd immunity or is it just too soon to know? Thank you
Thanks again for all the work explaining this stuff. And it looks like Scotland has gone your DHS one better on data reporting.