Dave got a new file out of DOH a little while ago, which had more data on reinfections. He has used that file to produce the charts and information below on infections in the unvaccinated, the vaccinated and reinfections by age group. As Dave indicates, we still don’t know the overlap between those people who had a prior infection and who are vaxed, which has to be a pretty sizable group. And note that these are proportions of total events, one reason they are higher in younger age groups is that those age groups also are a greater proportion of the state’s total population. Dave’s notes:
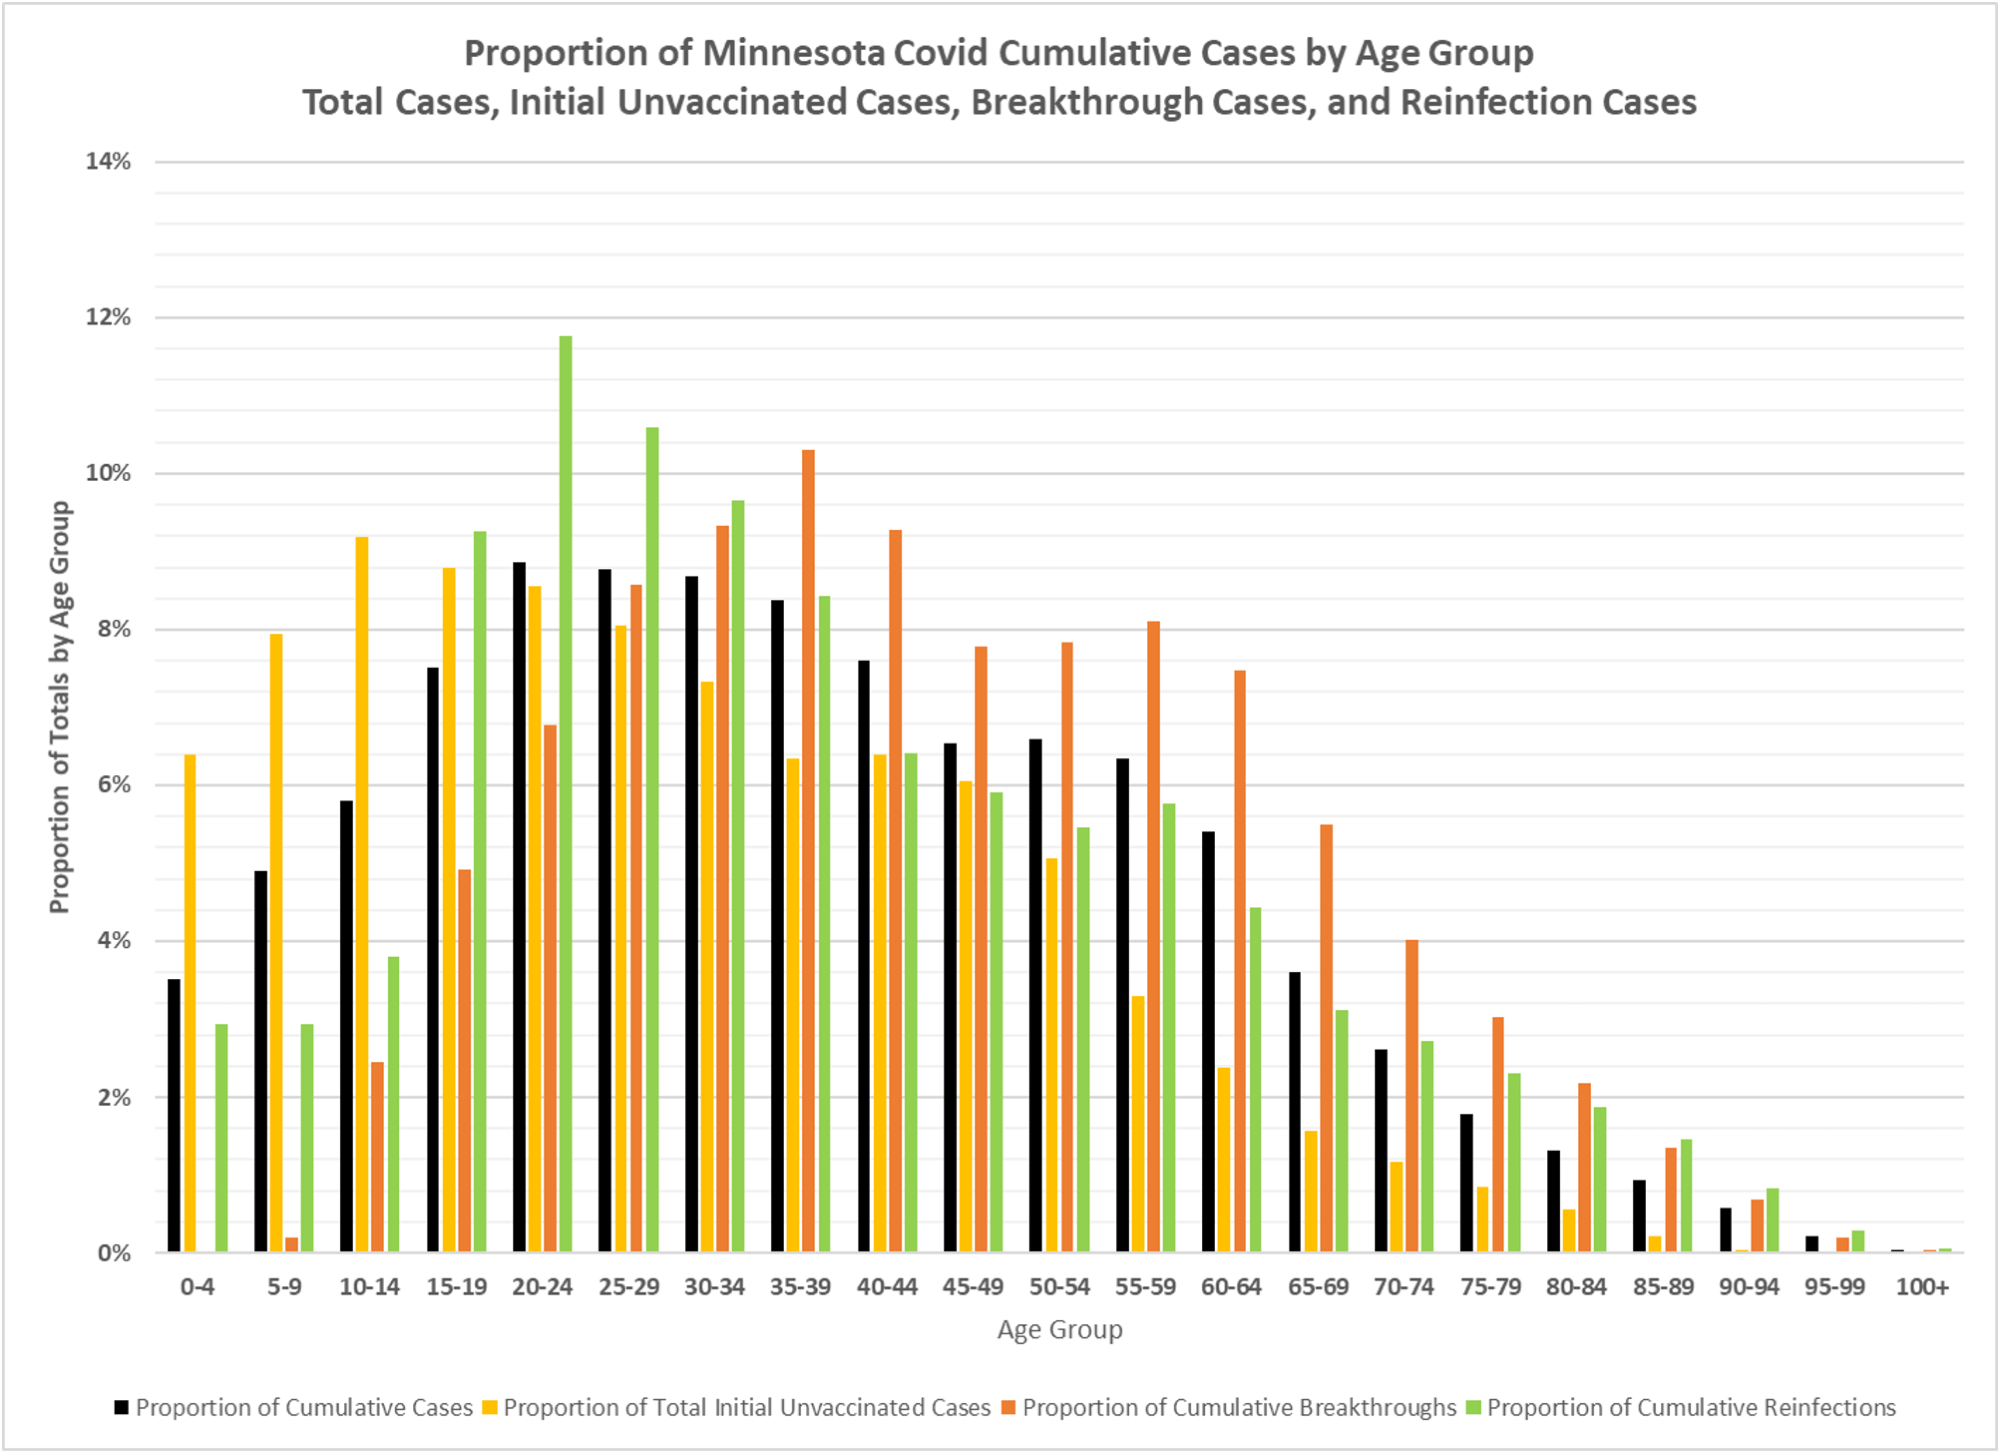
- The chart below displays the proportion of cumulative covid cases, initial unvaccinated cases (the first positive case for unvaccinated people), breakthrough cases (the first positive case for vaccinated people), and reinfections (second or more case for both vaccinated and unvaccinated people). These are cumulative proportions for the entire pandemic for Minnesota. Because the proportion of vaccinated people change over time the proportions of Covid cases will change over time. Reinfection rates will change over time as well as the pool of infected people available to be reinfected increases over time.
- Cases by age group over time are available as a data file published every Thursday with the Minnesota Weekly Report here: https://www.health.state.mn.
us/diseases/coronavirus/stats/ index.html . The breakthrough cases by age were provided to us through a Minnesota Data Practice Act request, last updated on 1/14/2022. The reinfection cases by age data was received for the first time on 1/14/2022 in response to a Data Practice Act request we submitted on 11/20/2021. From this data the initial unvaccinated cases were calculated as the total cases per age group per week minus the breakthrough cases per week per age group minus the reinfections per age group per week. From the weekly series the cumulative totals were computed, and then the proportion per age group. - The proportions of total cases by age group in black matches very well with the cumulative proportions by age published on page 22 of the Minnesota Weekly Report. The 20-24, 25-29, and 30-34 age groups have the highest proportions of total cumulative cases.
- The proportions of initial unvaccinated cases is shown in gold. Not surprisingly the unvaccinated cases skew younger than the total cases, since the unvaccinated population skews younger as well.
- The proportion of breakthrough cases is shown in orange. Also not surprisingly the breakthrough infections tend to be older, similar to the age distribution of the vaccinated population.
- The new data here is the age distribution of reinfections, shown in green. The younger age groups appear to be greatly under-represented in the proportion of reinfection cases, while the 20 to 34 age groups and oldest age groups are over-represented.
- This data probably deserves a more sophisticated analysis than the simple cumulative proportions presented here. This analysis does raise further questions, such as whether or not reinfected people are vaccinated; or whether or not people who are vaccinated after an initial infection are more or less likely to be reinfected? These questions and others are likely subjects of future data practice act requests.