Interesting to look at the differences in some of the curve shapes and timing from year-to-year and wonder why. For example, look at the difference in ICU and Non-ICU hospitalizations. You have to suspect that ICU hospitalizations are much more likely to be real CV-19 cases, while the general hospitalizations have a high percentage of incidental cases. So ICU gives you a much more accurate picture. Dave’s notes:
- For this version of the yearly comparison charts the date axis is formatted to display from July 1 to June 30, for 20220-2021 and 2021-2022. Data before July 1, 2020 is not shown.
- For all charts the last 7 days of data is excluded to avoid charting incomplete data. Deaths reporting, however, is likely to be incomplete.
- All data is taken from the Minnesota Department of Health Situation Update for OCVID-19 web page https://www.health.state.mn.
us/diseases/coronavirus/ situation.html and from the Response and Preparation web page https://mn.gov/covid19/data/ response-prep/response- capacity.jsp. - All data is shown as 7 day running averages.
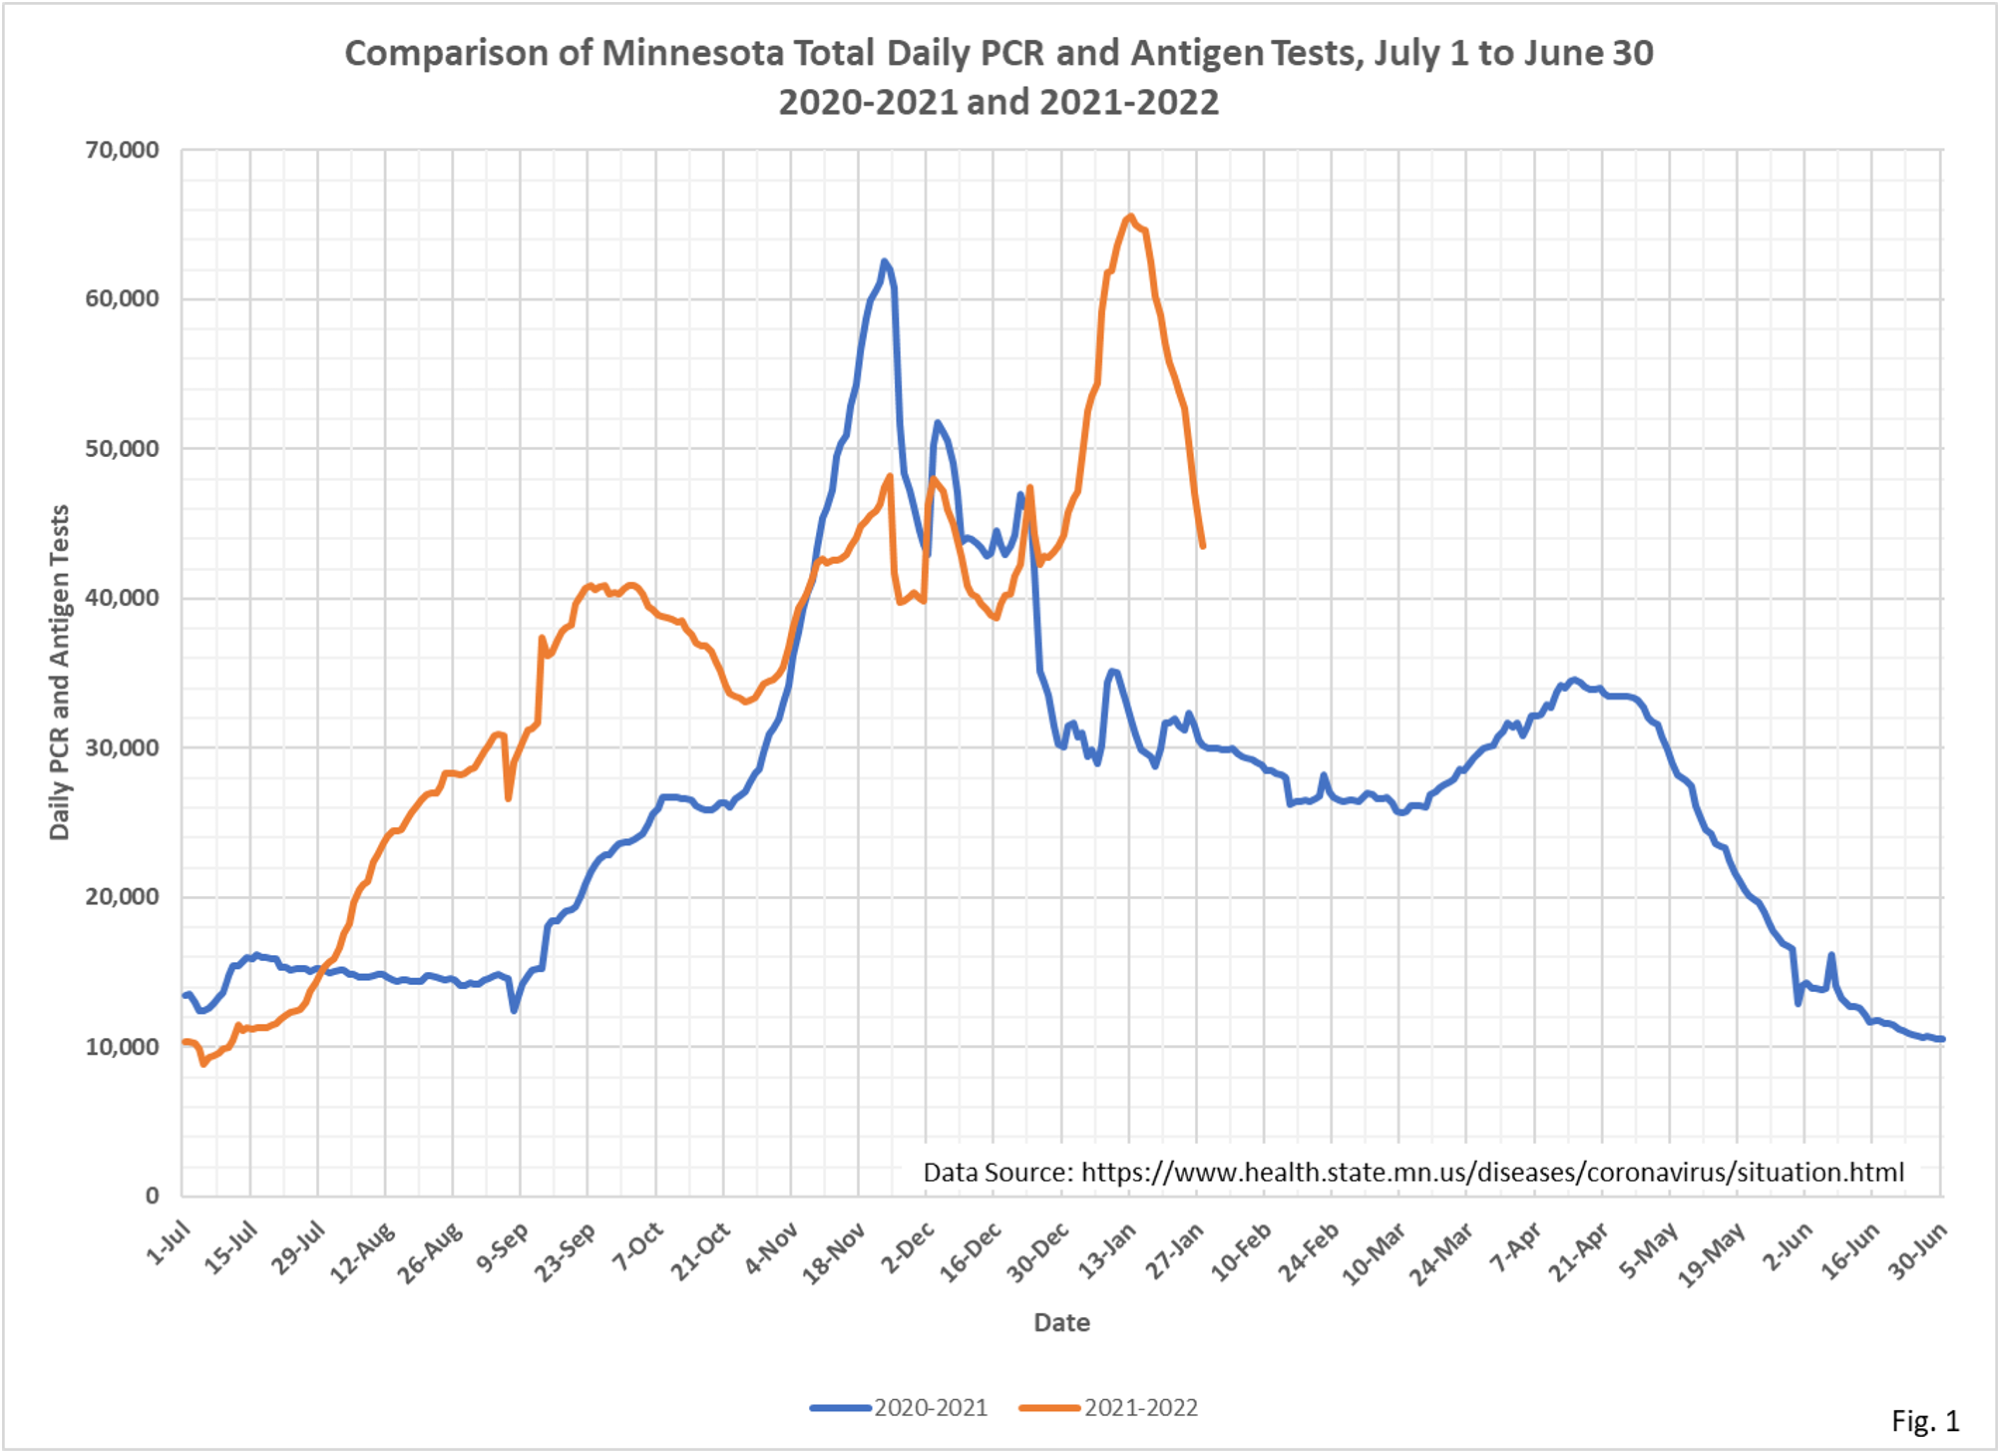
- Fig. 1: Average tests per day appear to have peaked on 1/13/2022 at 65,570 tests per day.
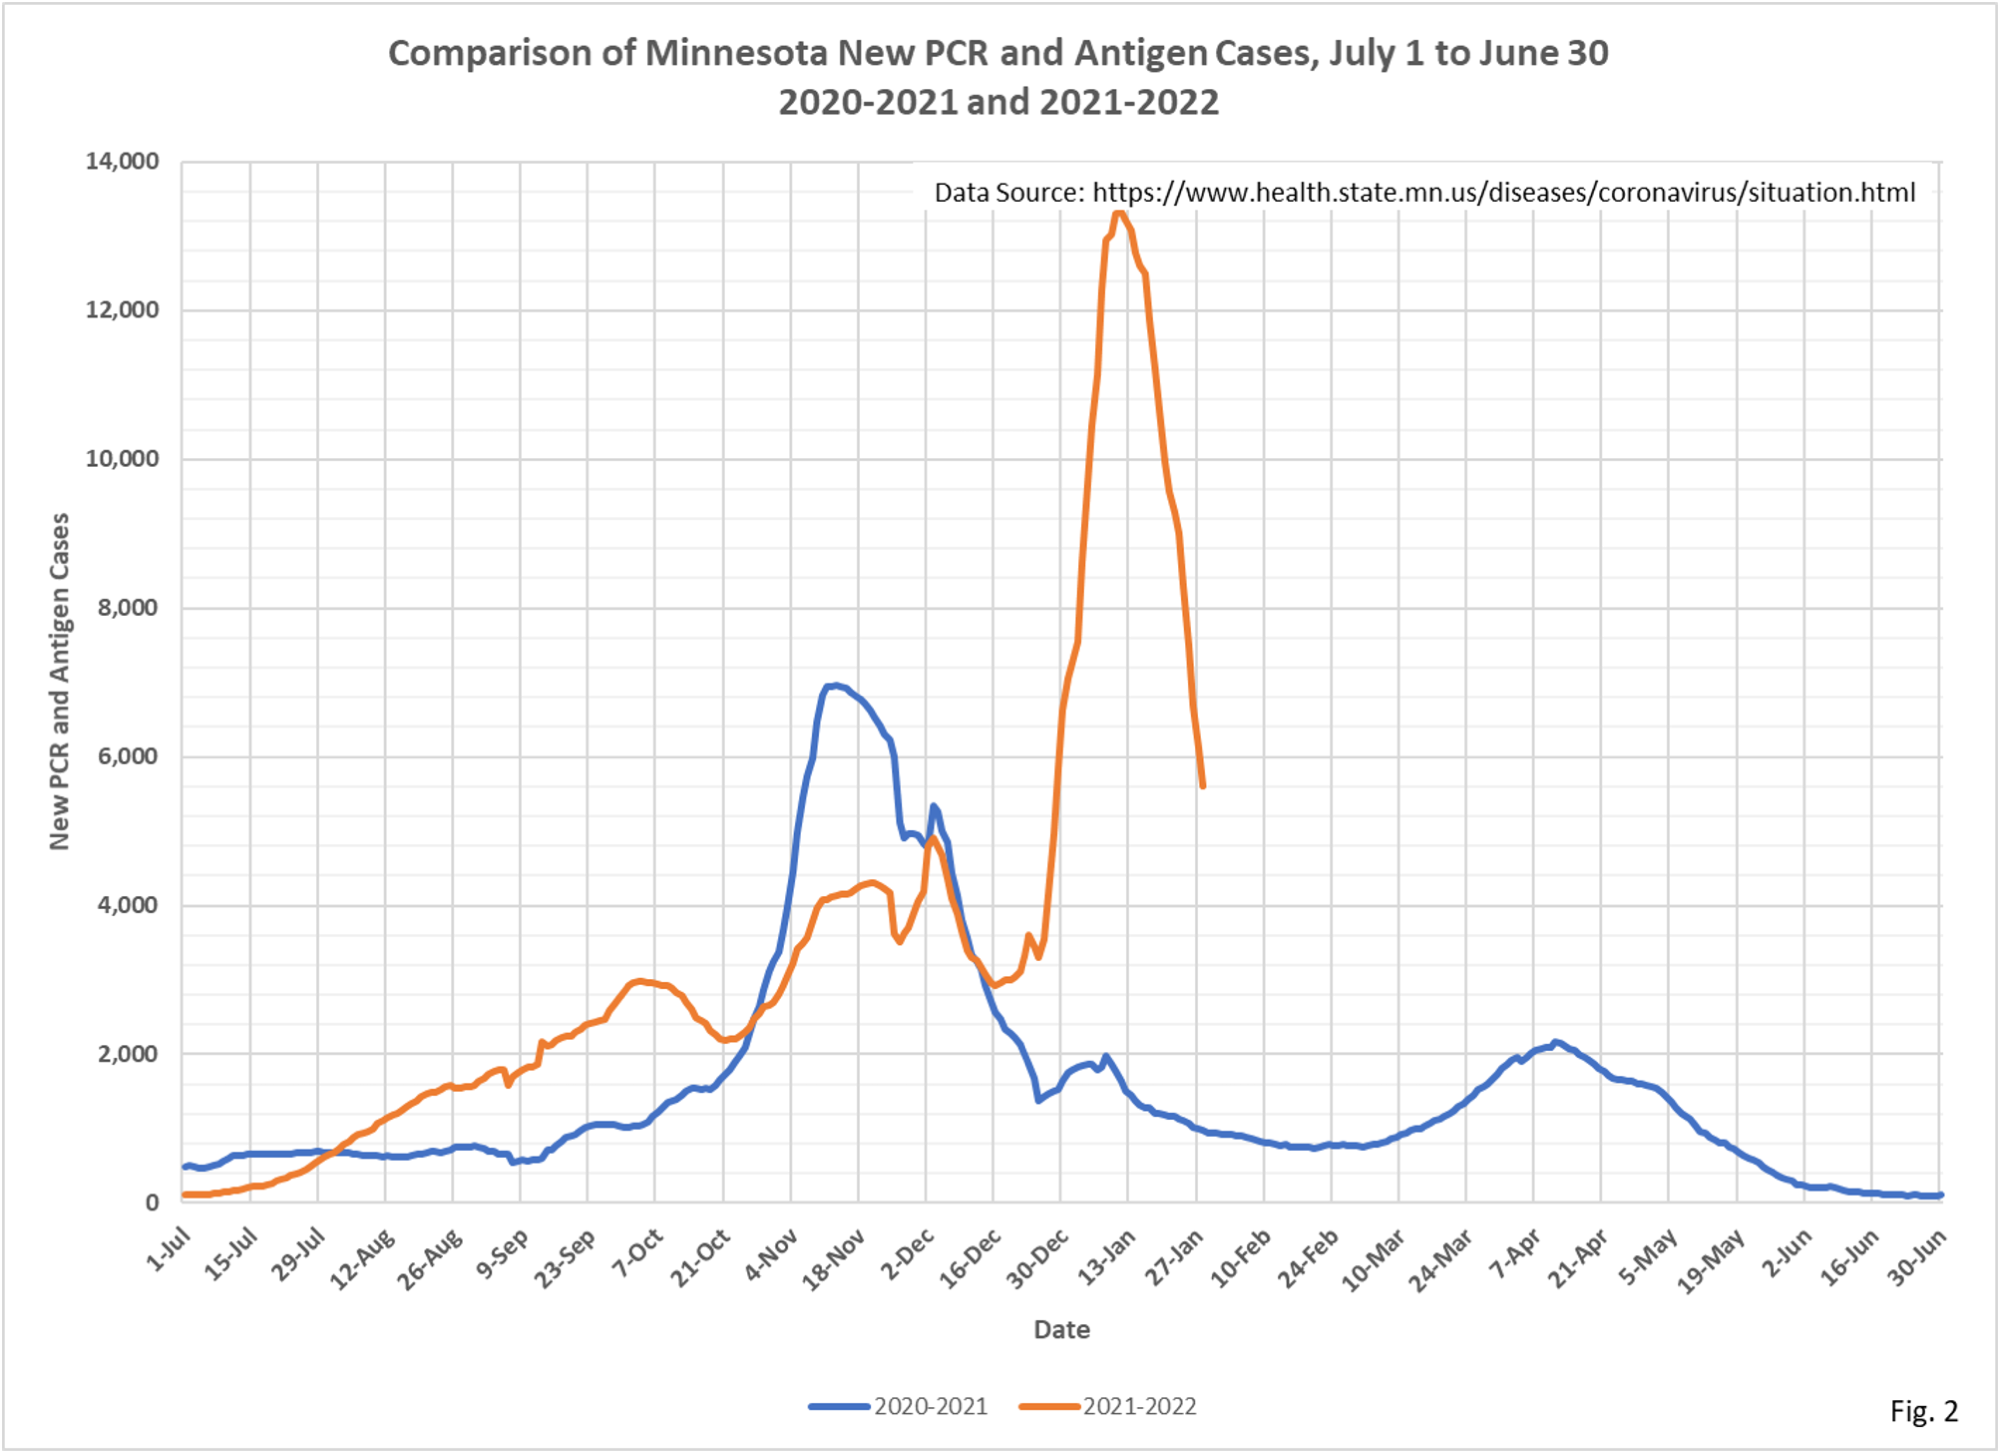
- Fig. 2: New daily cases in the recent Omicron wave peaked 17,817 cases per day on 1/10/2022, and at 13,319 cases on 1/11/2022 on a 7 day running average.
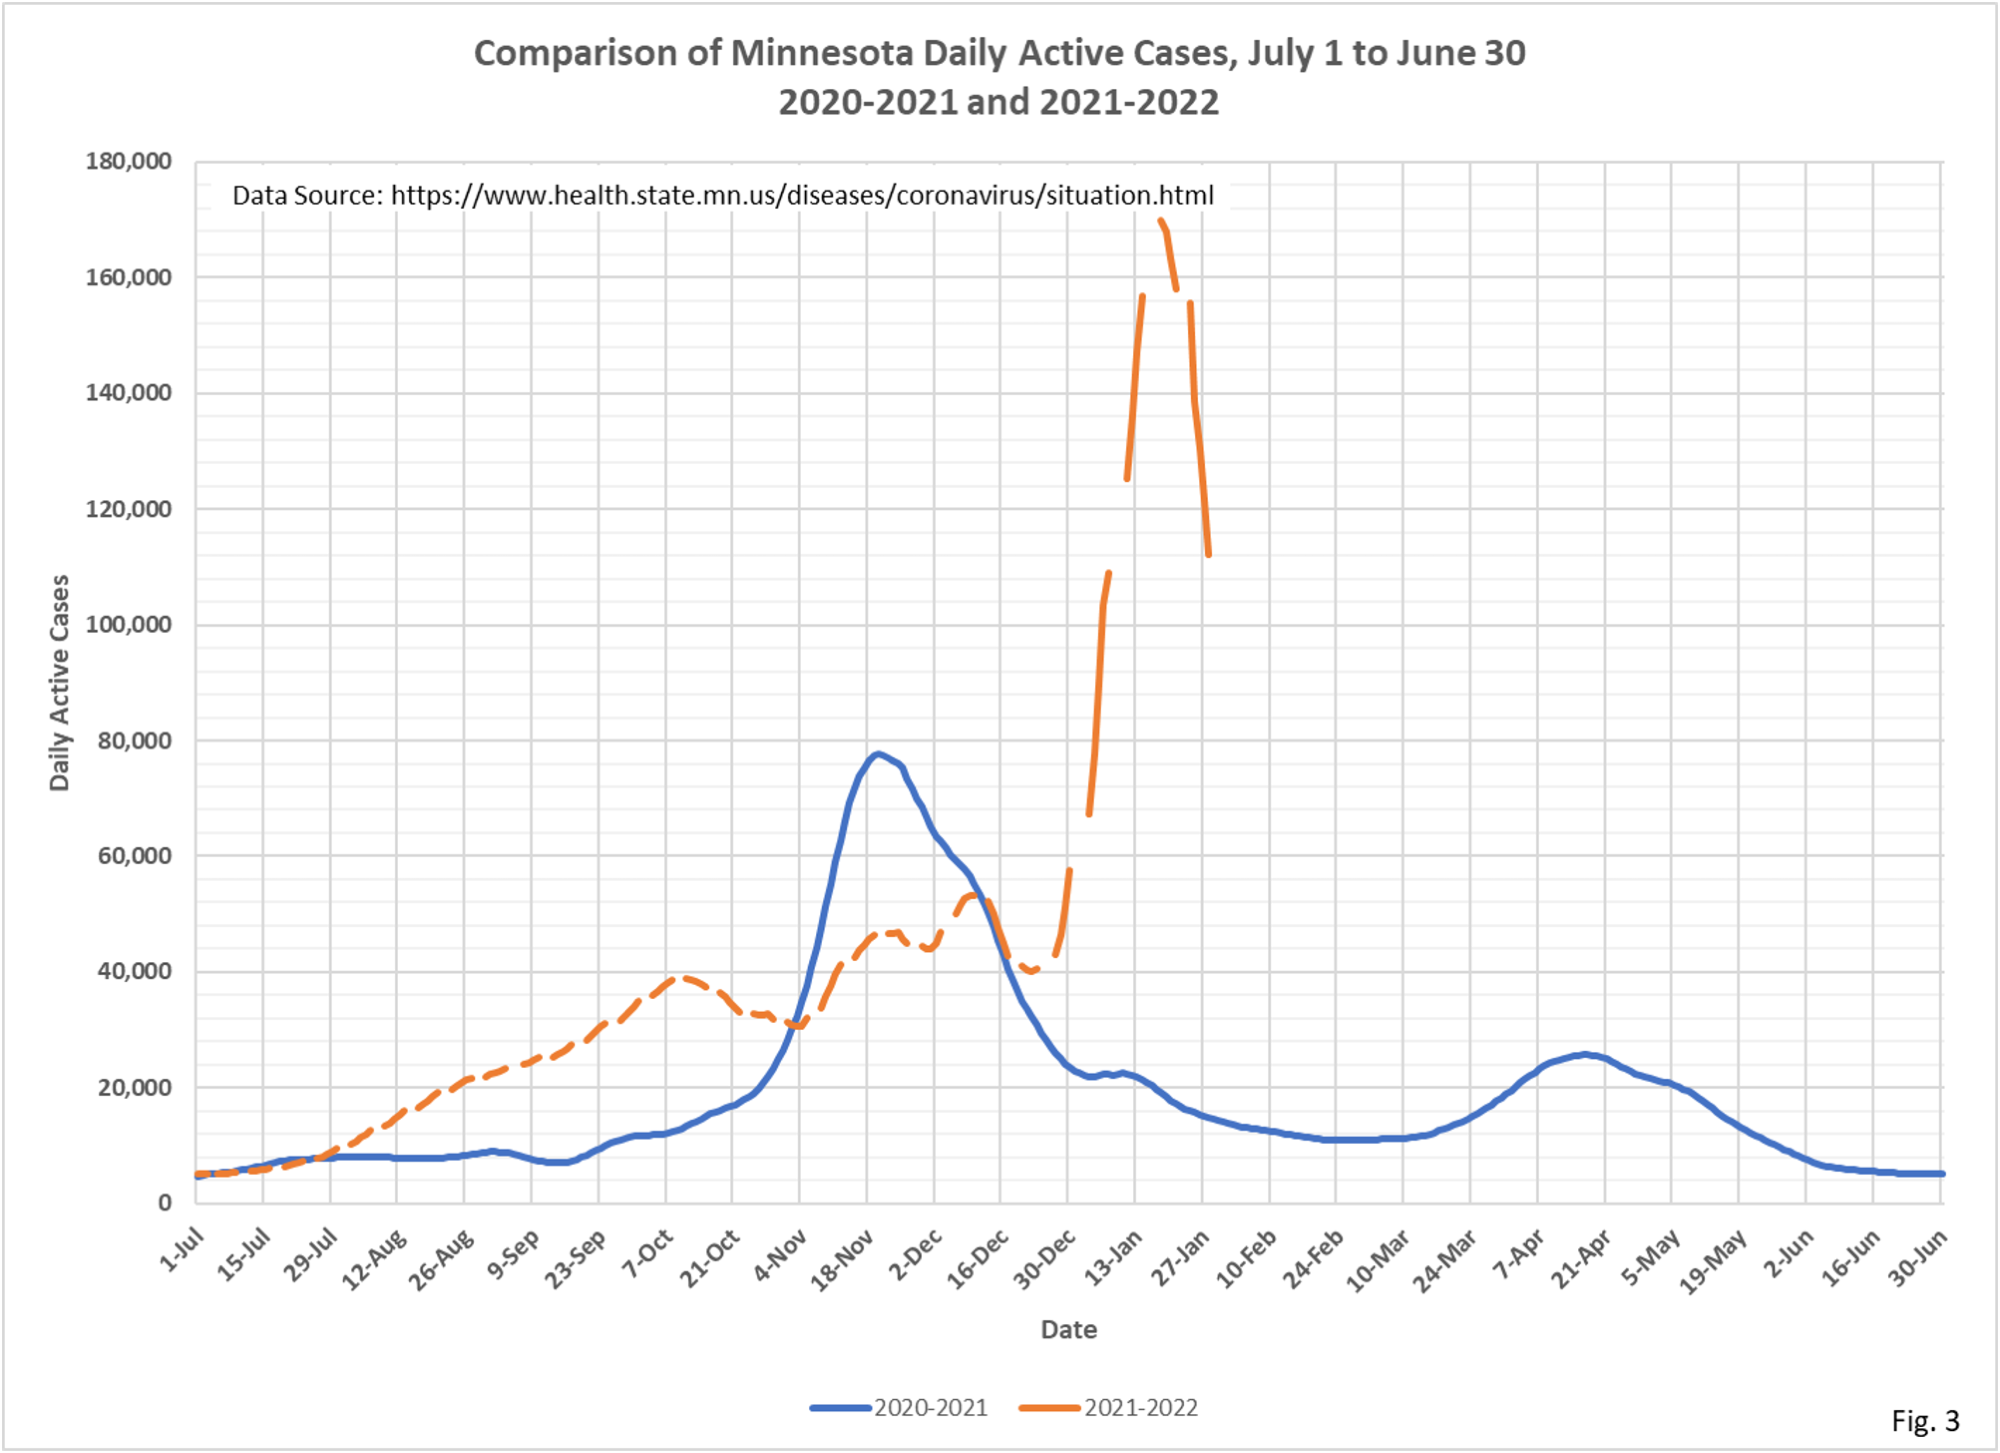
- Fig. 3: Active cases peaked on 1/18/2022.
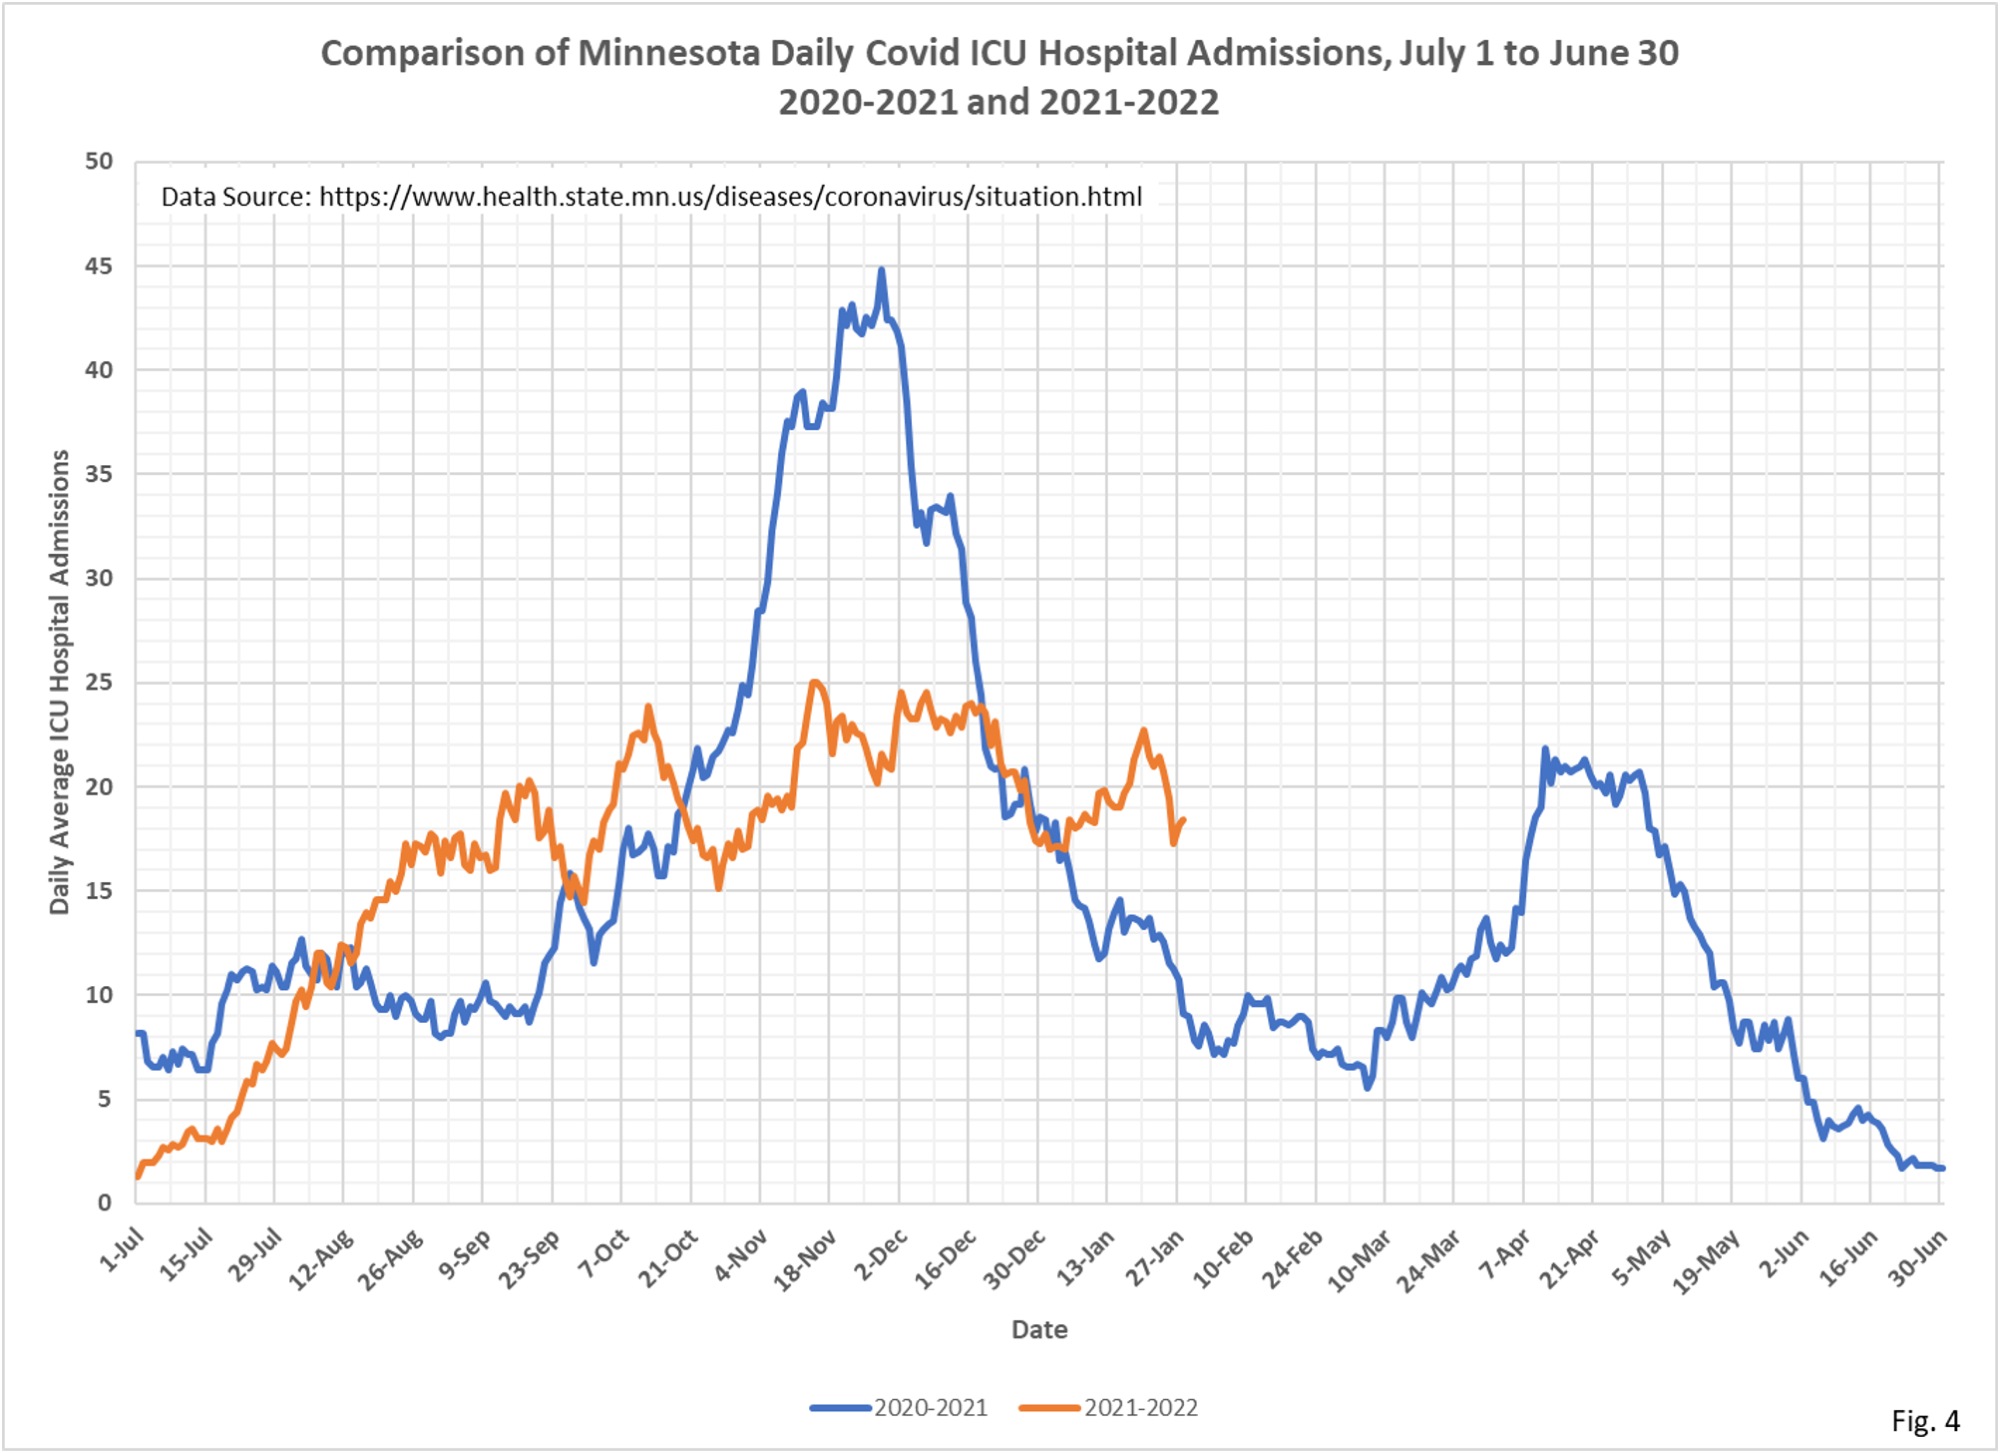
- Fig. 4: The note from last week is still true; ICU Covid admissions per day continue to hold steady between 15 and 25 admissions per day. Note how broad the ICU daily admissions surge is for 2021-2022, compared to the very sharp spike in Omicron cases in Fig. 2. In fact, it really appears that the massive Omicron spike in cases hasn’t affected the ICU daily admissions at all. Note that ICU daily admissions peaked at 25 per day, 55.6% of the 2020-2021 peak of 45 ICU admissions per day. The general shape of the 2021-2022 ICU admissions curve appears very similar to the 2021-2022 daily cases curve in Fig. 2, if the Omicron surge in cases is ignored in its entirety. In other words, Omicron has had no impact on the overall trend in ICU admissions for Covid!
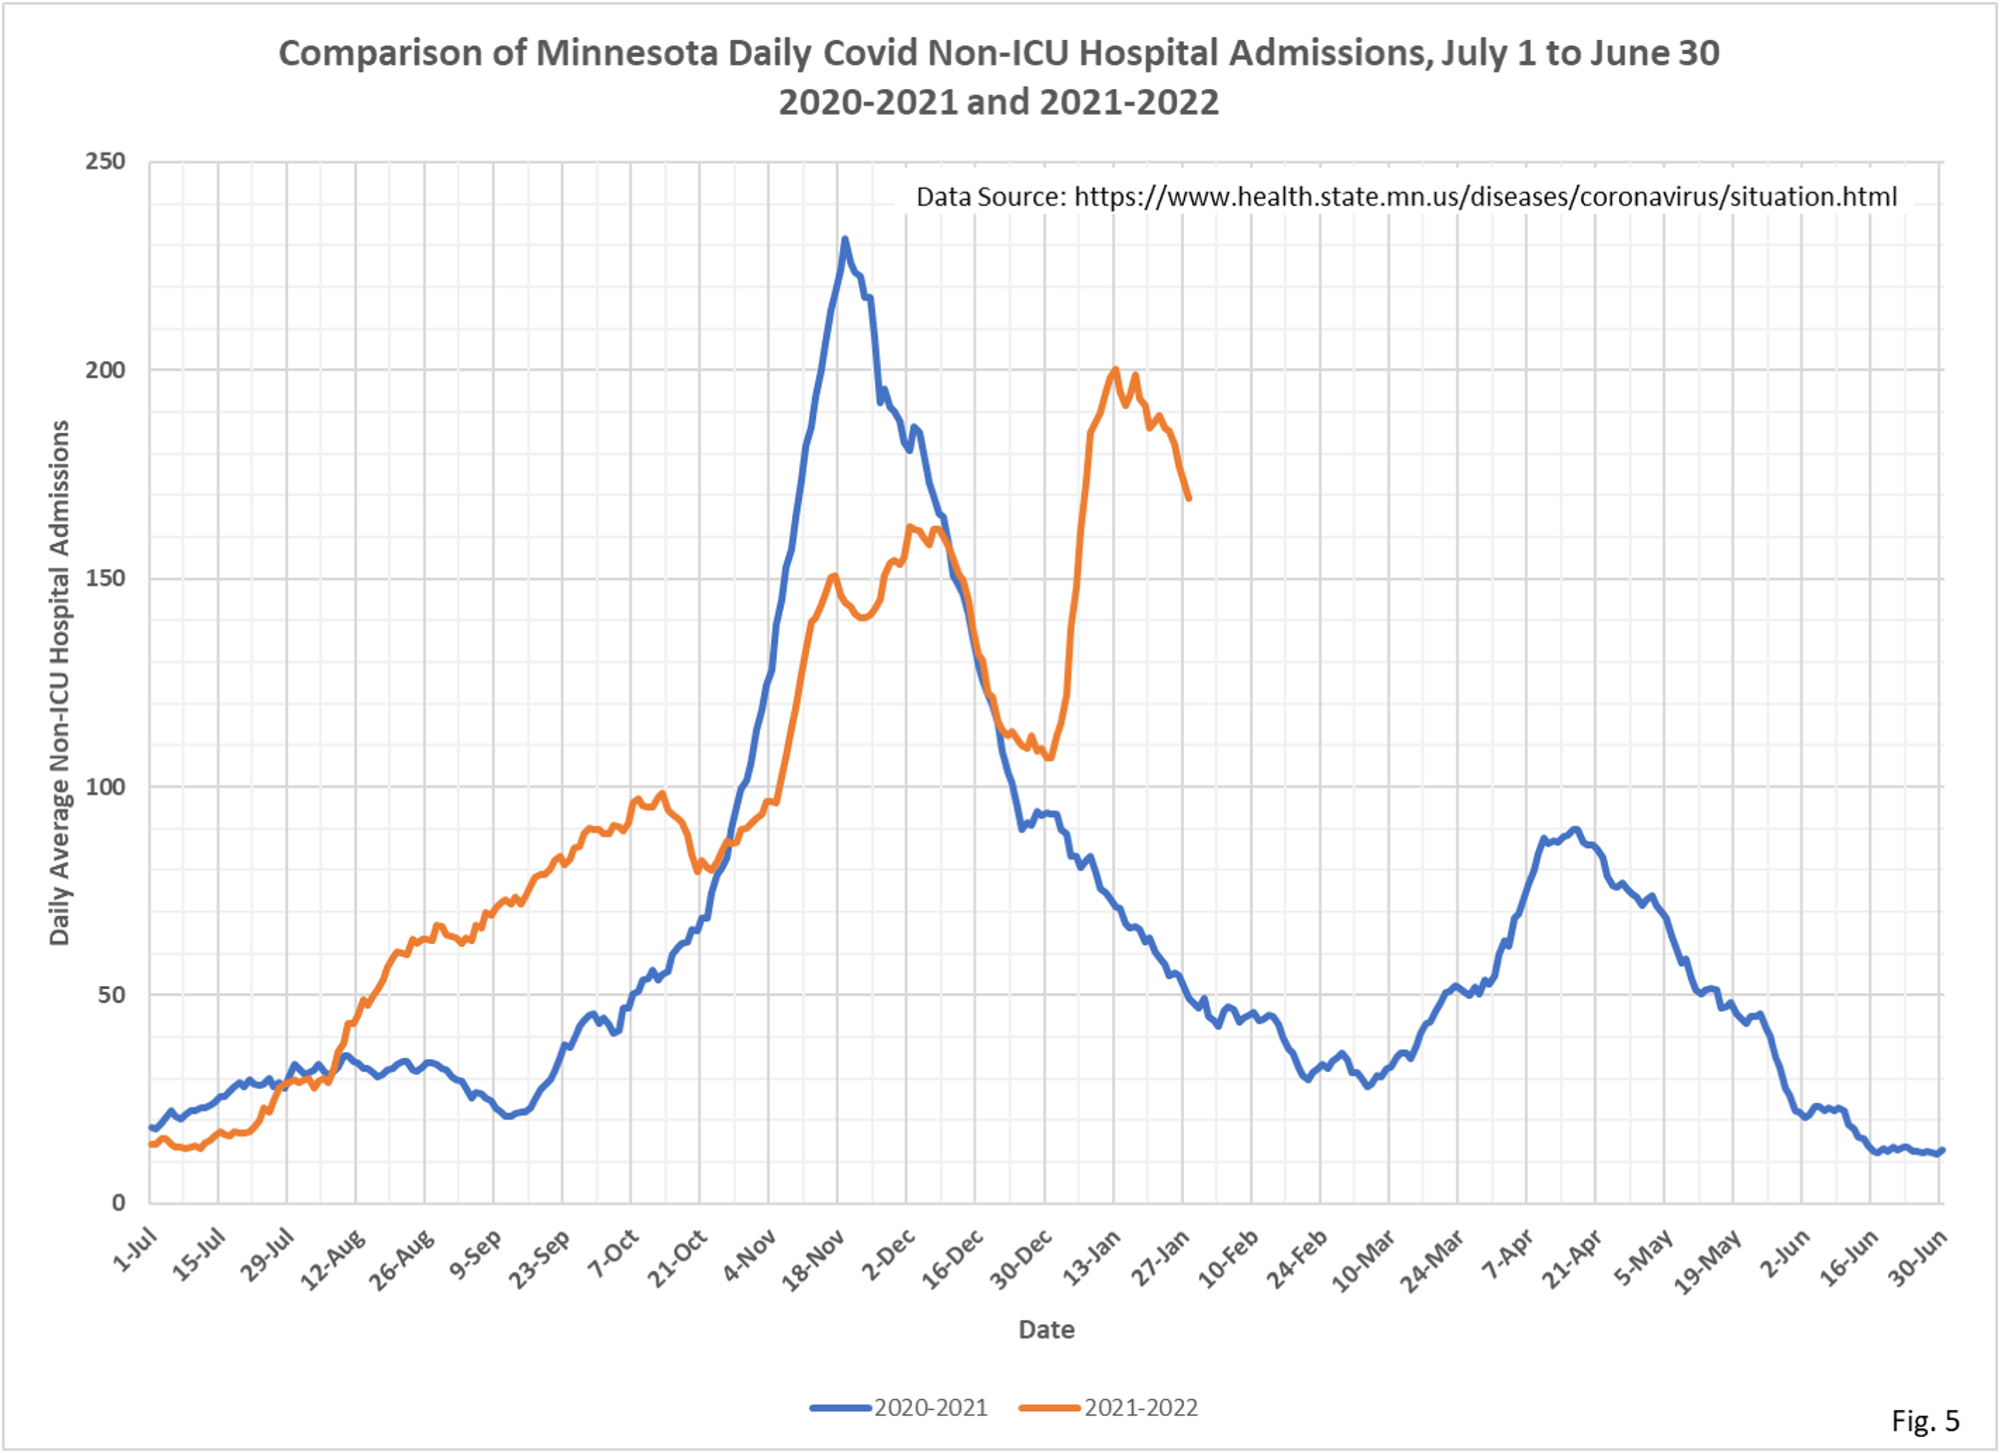
- Fig. 5: Non-ICU Covid hospital admissions per day peaked at 199 admissions per day on 1/13/2022. Note that non-ICU admissions definitely show a surge corresponding to the Omicron wave of cases.
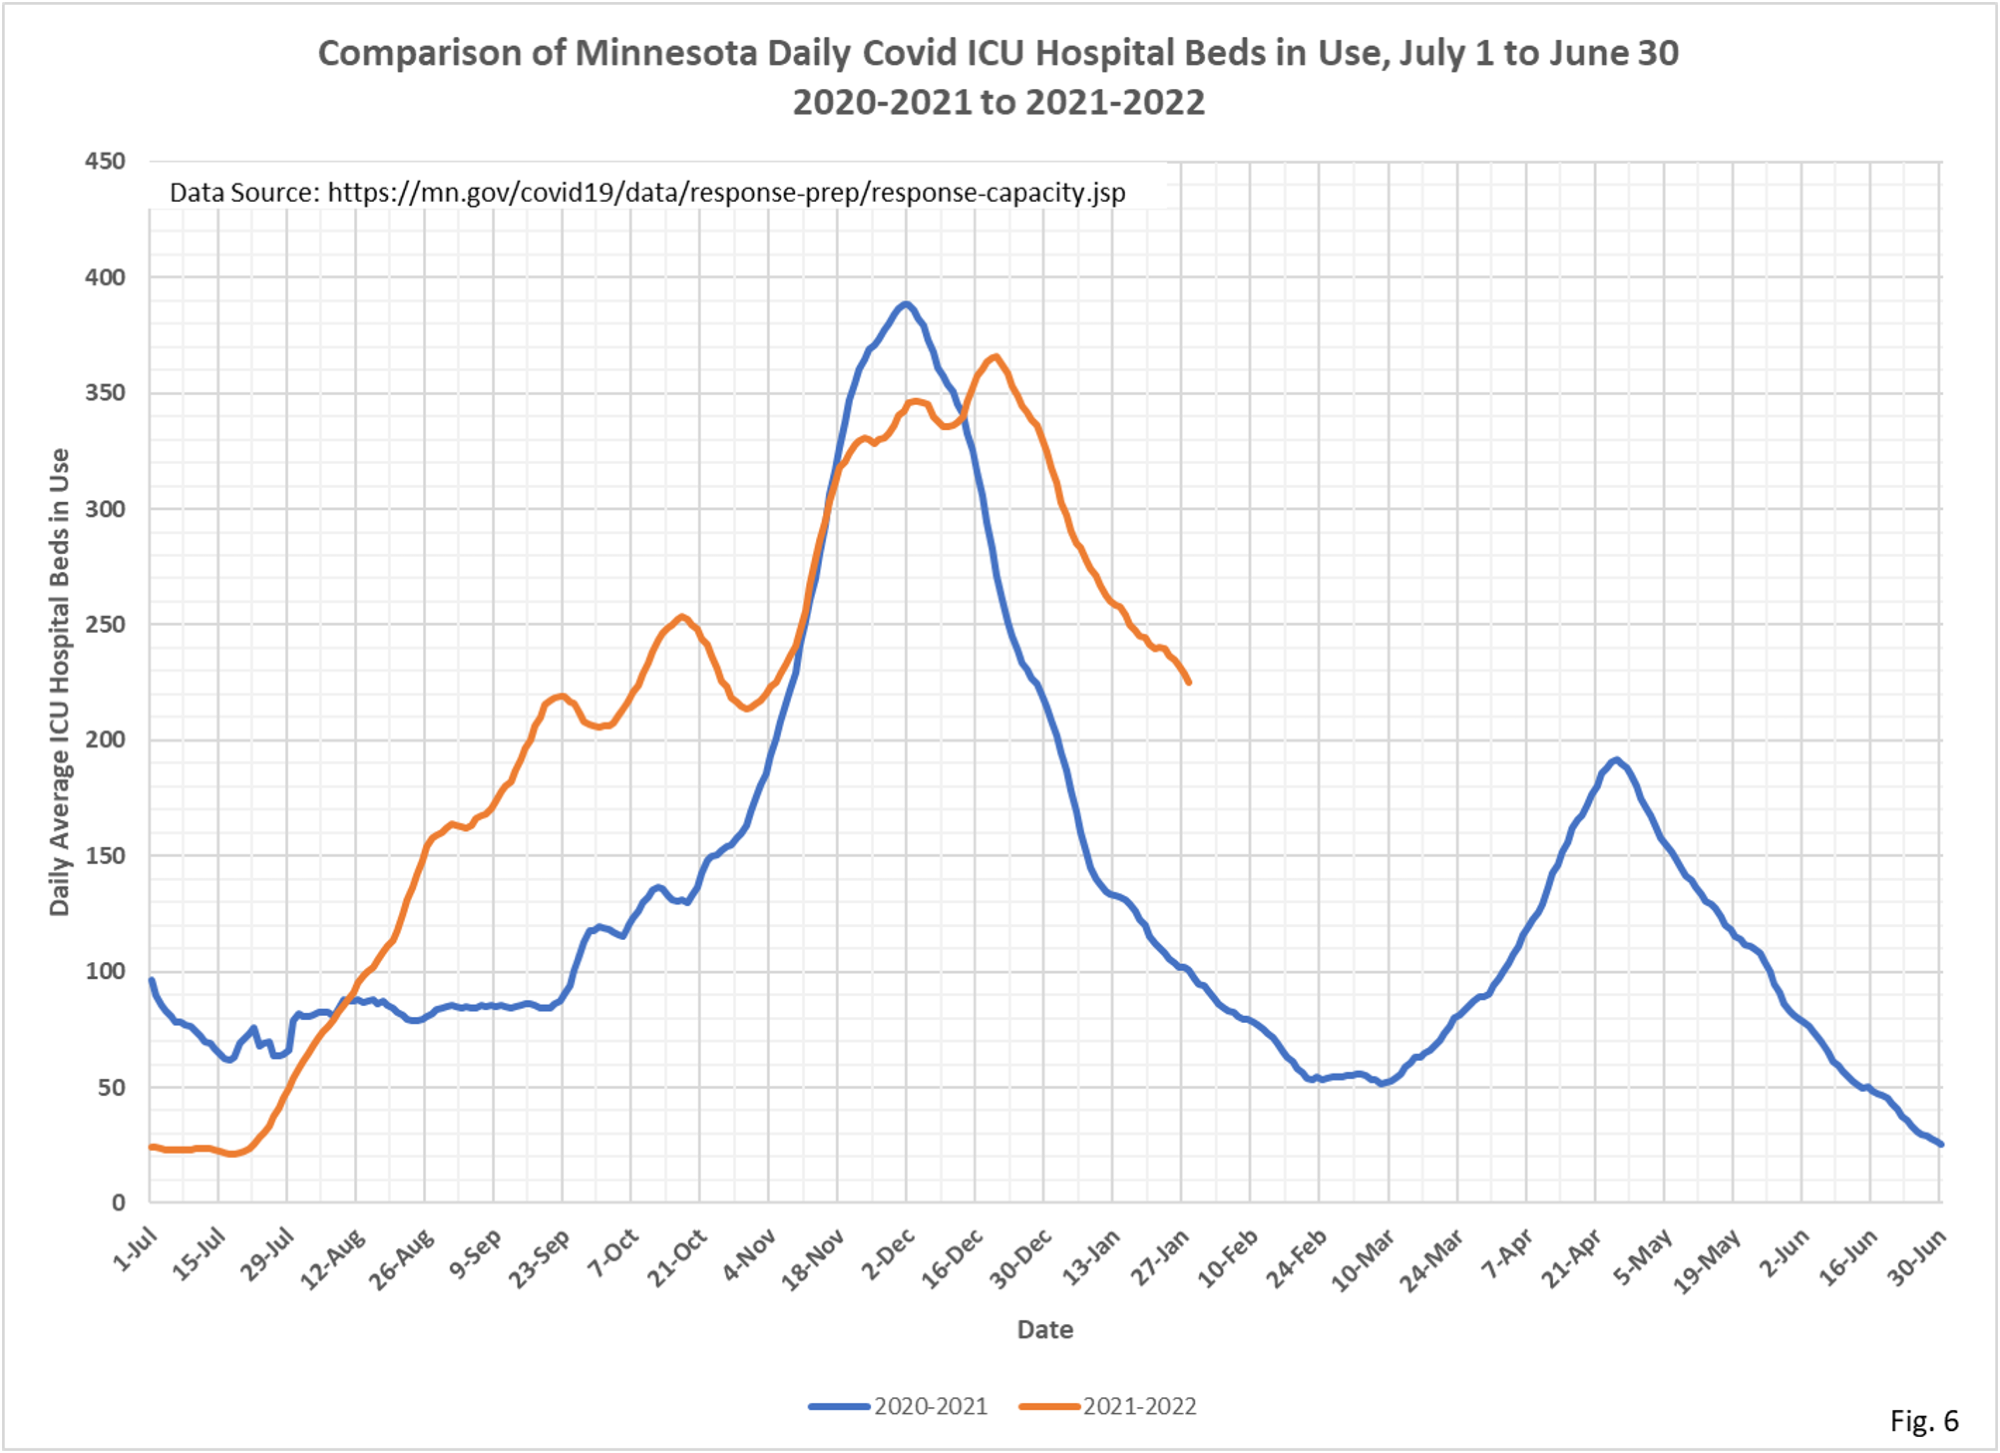
- Fig. 6: ICU Covid hospital beds in use continuing to fall, showing no sign of being affected by the Omicron surge in cases just as ICU admissions show no sign of being affected by Omicron.
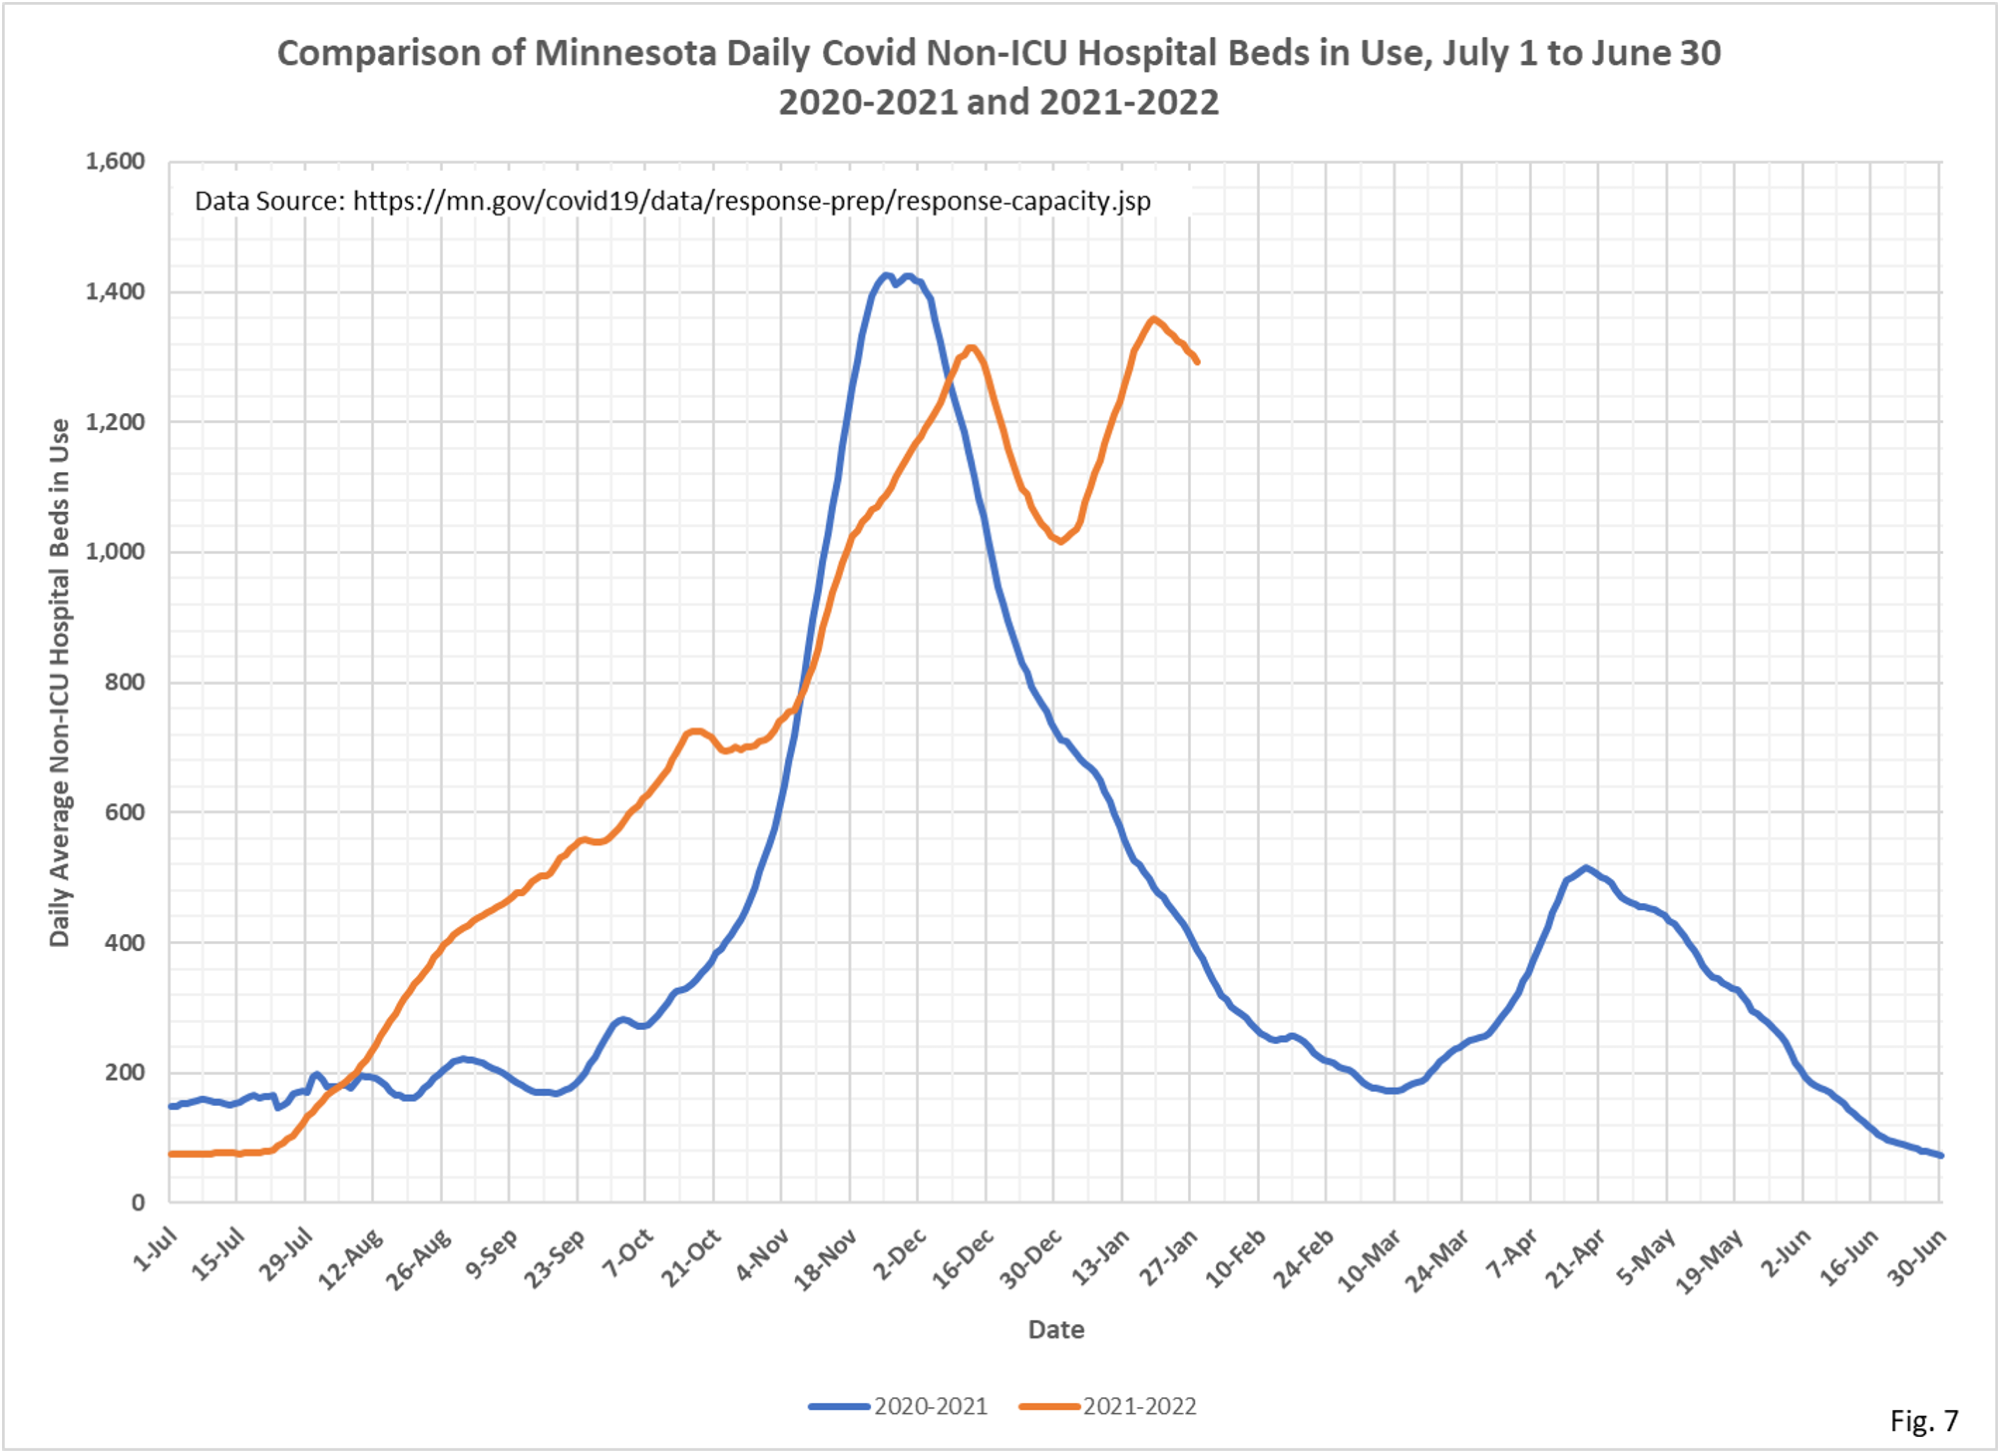
- Fig. 7: Non-ICU Covid hospital beds in use peaked at 1359 beds in use on 1/19/2022, although given lags in reporting it is possible that this peak could shift a little. Non-ICU beds in use also show a definite rise corresponding to the Omicron surge in cases. However, beds in use have fallen very slowly, leading to suspicion that the Non-ICU length of stay remains longer than earlier in the pandemic.
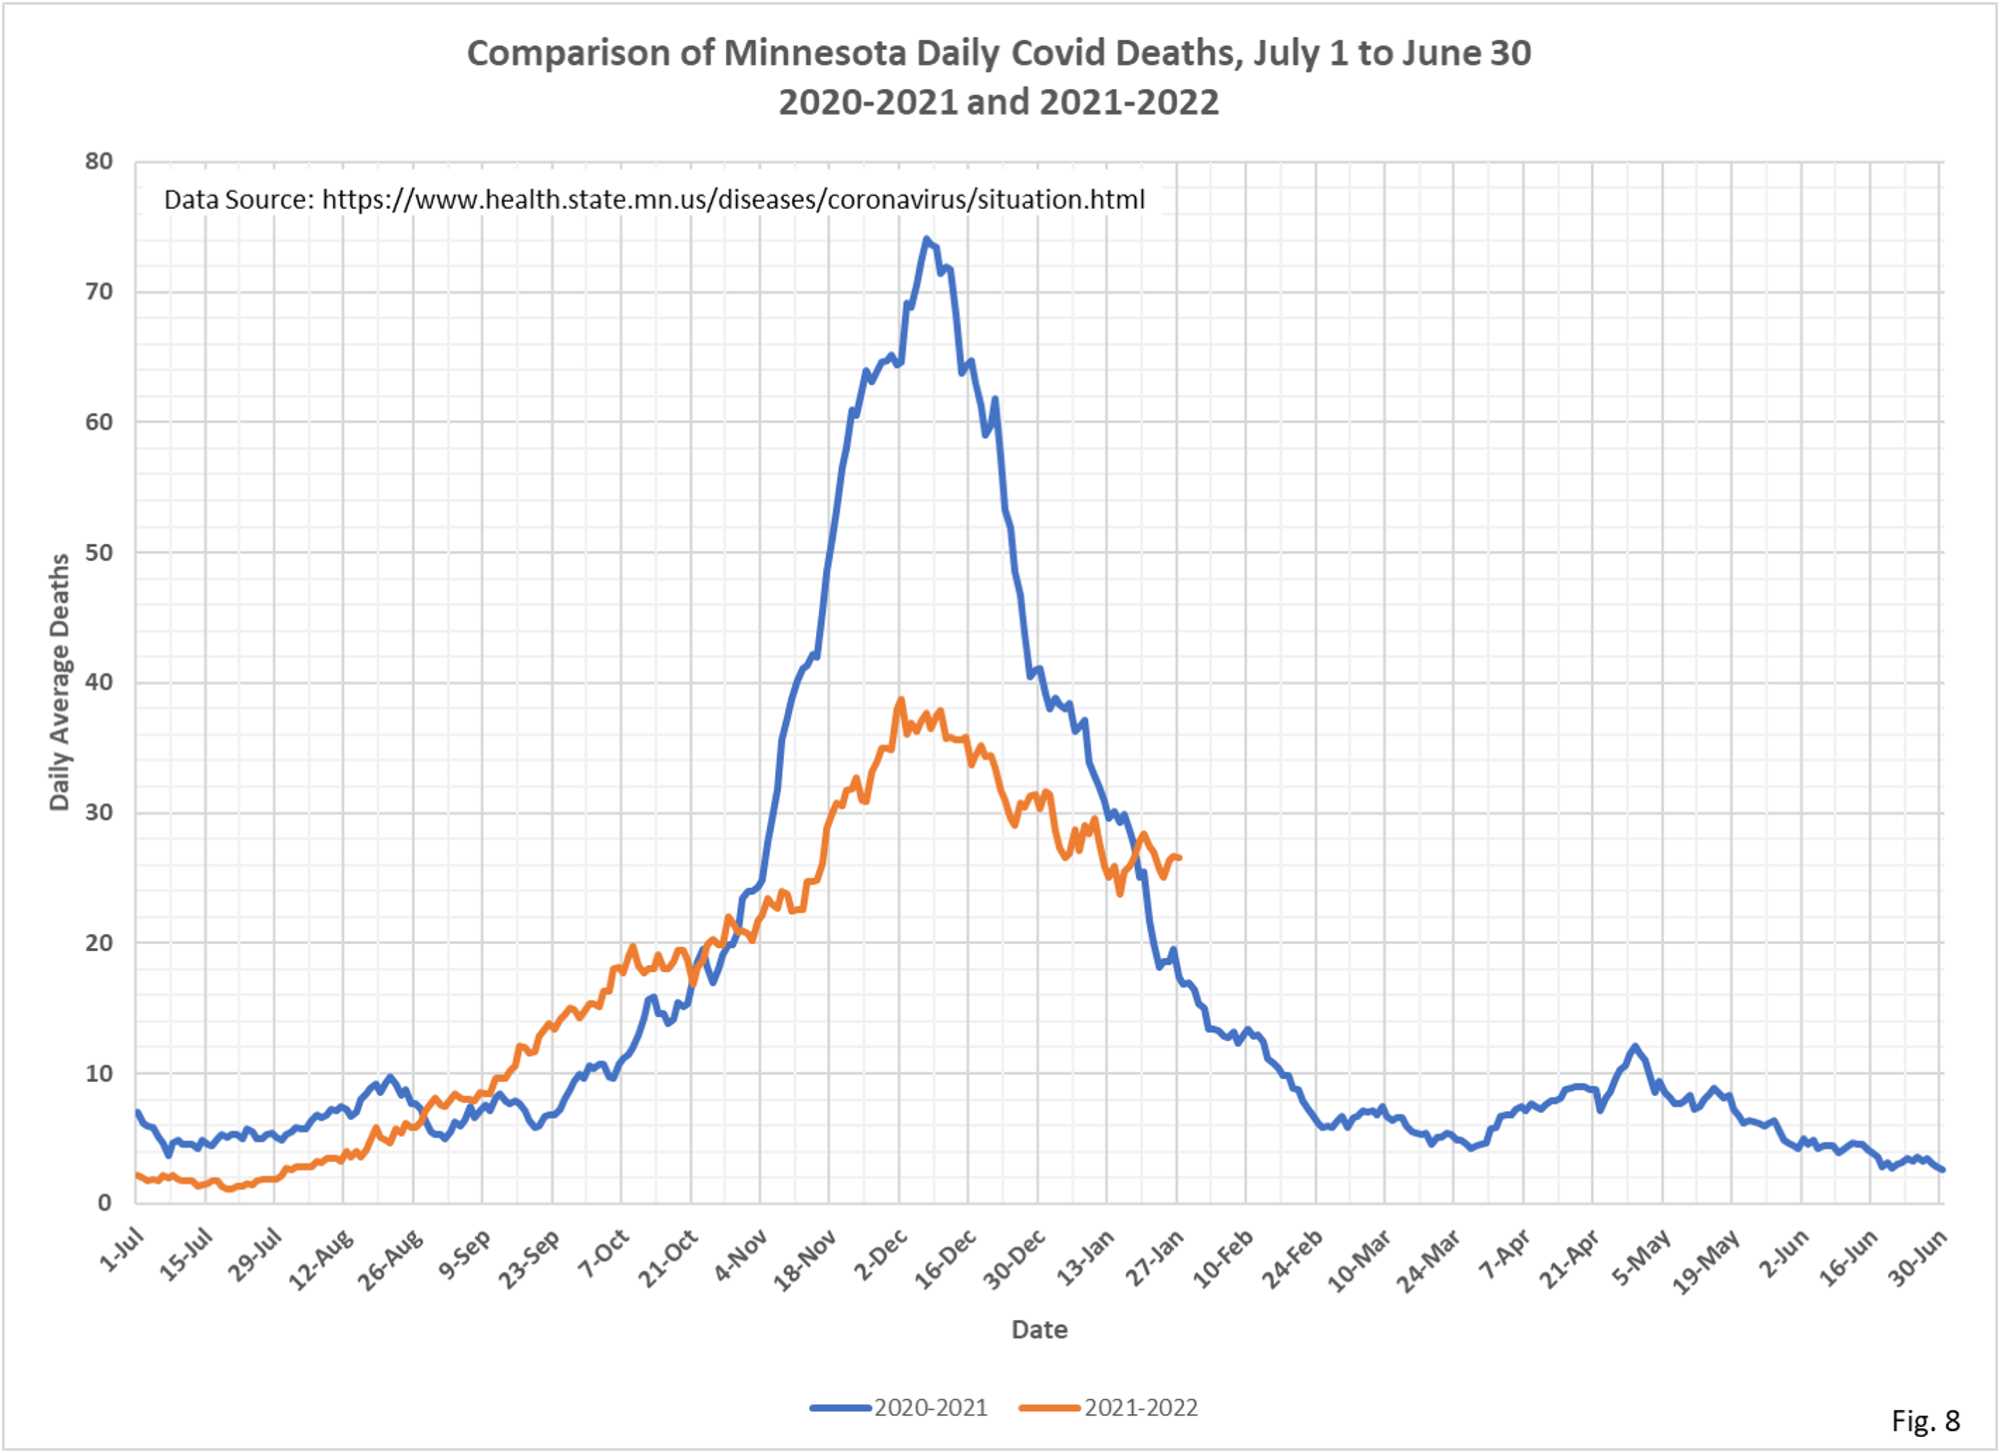
- Fig. 8: Deaths attributed to Covid continue to trend downward, having peaked on 12/2/2021.L There is also no apparent impact on deaths from the Omicron surge in cases, at least so far.

The PCR kit and Antigen kit “pandemic” keeps on PROFITEERING…