This is a tricky post. Dave’s notes explain the genesis pretty well. I think we both are very skeptical about some of the rates, especially among the older unvaxed. One explanation is that there are a lot of old people who can’t be vaxed or whom it makes no sense to vax because of their health status. And these people are likely to be very susceptible to CV-19. Even if they really die of something else, a large percent are likely to have a CV-19 positive test in the recent past. And we know that DOH has lots of people in the wrong bucket–they don’t know people vaxed out-of-state, so for old people think Florida and Arizona, or in federal sites like the VA. I think it very certain that DOH is, probably intentionally, publishing misleading rates of deaths and hospitalizations in the elderly groups, which are very heavily vaxed.
Dave’s notes:
1. Commenter Joe Kosanda, on a recent post https://healthy-skeptic.com/2022/01/26/breakthrough-events-january-24/#comments , noted that the pool of unvaccinated people, especially 65 and over, seemed too small for the number of unvaccinated deaths that the Minnesota Department of Health (MDH) reports every week. For this reason the current death rate seems higher than would be expected. Joe asks in his comment whether deaths are being misclassified as being unvaccinated. An emailer asked about the same issue, approaching it from a different angle. We have also been curious about what is going on with vaccinated versus unvaccinated cases, breakthroughs, and deaths, so we decided to look into these questions further.
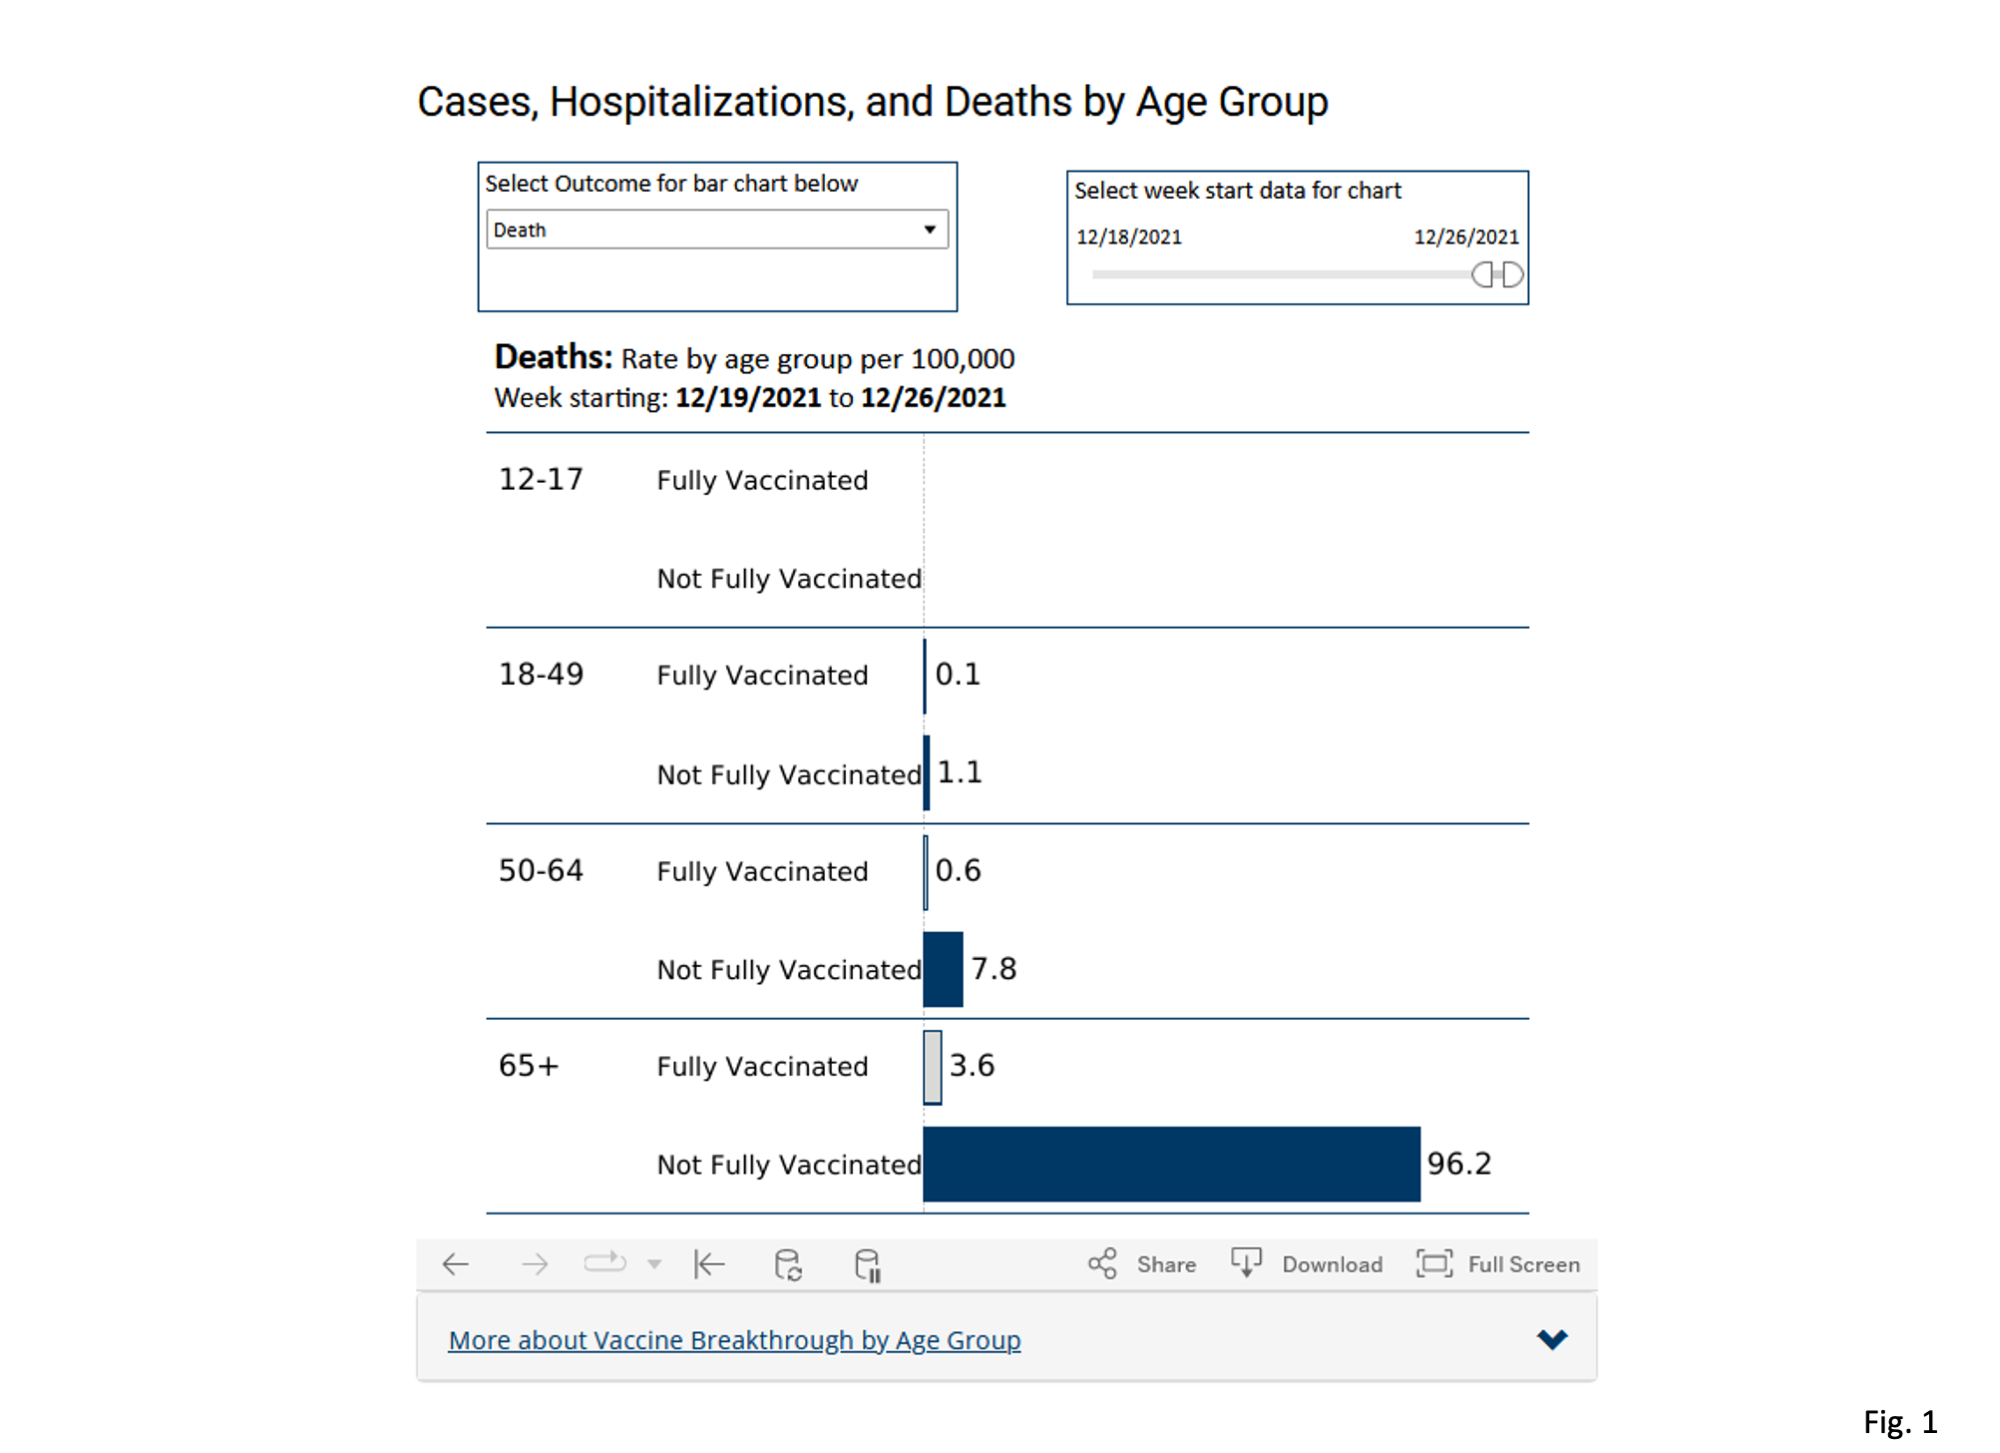
2. MDH publishes rates per 100k of Covid cases, hospitalizations, and deaths for vaccinated and unvaccinated populations on the COVID-19 Vaccine Breakthrough Weekly Report https://www.health.state.mn.us/diseases/coronavirus/stats/vbt.html. Toward the lower part of the web page they publish a graphic titled Cases, Hospitalizations, and Deaths by Age Group. Using the pulldown menu and date sliders the graphic can be changed to show different data over different time periods. Every Monday the breakthrough data underlying the graphs on this page are undated. Fig. 1 below displays the deaths per week for the most recent week of data available (12/19/2021 to 12/26/2021), where the Covid deaths for the vaccinated are reported as 3.6 deaths per 100k, and deaths for the unvaccinated 96.2 deaths per 100k for the 65 and over age group.
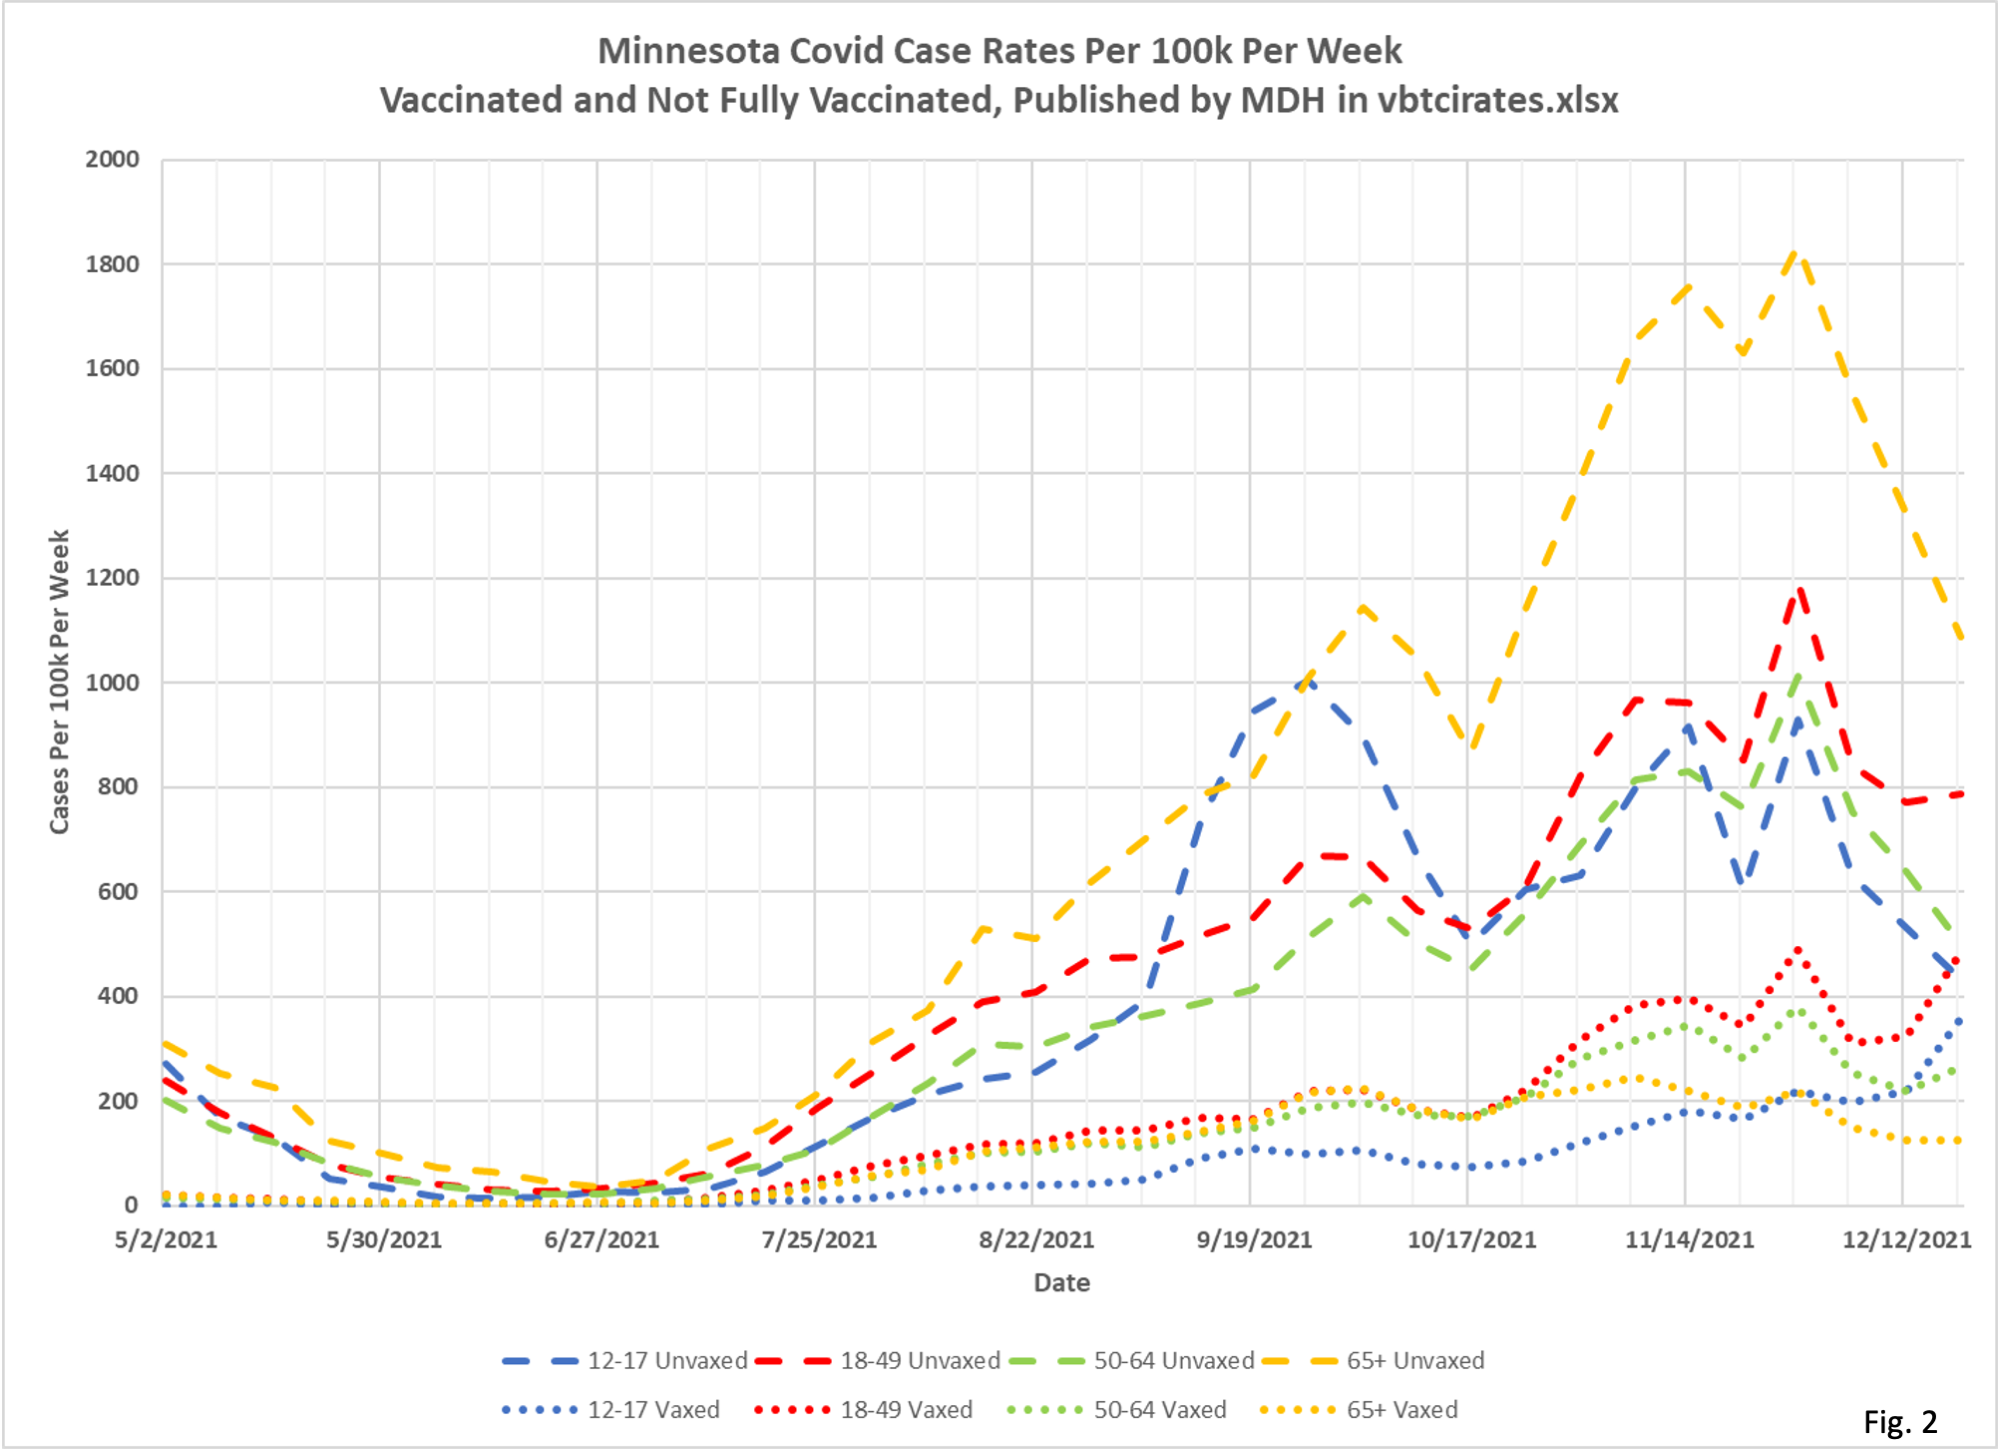
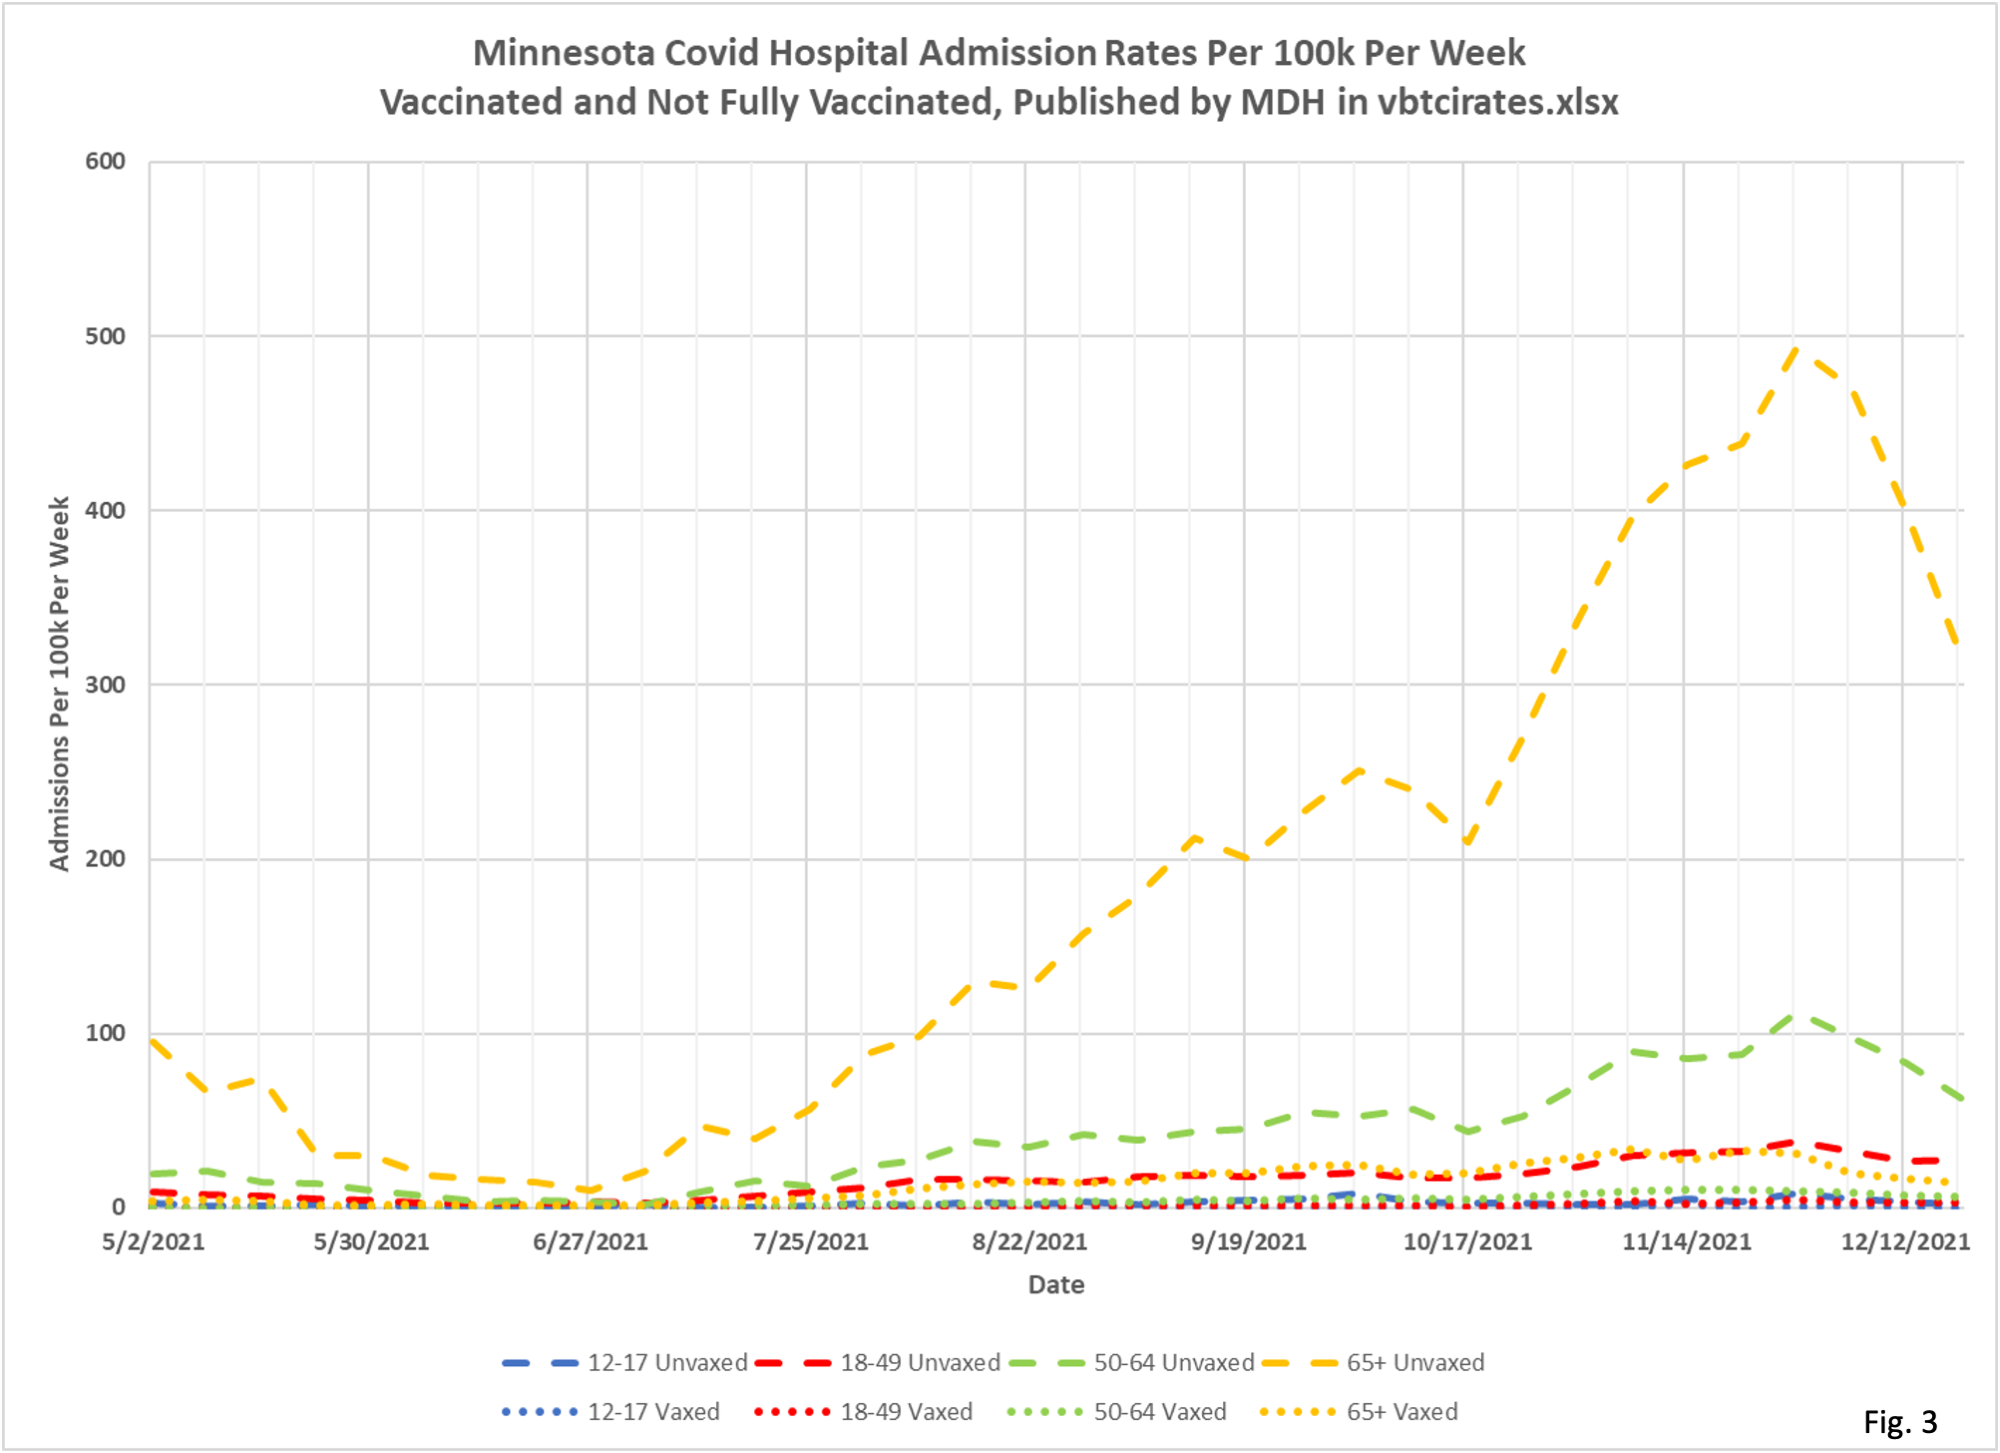
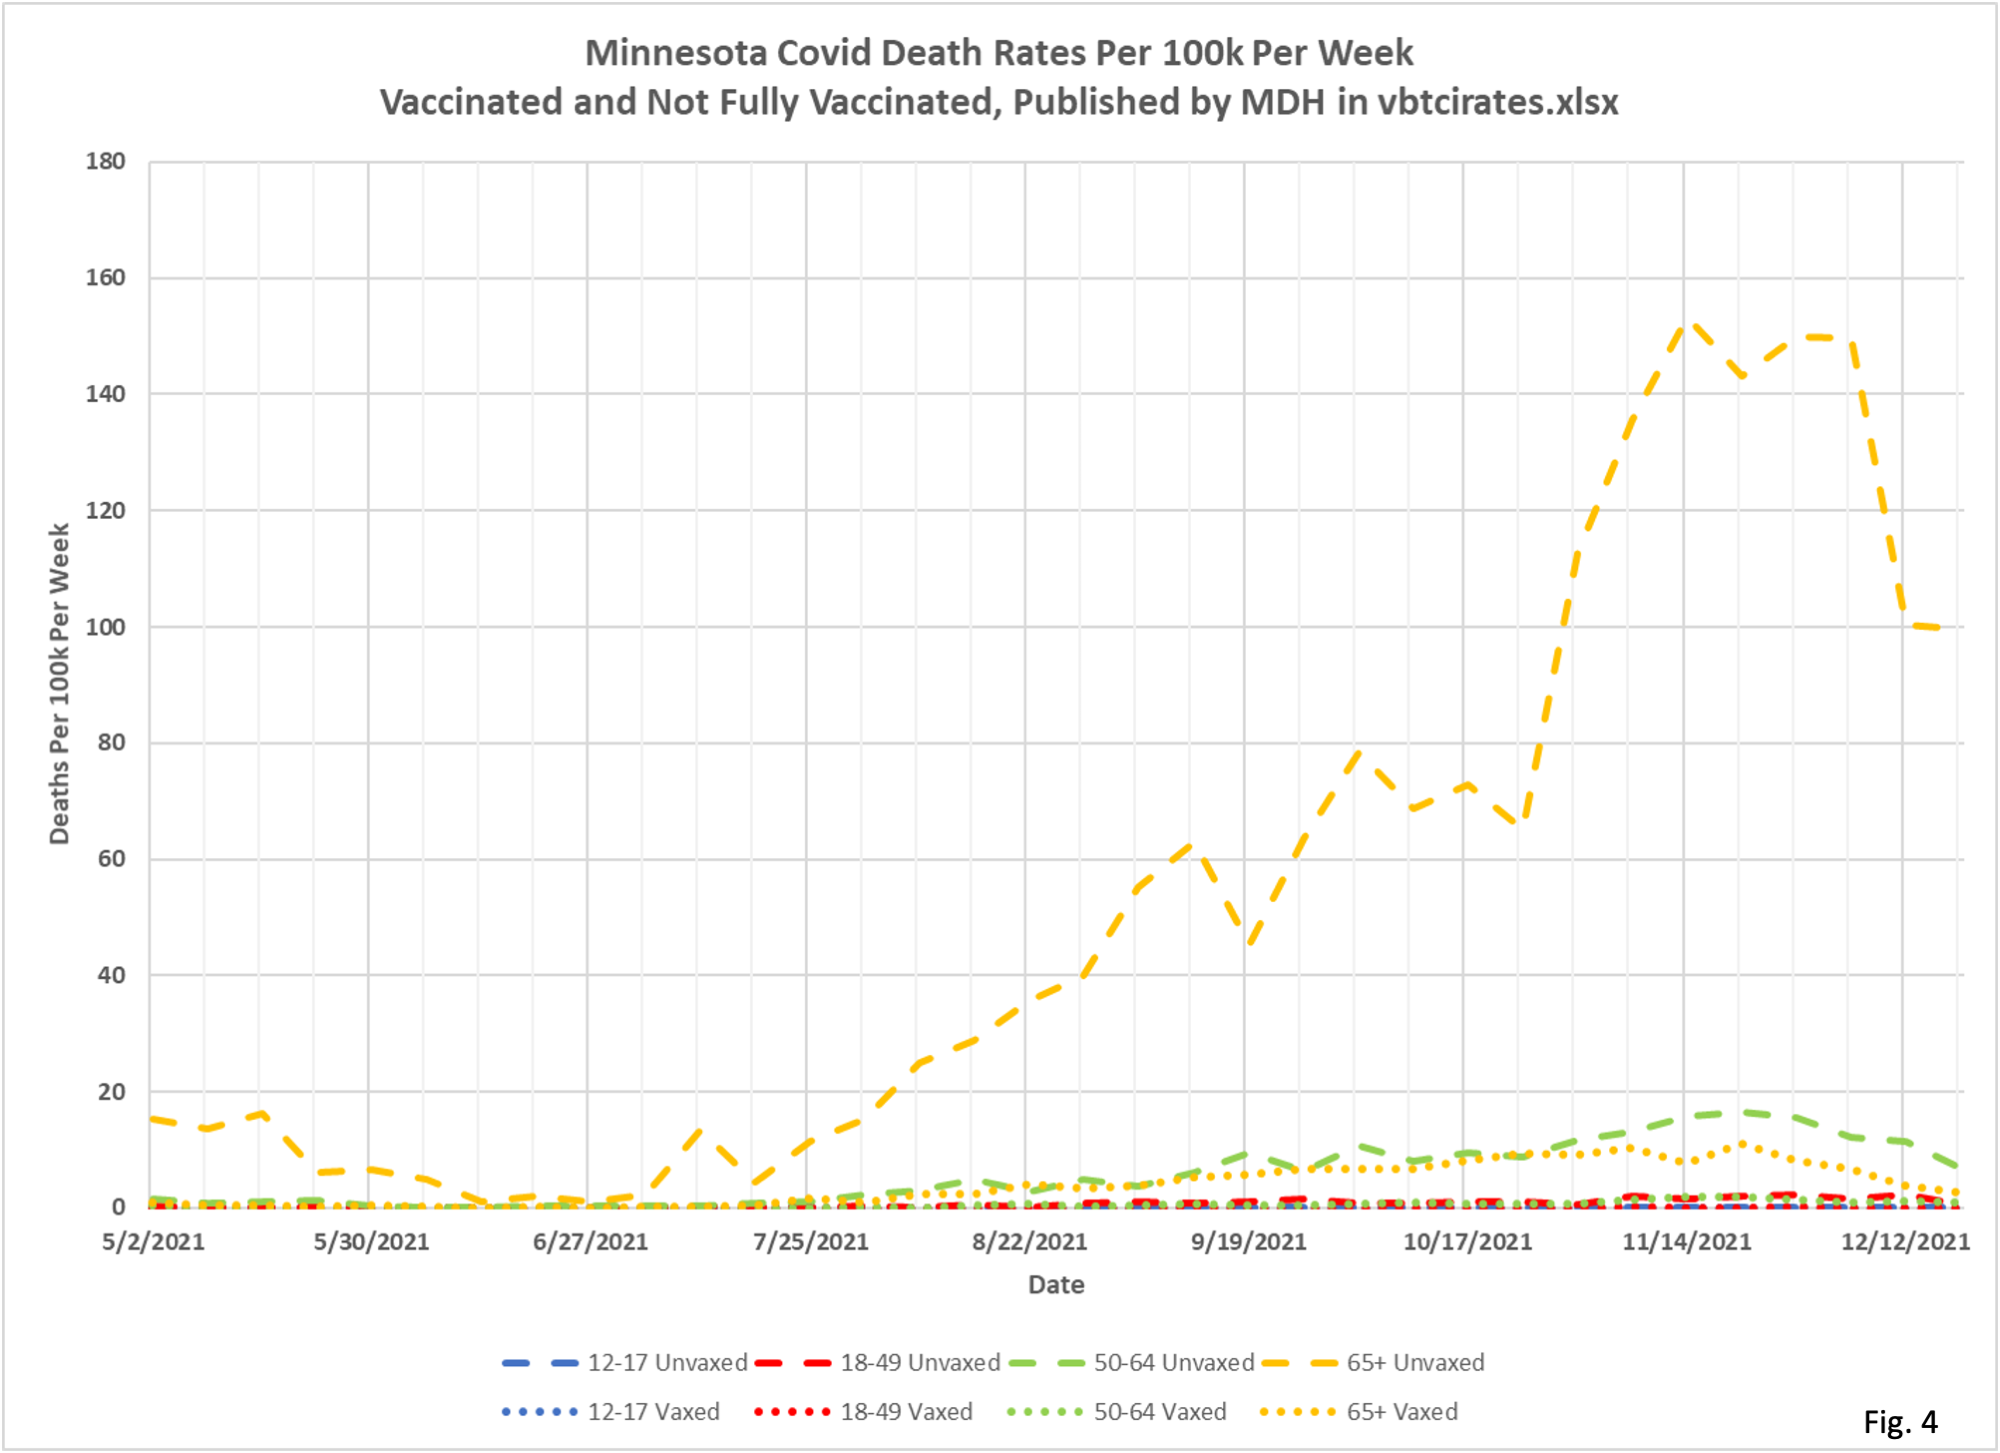
3. The format that MDH uses for the graphic in figure is very good at highlighting the relative rates between the vaccinated and unvaccinated but is very poor for visualizing how these rates change over time. However, MDH publishes the underlying data in a data file named vbtcirates.xlsx, which is accessible by clicking the link “More about Vaccine Breakthrough by Age Group” under the graphic. This data file contains the rates per 100k used to drive the graphic, but does not provide the actual cases, hospitalizations, or deaths each week, or the actual sizes of the vaccinated and unvaccinated populations of each age group. The data in this data file as published by MDH on 12/31/2022 is plotted in Fig.2, Fig. 3, and Fig. 4 below without modification, for cases, hospitalizations, and deaths respectively.
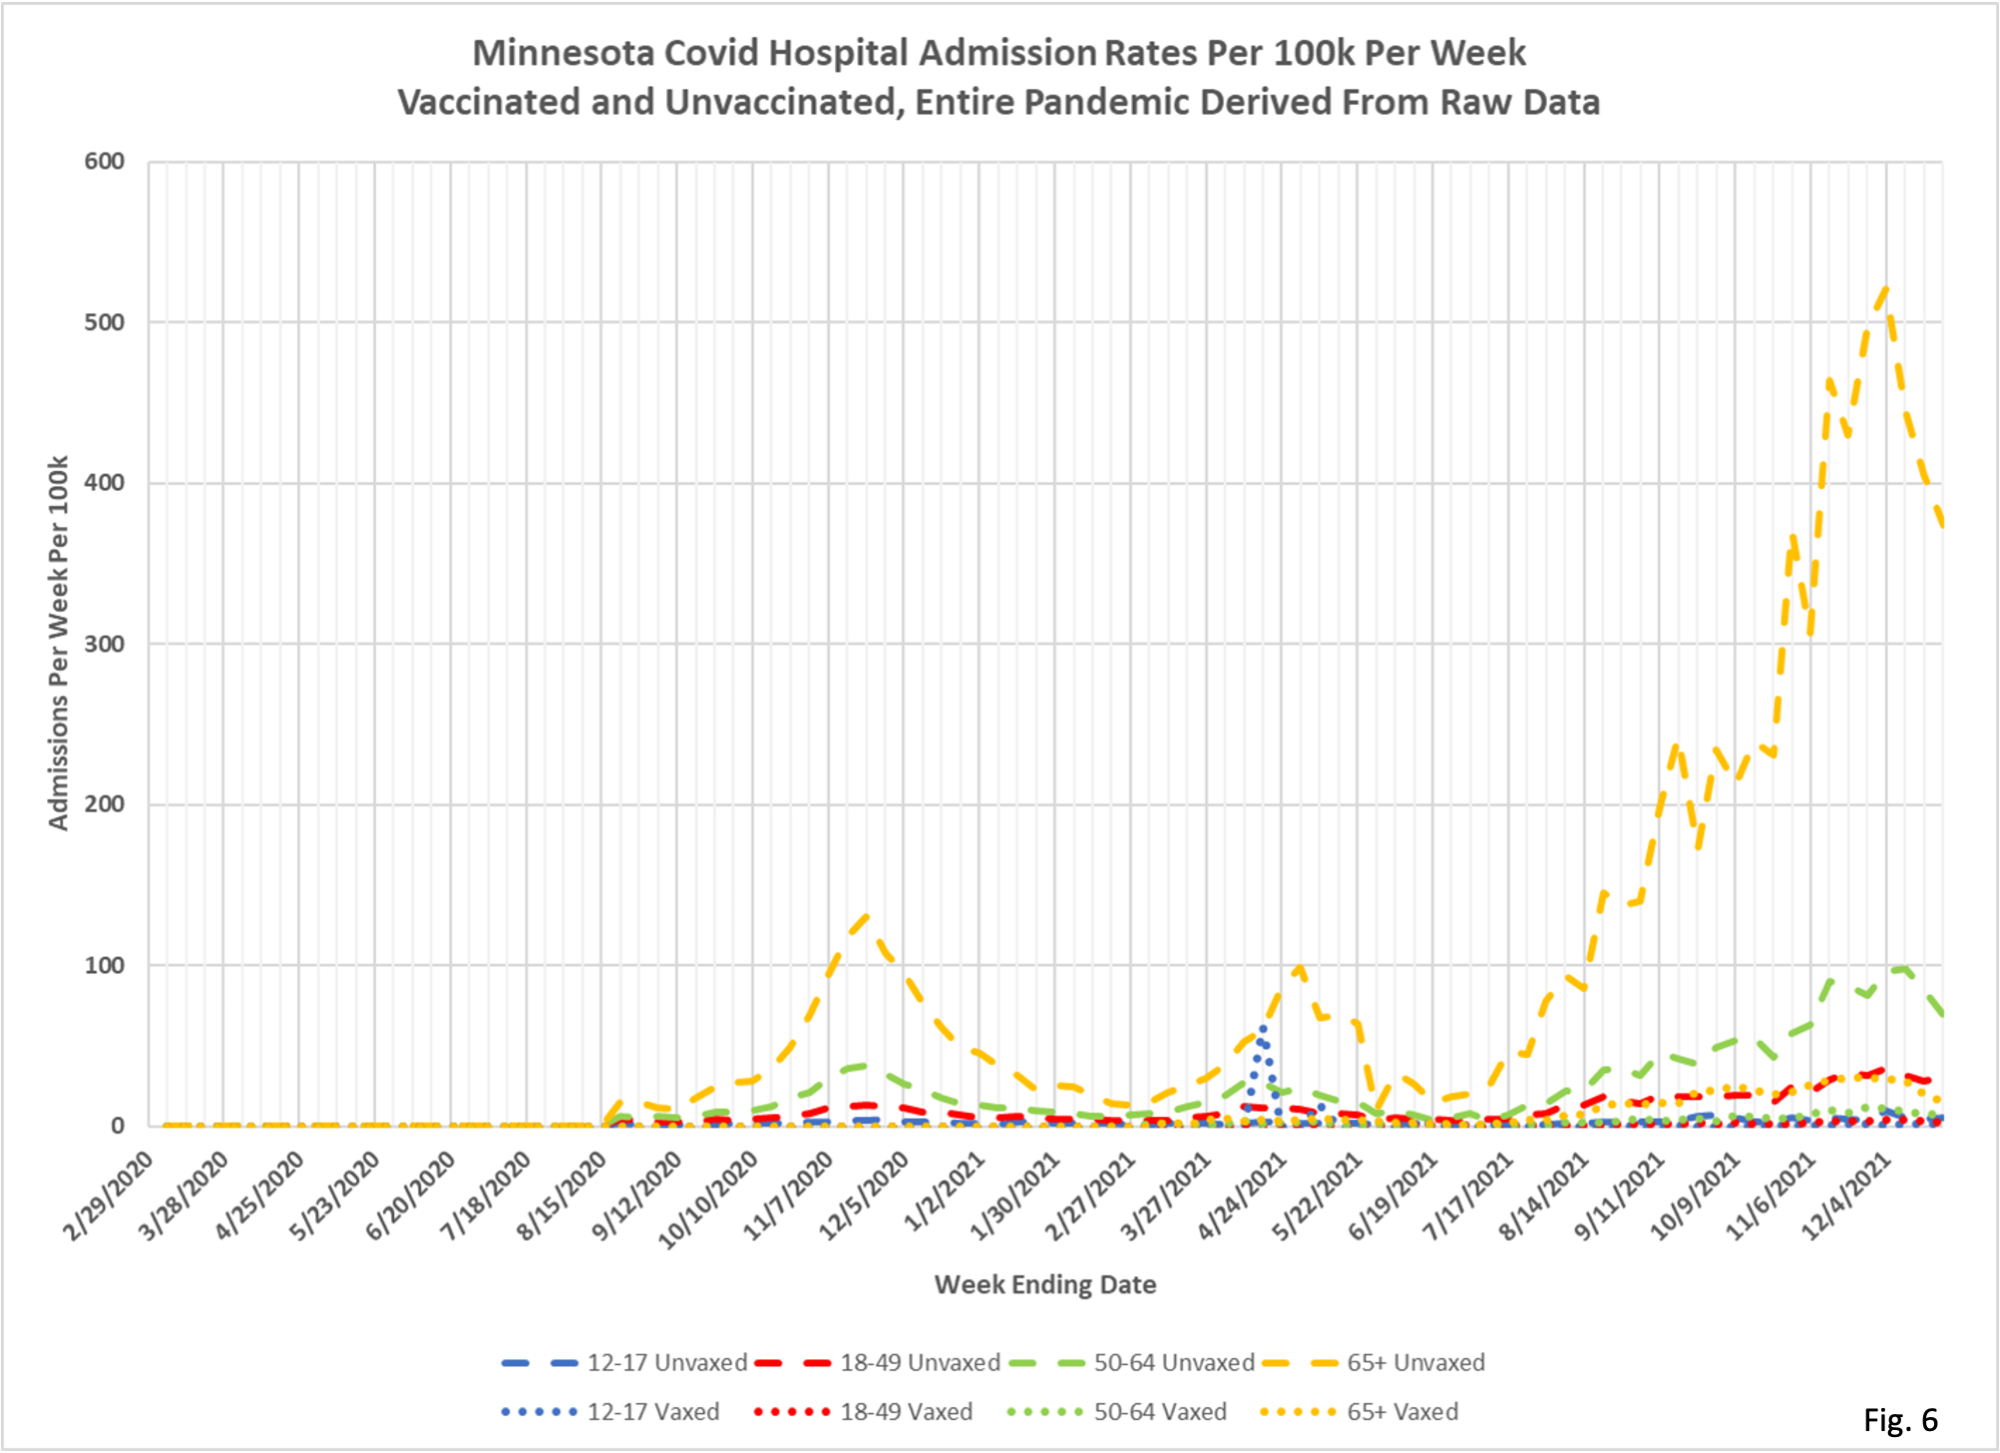
4. Note that the plots in Fig. 2 through 4 start on 5/02/2021, which is as far back as MDH’s published rates in vbtcirates.xlsx go. We are therefore unable to compare how the current surge compares to the earlier surge that peaked in December 2020. In order to see how these rates per 100k changed prior to 5/02/2021 it is necessary for us to replicate these graphs using raw data. We have found this to be somewhat difficult, because MDH does not publish all the necessary underlying data, but we have done so as described below.
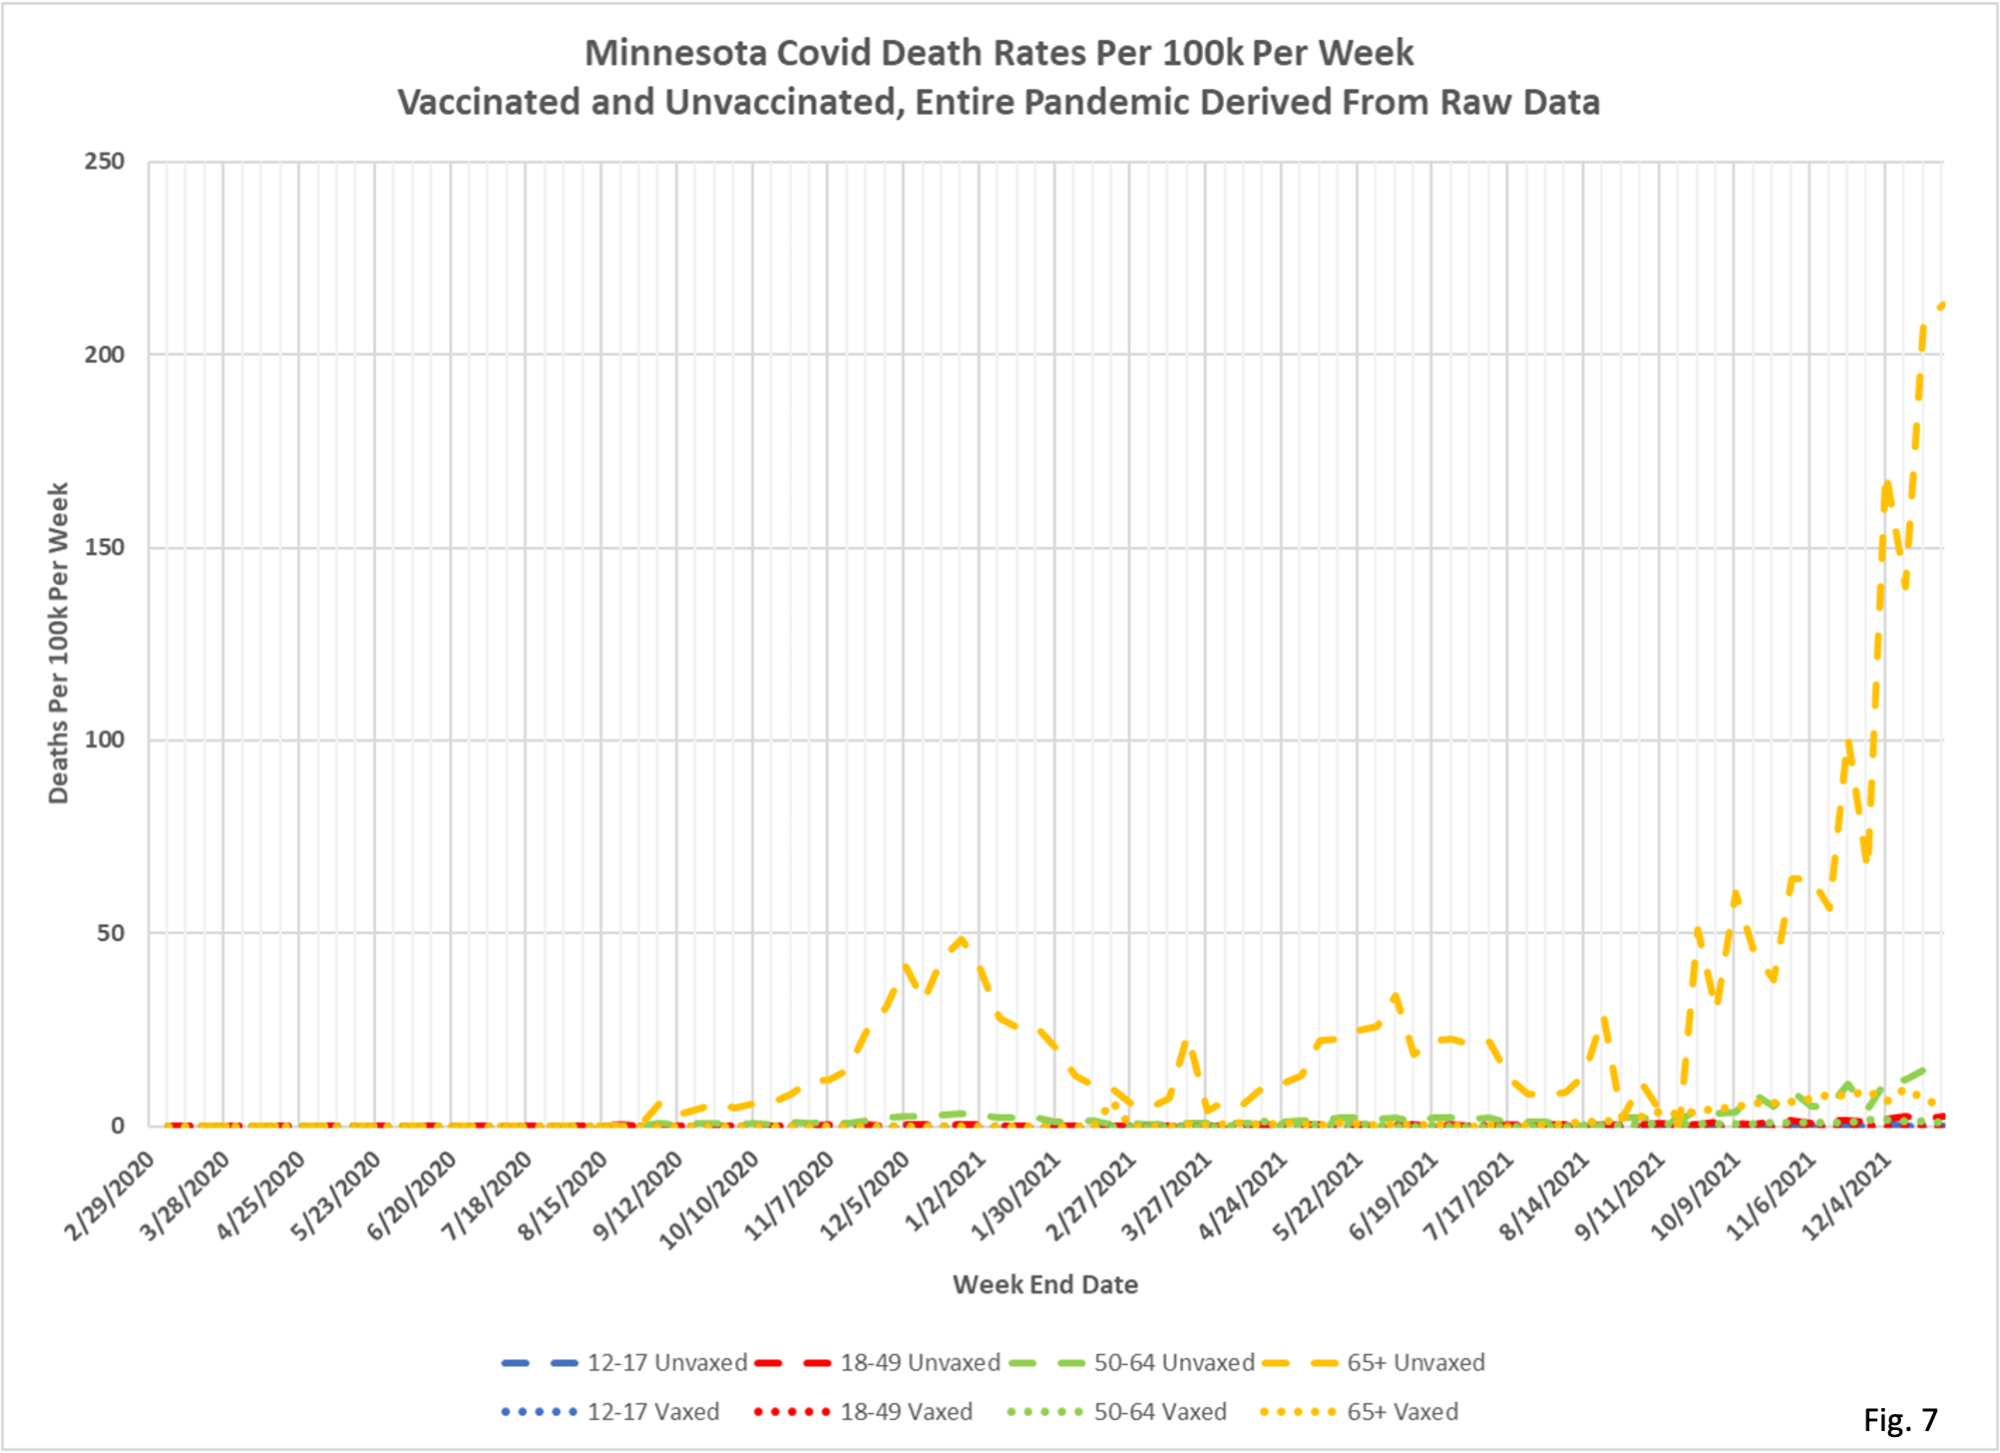
5. Fig. 5, 6, and 7 below are the charts of cases, hospitalizations, and deaths per 100k, replicating the MDH charts in Fig. 2, 3, and 4. These charts were derived from breakthrough case data provided to us under our Data Practice Act Request No. 21-211, which provides a line list of breakthrough cases by date, listing age and Yes/No flags for hospitalization and death. Because hospitalization and death dates were not provided we were forced to assume that hospitalization occurred 3 days after a positive case, and death occurred 14 days after a positive case. Cases are published by date of specimen collection, but the overall hospitalizations and deaths are obtained from the Minnesota Weekly Report, available here https://www.health.state.mn.us/diseases/coronavirus/stats/index.html. The Weekly Report does not state when these events occurred, it only reported each week what the new cumulative totals are. We are therefore forced to assume that there is a 1 week reporting lag for hospitalizations and a 2 week lag for reporting deaths. However, despite all of these assumptions, we have been fairly successful in replicating the MDH charts. By comparing the overlapping time periods in Fig. 2 and Fig. 5, for example, we can see in Fig. 2 that MDH’s case rate for the 65+ unvaccinated age group peaks at just over 1800 cases per 100k per week last November. Our replication in Fig. 5 peaks at roughly 2100 cases per 100k per week at the same time period, not too bad considering all of the assumptions and sources of error. Rates of hospitalizations, our Fig. 6 to MDH’s rates in Fig. 2, and rates of deaths, our Fig. 7 to MDH’s rates in Fig. 3, are also reasonably close to each other.
6. The point of this exercise was to see what these rates were like earlier in the pandemic, especially death rates. Our Fig. 7 shows rates of Covid deaths per 100k per week for each age group, vaccinated and unvaccinated. Our calculations show that the recent peak for the unvaccinated 65+ age group was a little over 200 deaths per 100k per week (MDH shows a peak of around 150 deaths per 100k per week in Fig. 4). Our analysis calculates that the death rate for the 65+ unvaccinated age group in December 2020 was only 50 deaths per 100k per week. The fact that recent death rates are higher than earlier in the pandemic raise lots of questions. Are deaths in vaccinated people not being accounted for as vaccinated, and reported as unvaccinated? Are unvaccinated death rates actually higher recently because recent variants are more deadly? Is MDH’s data incomplete or inaccurate? I don’t think we can provide an answer to these questions without a lot more data and information from MDH.


Thanks for the update and mentioning my question.
David thanks for the work.
I would have expected the death rate per 100k for the unvaxed during the two peaks of the 2nd and 3rd major waves ( Nov 2020-Jan 2021 and Nov2021-Jan 2022) to be slightly down in the 3rd wave , or approximately 80-90% in the later wave simply because, there fewer vunernable individuals remaining in the 3rd wave along with better treatment. My back of the envelop computation was approx 2x-3x increase which highly implausable to me, which led me to believe there were misclassification errors in the data gathering process (most likely unintentional)
In summary, I do agree that there appears to be a lot of misclassification errors in the MN DOH data sets