These analyses attempt to construct case cohorts with outcomes. Dave and I decided to break this into three periods. One is the entire epidemic, one since the lows of July 2021 and one since the Omicron surge. There has been remarkable stability in hospitalization and death outcomes for the most part, with some ups and downs most likely related to testing volumes, and recently some potential change due to Omicron. Dave’s notes:
- The cohort analysis is simply the calculation of the percentage of a set of Covid cases go on to be hospitalized or to die. In this case, we are analyzing positive cases that occur over successive 7 day periods.
- Since we do not have data that follows the outcome of each individual who tests positive, we are forced to simply compare hospital admissions over a period time to cases over a period of time. We assume that hospital admissions occur on average 3 days after the specimen collection date of the positive case. Deaths are similarly analyzed assuming that on average death occurs 14 days after the specimen collection date of the positive case.
- Data for Covid cases by specimen collection date, hospital admissions by date of admission, and deaths by date of death are available from the Minnesota Department of Health (MDH) Situation Update for COVID-19 web page, https://www.health.state.mn.
us/diseases/coronavirus/ situation.html. The data is downloaded, sums for 7 day periods are calculated, and the hospitalization and deaths rates are determined and plotted. - Because we know there are lags in reporting we have not plotted all of the available data. We have assumed that the last 7 days of hospitalization data is incomplete. Including the assumed 3 day lag from positive case to hospitalization, this means that we are not displaying the last 10 days of data based on specimen collection date. For deaths we assume that the last 14 days of death data is incomplete. With the assumed 14 day lag from positive case to death, this means were are not displaying the last 28 days of data based on specimen collection date.
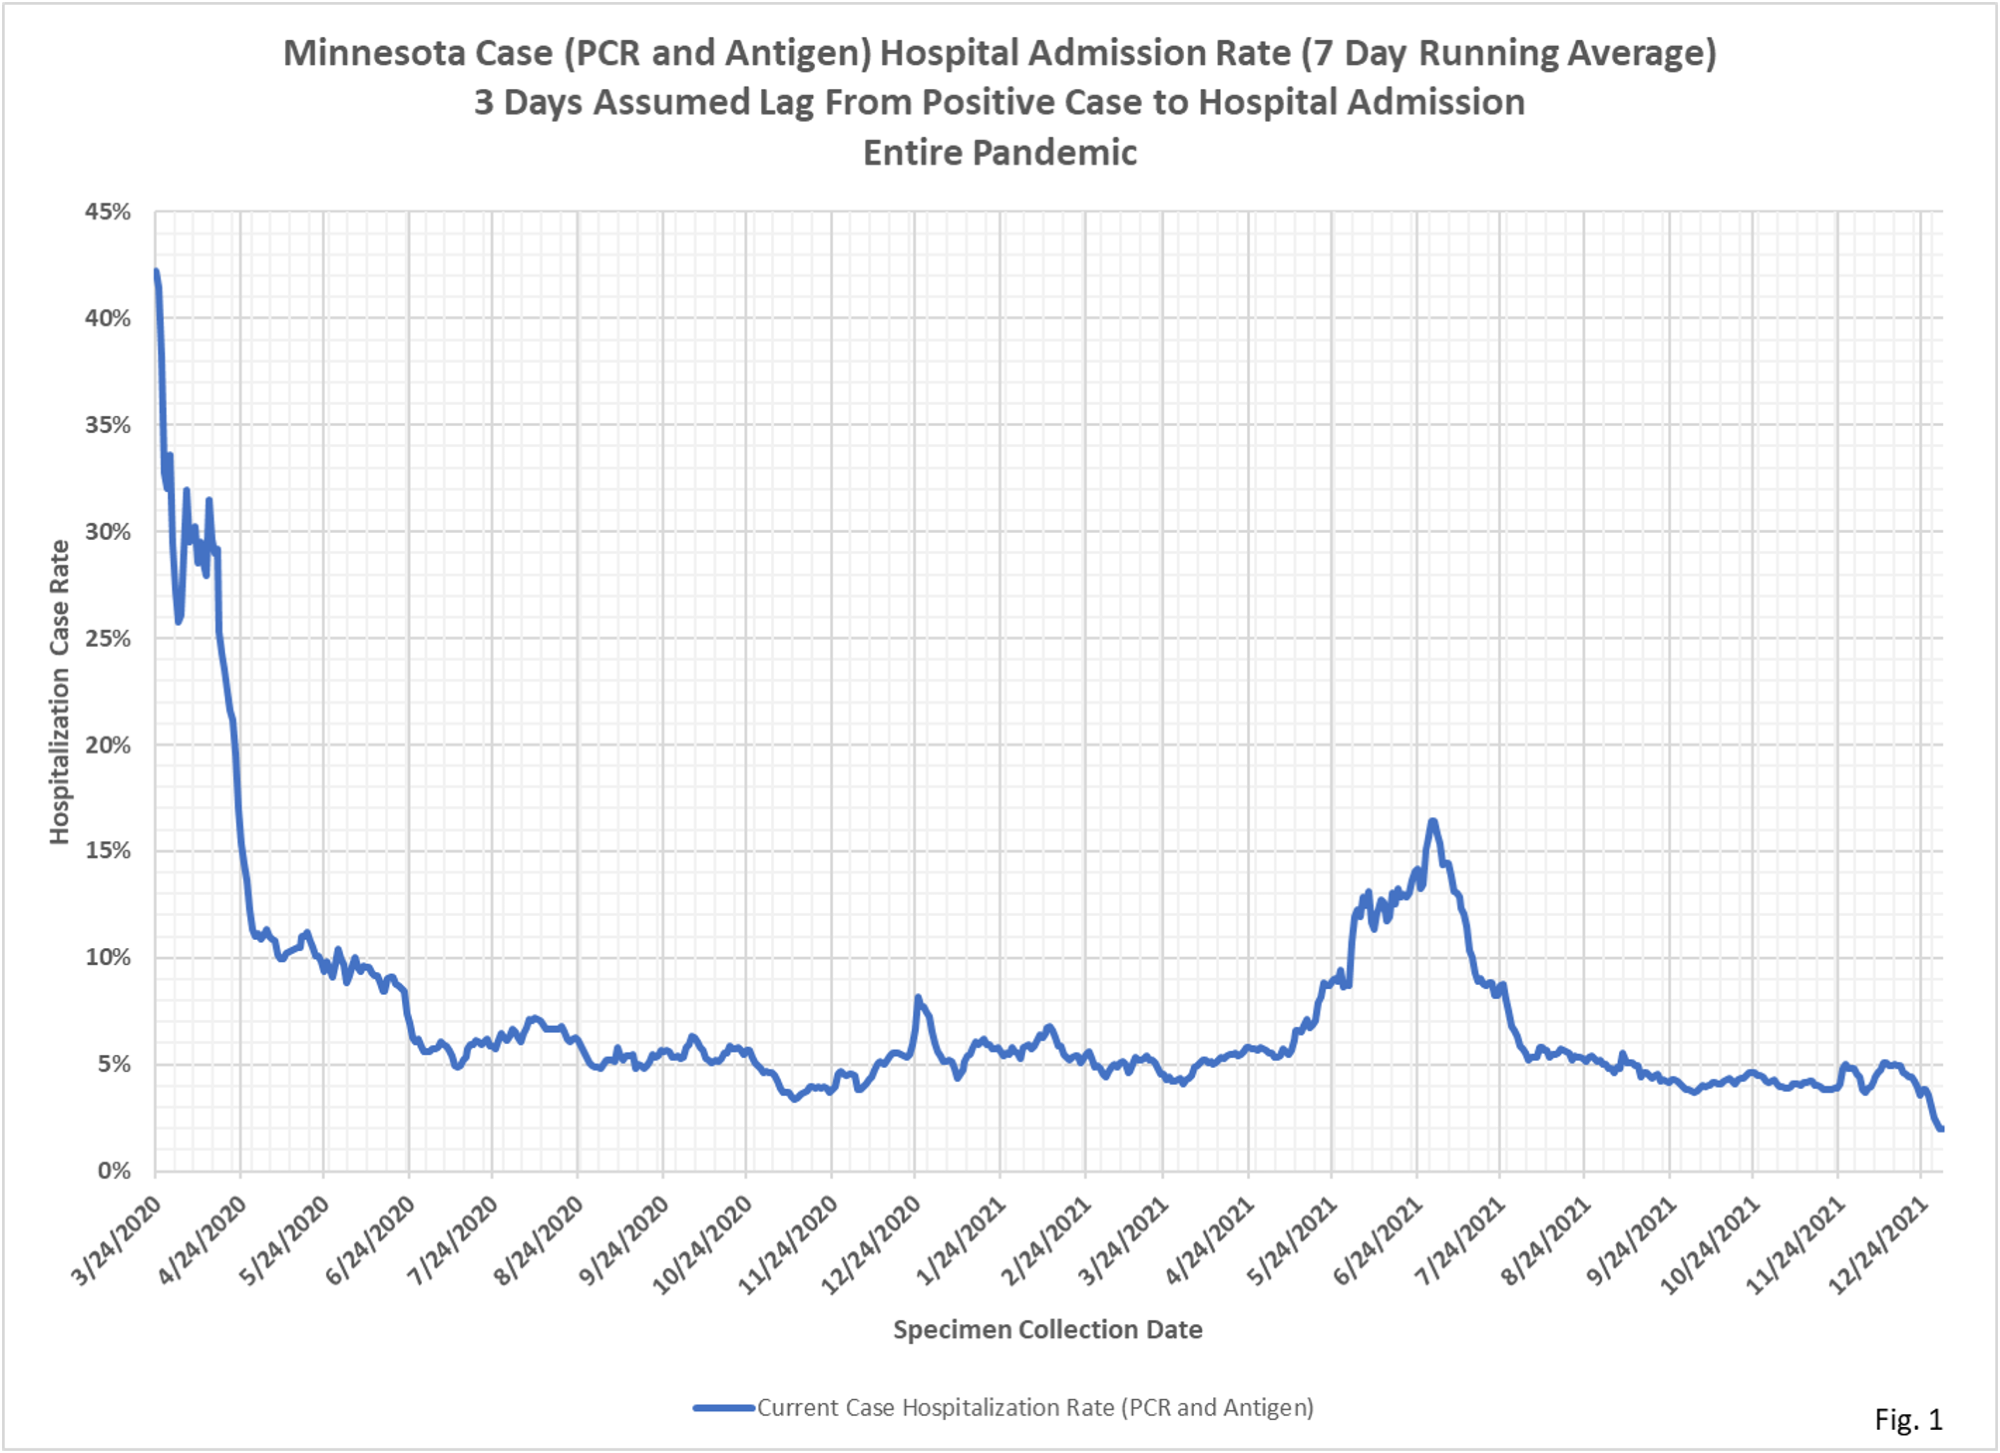
- Case hospital admission rates are displayed in Fig. 1, 2, and 3. Fig.1 displays the entire pandemic, with the high hospital admission rate above 40% early in the pandemic very likely due to low testing rates. The hospital admission rates around 5% throughout 2020 are more representative. It is unclear why rates spiked to 15% in June, 2021. This may be due to lower testing rates while school was out.
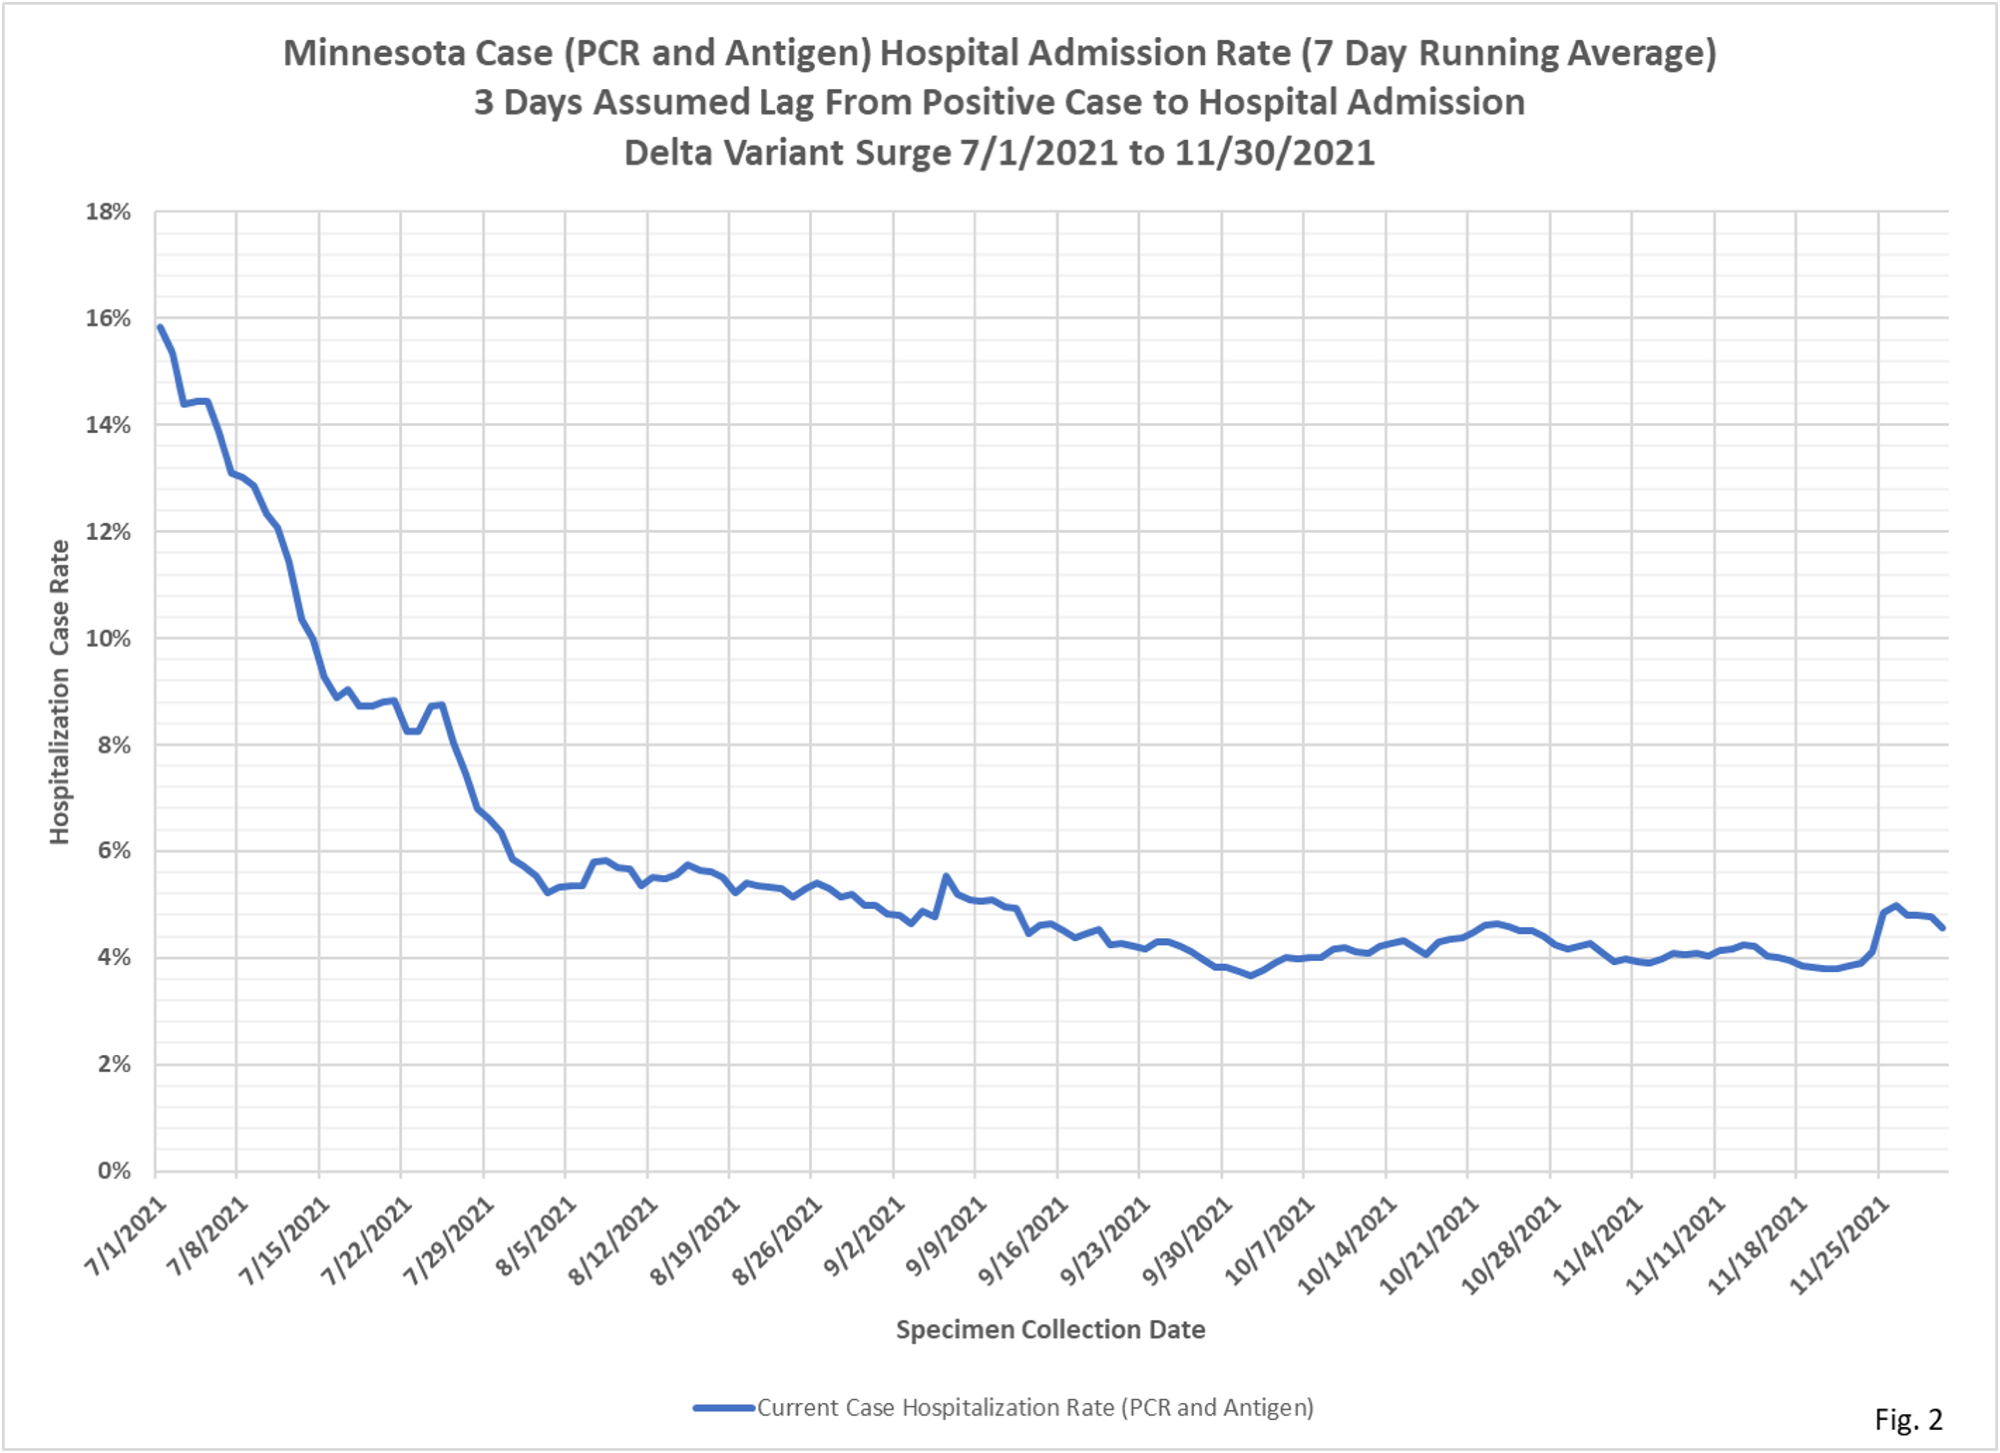
- Fig. 2 displays the case hospital admission rates for specimen collection dates during the Delta variant surge in cases, from 71/1/2021 to 11/30/2021. During this time period the hospital admissions rates stabilized in the range of 4% as cases rose.
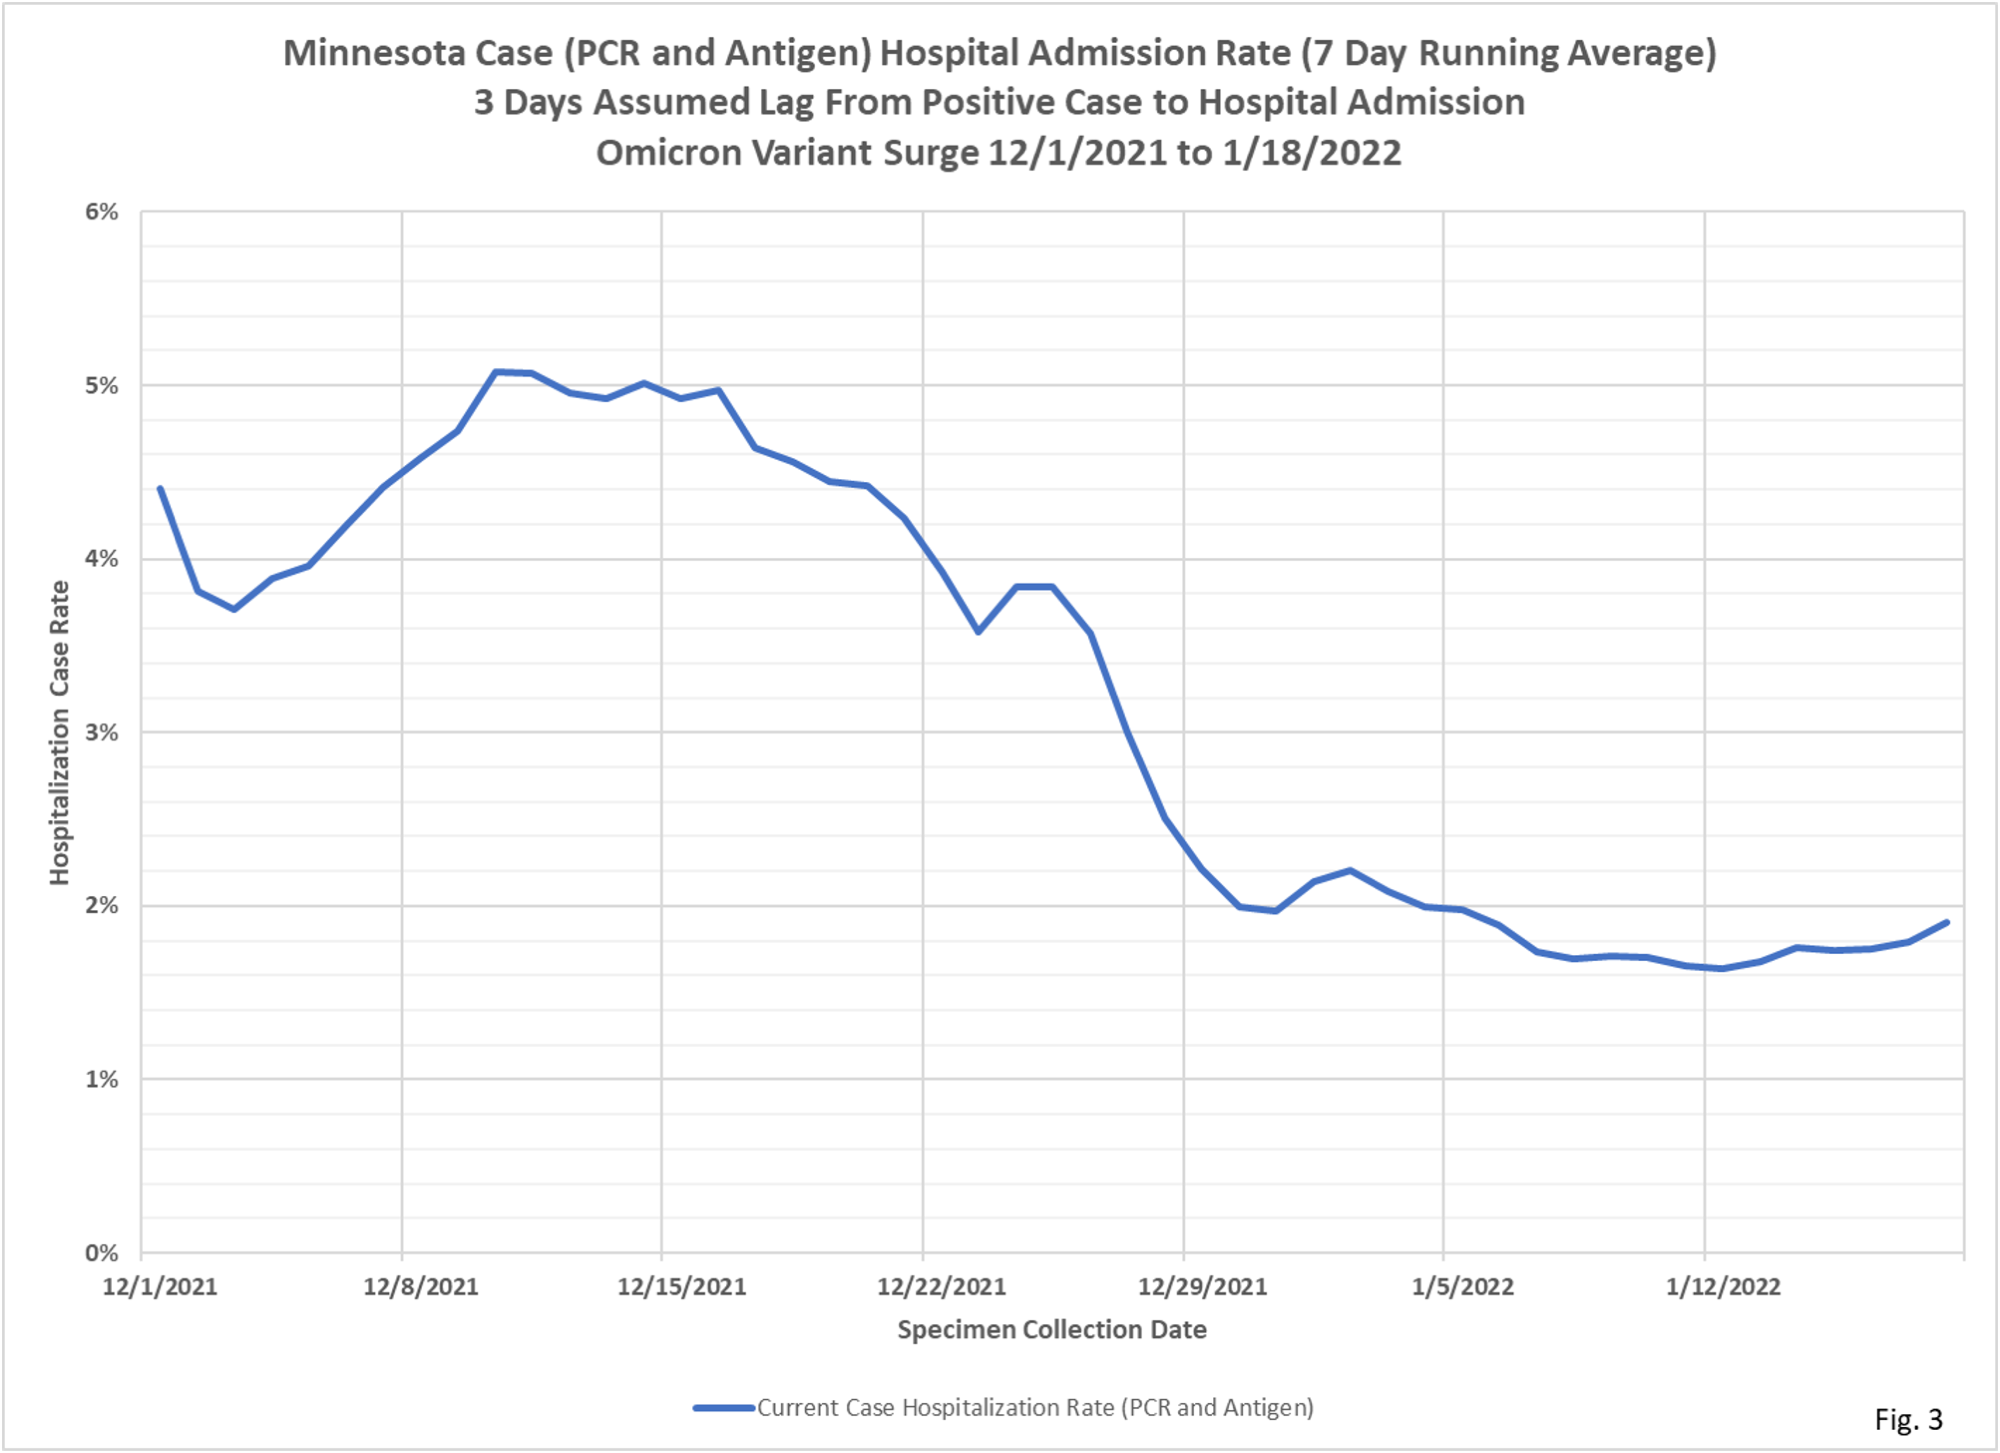
- Fig. 3 displays the case hospital admission rates for specimen collection dates during the Omicron variant surge in cases, from 12/1/2021 to 1/18/2022, the last date we think we have relatively complete hospitalization data. We can see that during this time period the case hospitalization rate fell by half, from 4% to 2%. With more time passing we will be able to verify whether this drop is indeed due Omicron being less virulent or to the positive effects of higher vaccination rates, or due to incomplete data reporting by MDH.
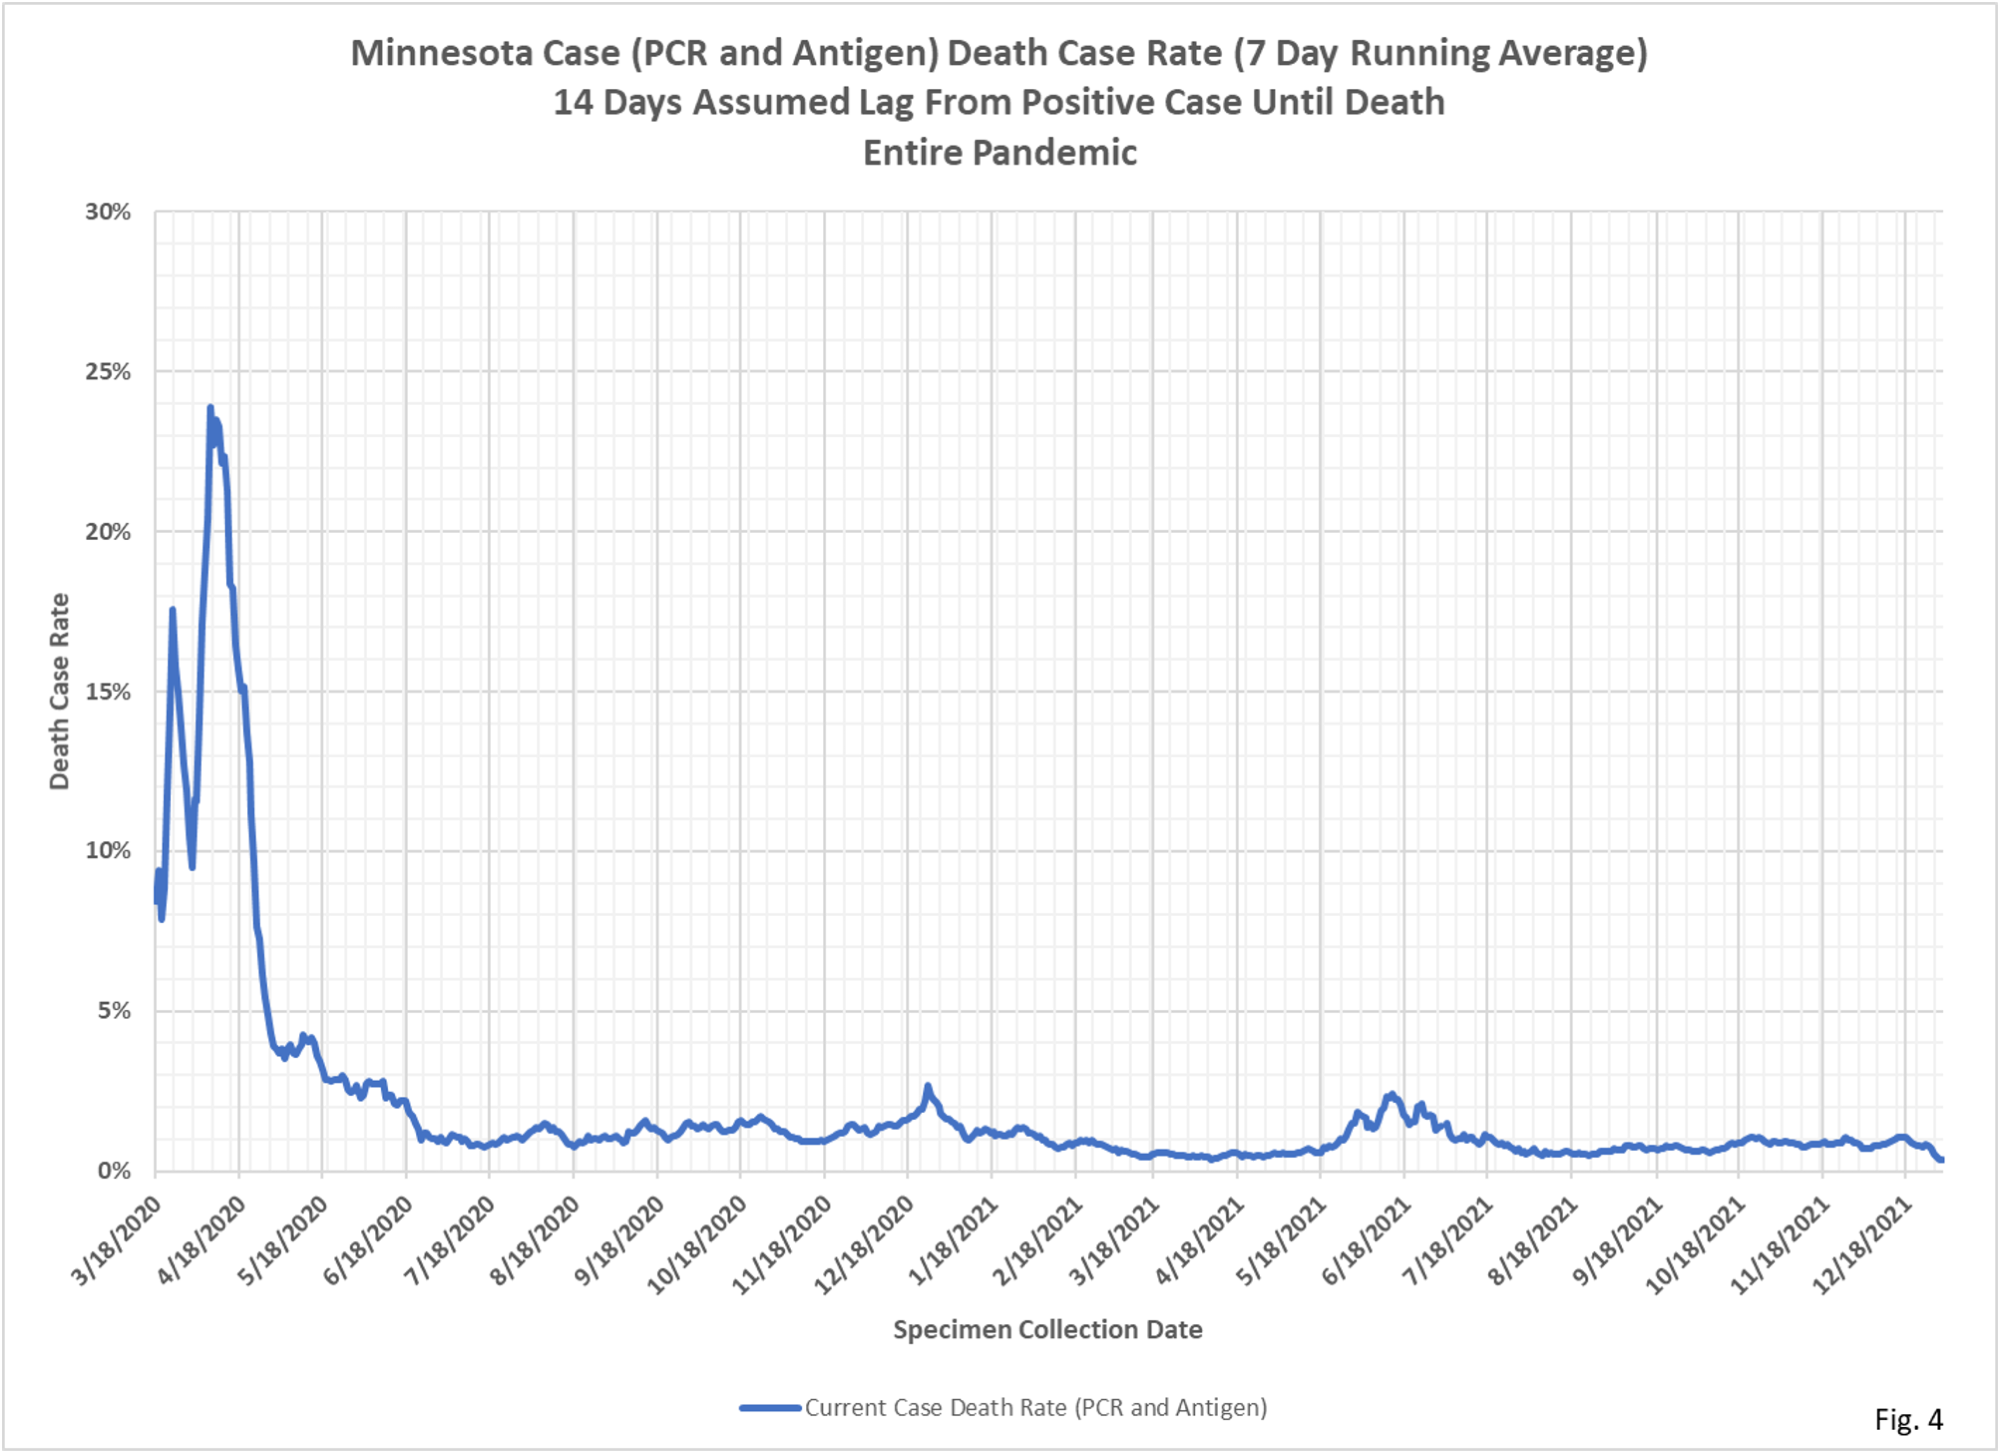
- The charts for the case death rates are shown in Fig. 4 through Fig. 6, using similar time periods as used for case hospitalization rate charts. Fig. 4 display the case death rates for the entire pandemic, the percentage of positive cases who are reported to die of Covid. Just as for case hospitalization rates, the high rates in early 2020 are likely due to low testing rates. As testing increases the case death rate dropped to between 1% and 3% throughout most of 2020. The spike in the case death rate in late 2020 is possibly due to low testing over the Christmas holiday. There is a corresponding spike in the case hospitalization rate at the same time. The rise in case death rates in the summer of 2021 also corresponds to the rise in case hospitalization rates at the same time, possibly due to low testing rates during that time period.
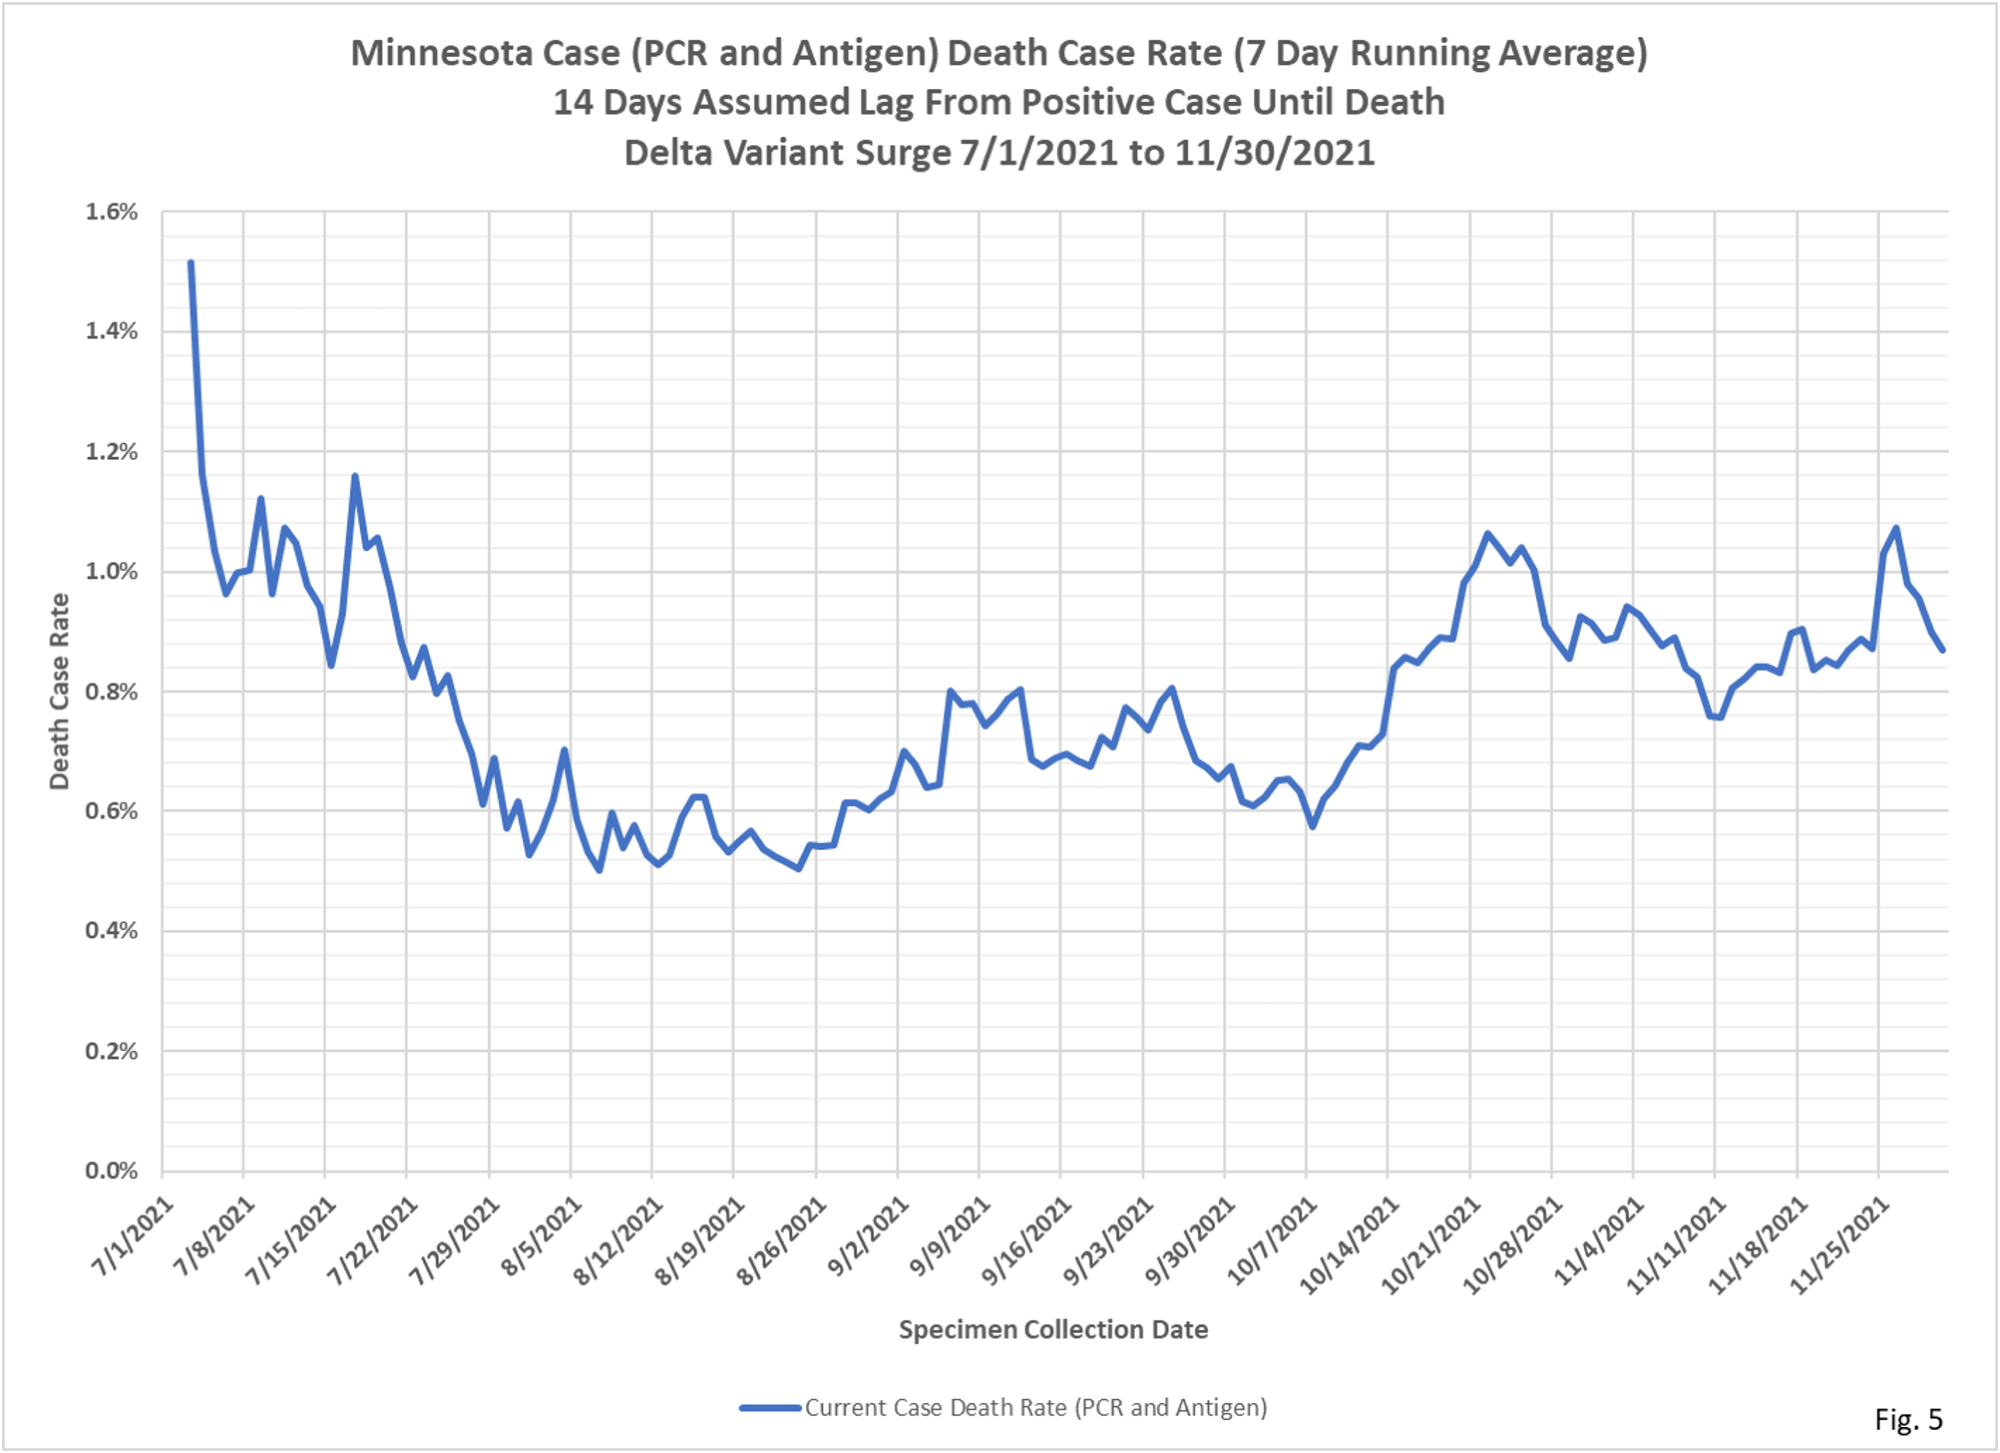
- Fig. 5 displays the case date rates for specimen collection dates during the Delta variant surge in cases, from 7/1/2021 to 11/30/2021. During this time period the case death rates varied from 0.5% to 1.1%.
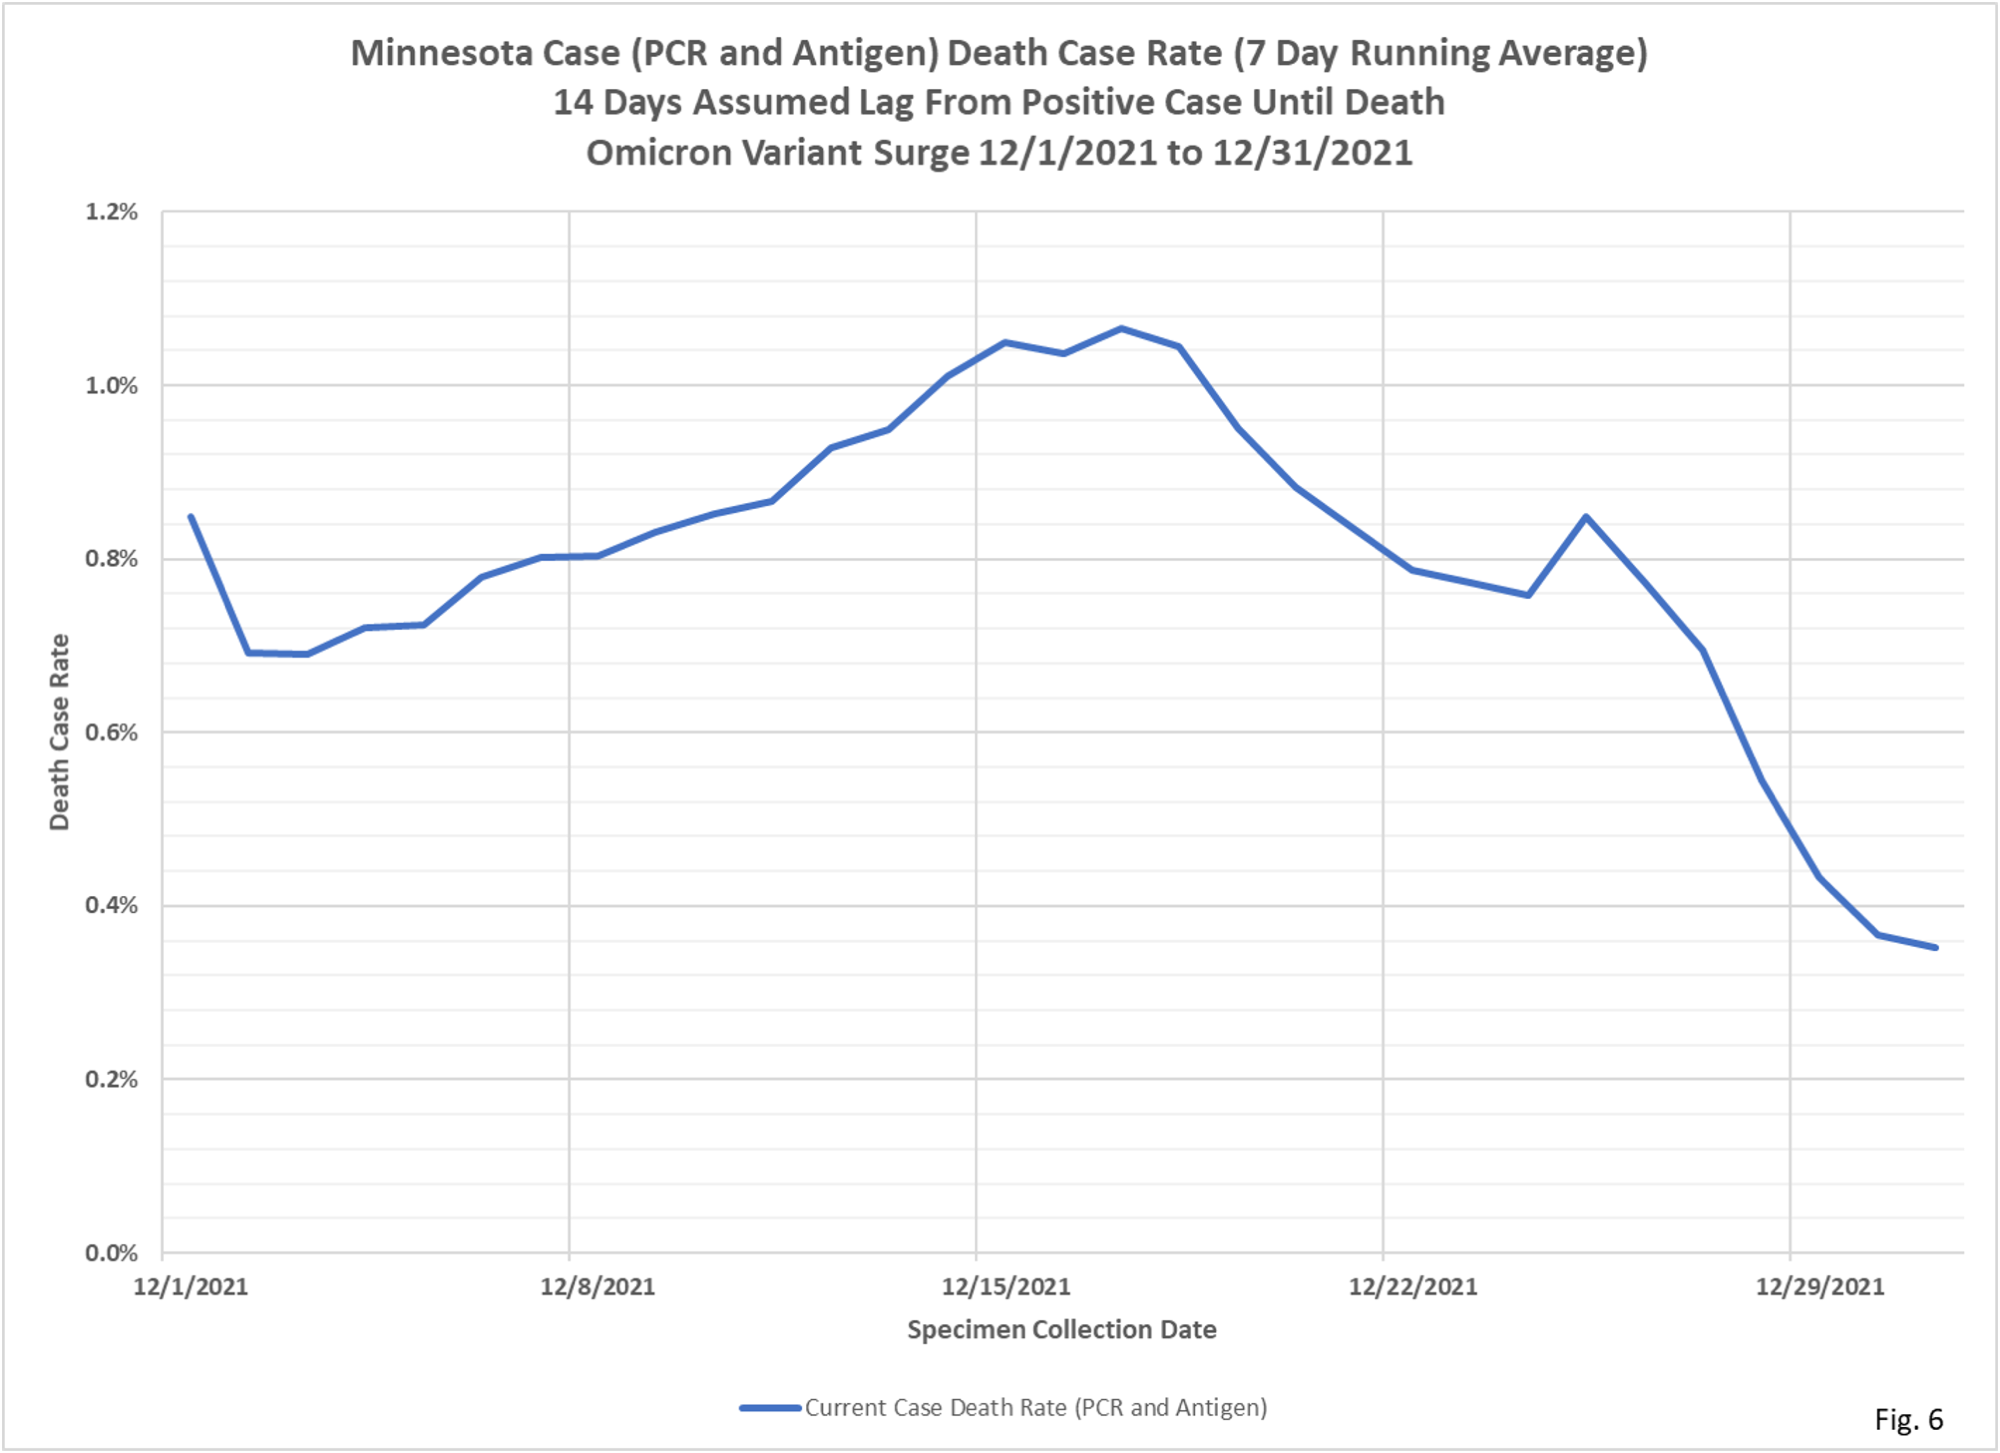
- Fig. 6 displays the case death rate for specimen collection dates during the Omicron variant surge in cases, from 12/1/2021 to 12/31/2021. The end date of 12/31/2021 was chosen based on the assumed 14 day lag from case to death, and the assumed 14 day lag in complete reporting of deaths. We can see that the case death rate fell to less than 0.5% toward the end of the time period. More time and data will be needed to see if this reduction in case death rate is due to less severe outcomes of the Omicron variant, or due to incomplete reporting by MDH.

Is the data you are publishing in-line with traditional death rates? Is there anything unique to the Covid virus?
there have been total excess deaths in Minnesota, largely attributable to CV-19 but also due to other causes. The majority of these deaths have been in persons near the end-of-life in any event.