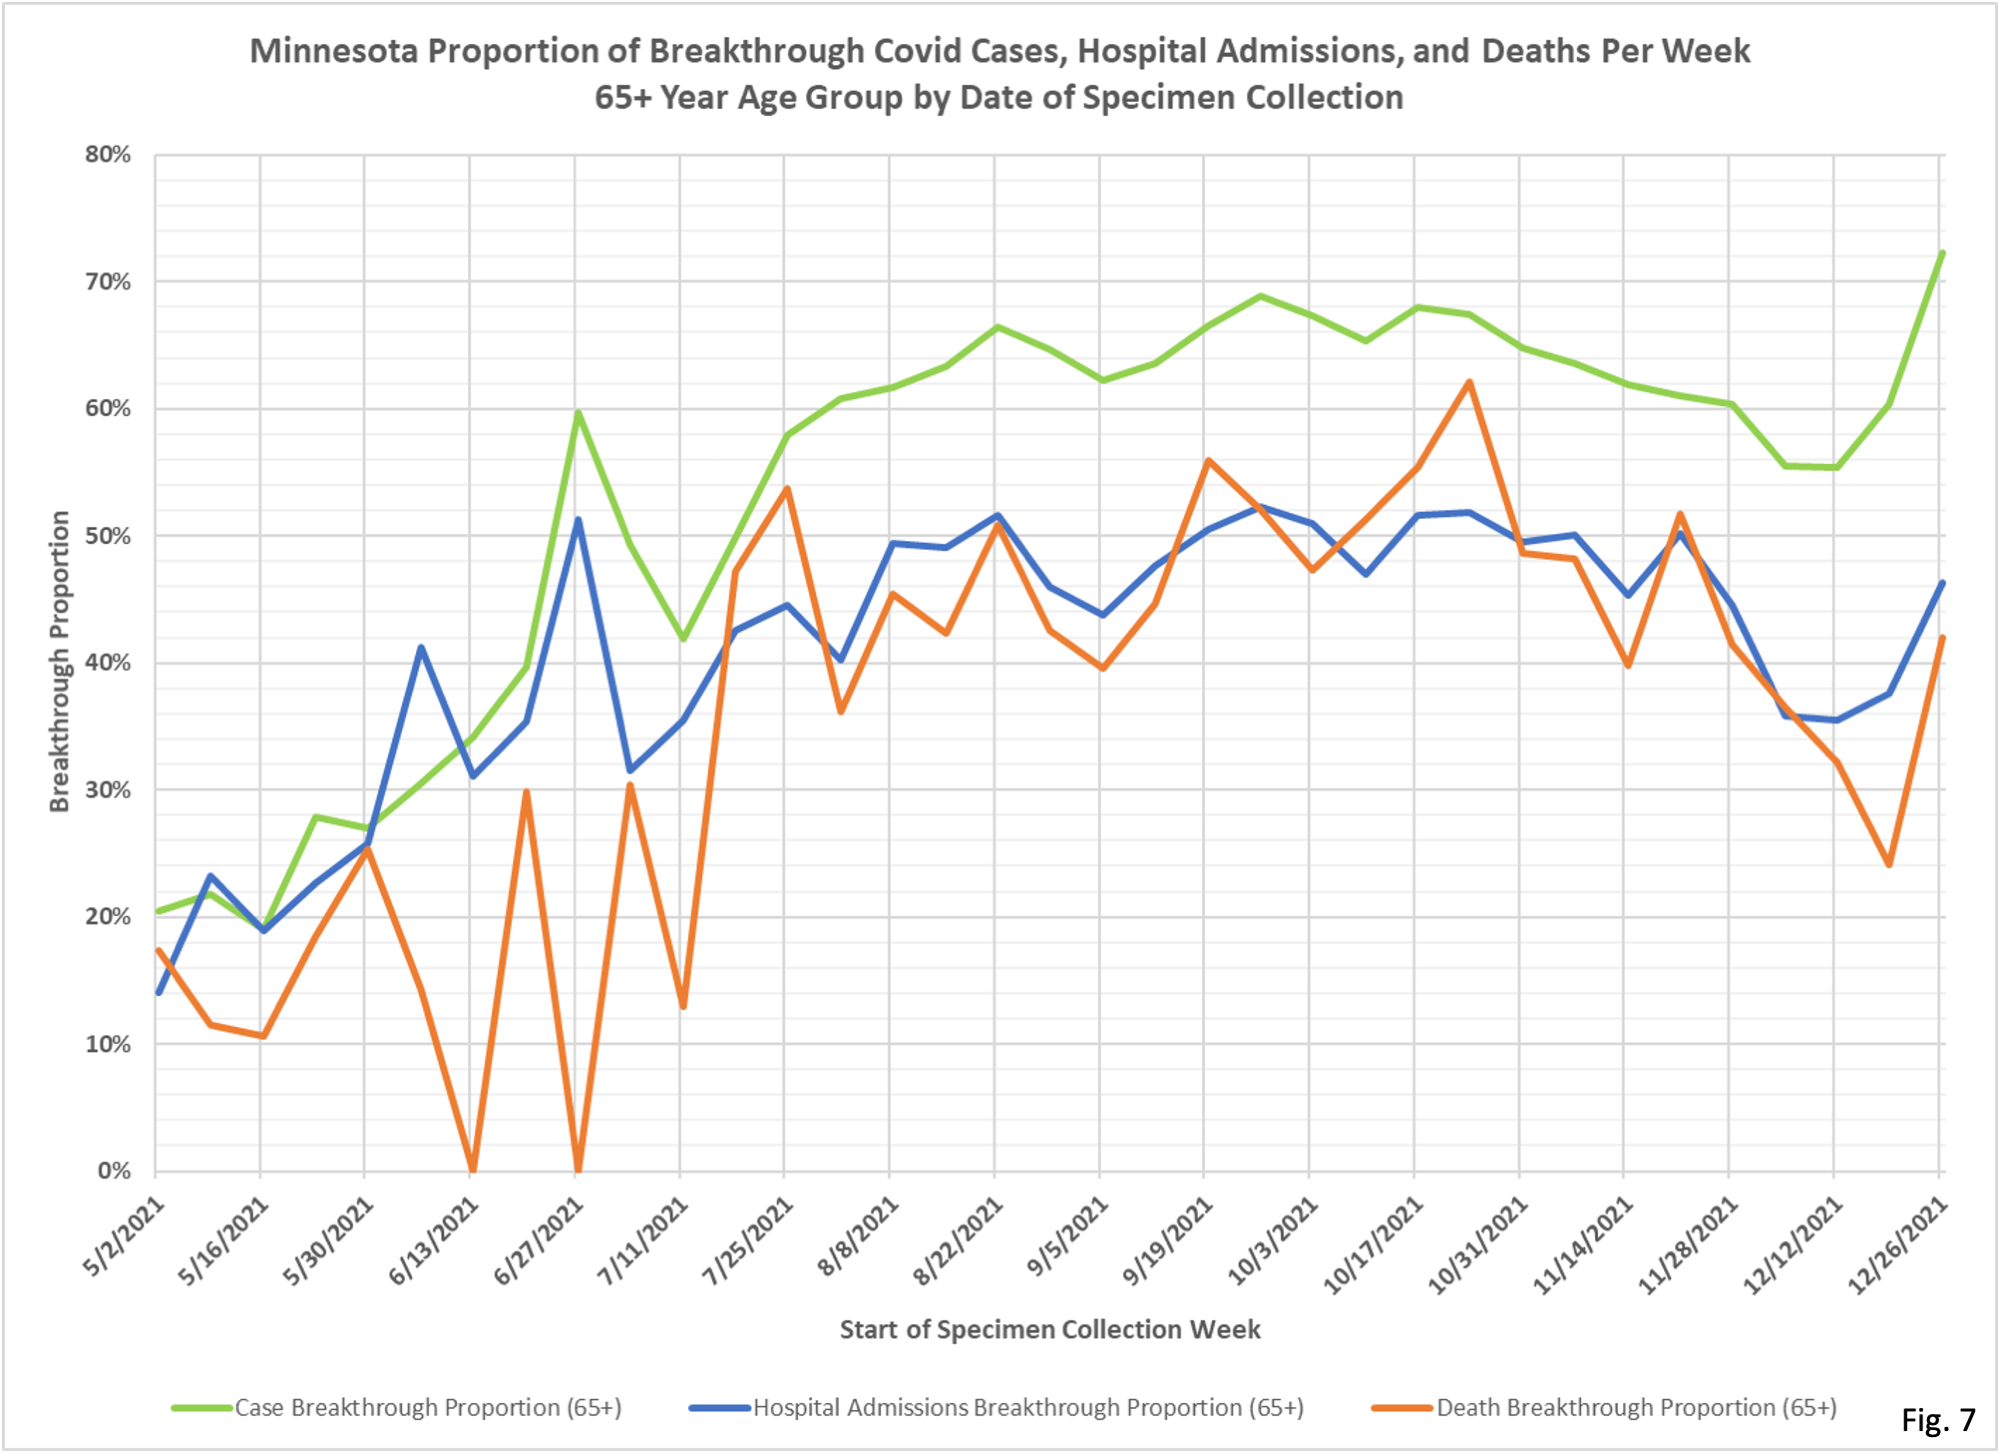
Monday data dump on breakthroughs. We are reaching milestones. 60% of reported cases were breakthroughs, 38% of hospitalizations were. The data lags a month. I assume, and Dave and I have been right on this all along, that by now at least 70% to 80% of cases are in the vaxed. There were over 50,000 new breakthrough cases reported this week. Meanwhile only about 9500 reinfections were reported in the past week. While there are more vaxed persons than infected persons, there aren’t five times more, so the rate of breakthrough continues to be much higher than the rate of reinfection. Look too at the age structure. You can see that in the heavily vaxed old groups, as you would expect, proportion is highest, over 70%, but growth rate is also very high, and this is the boosted group. I hate to say it, but looks to me like no matter how many shots you give someone, there is no lasting protection against infection.
Dave’s notes:
- The table and charts are updated for new data released by Minnesota Department of Health (MDH) on 1/31/2022, adding data for the week starting 12/26/2021. This week was getting well into the Omicron surge, which peaked in Minnesota on 1/10/2022. Next week Monday’s breakthrough data release will cover the time of 1/02/2022 to 1/08/2022, right before the peak in cases.
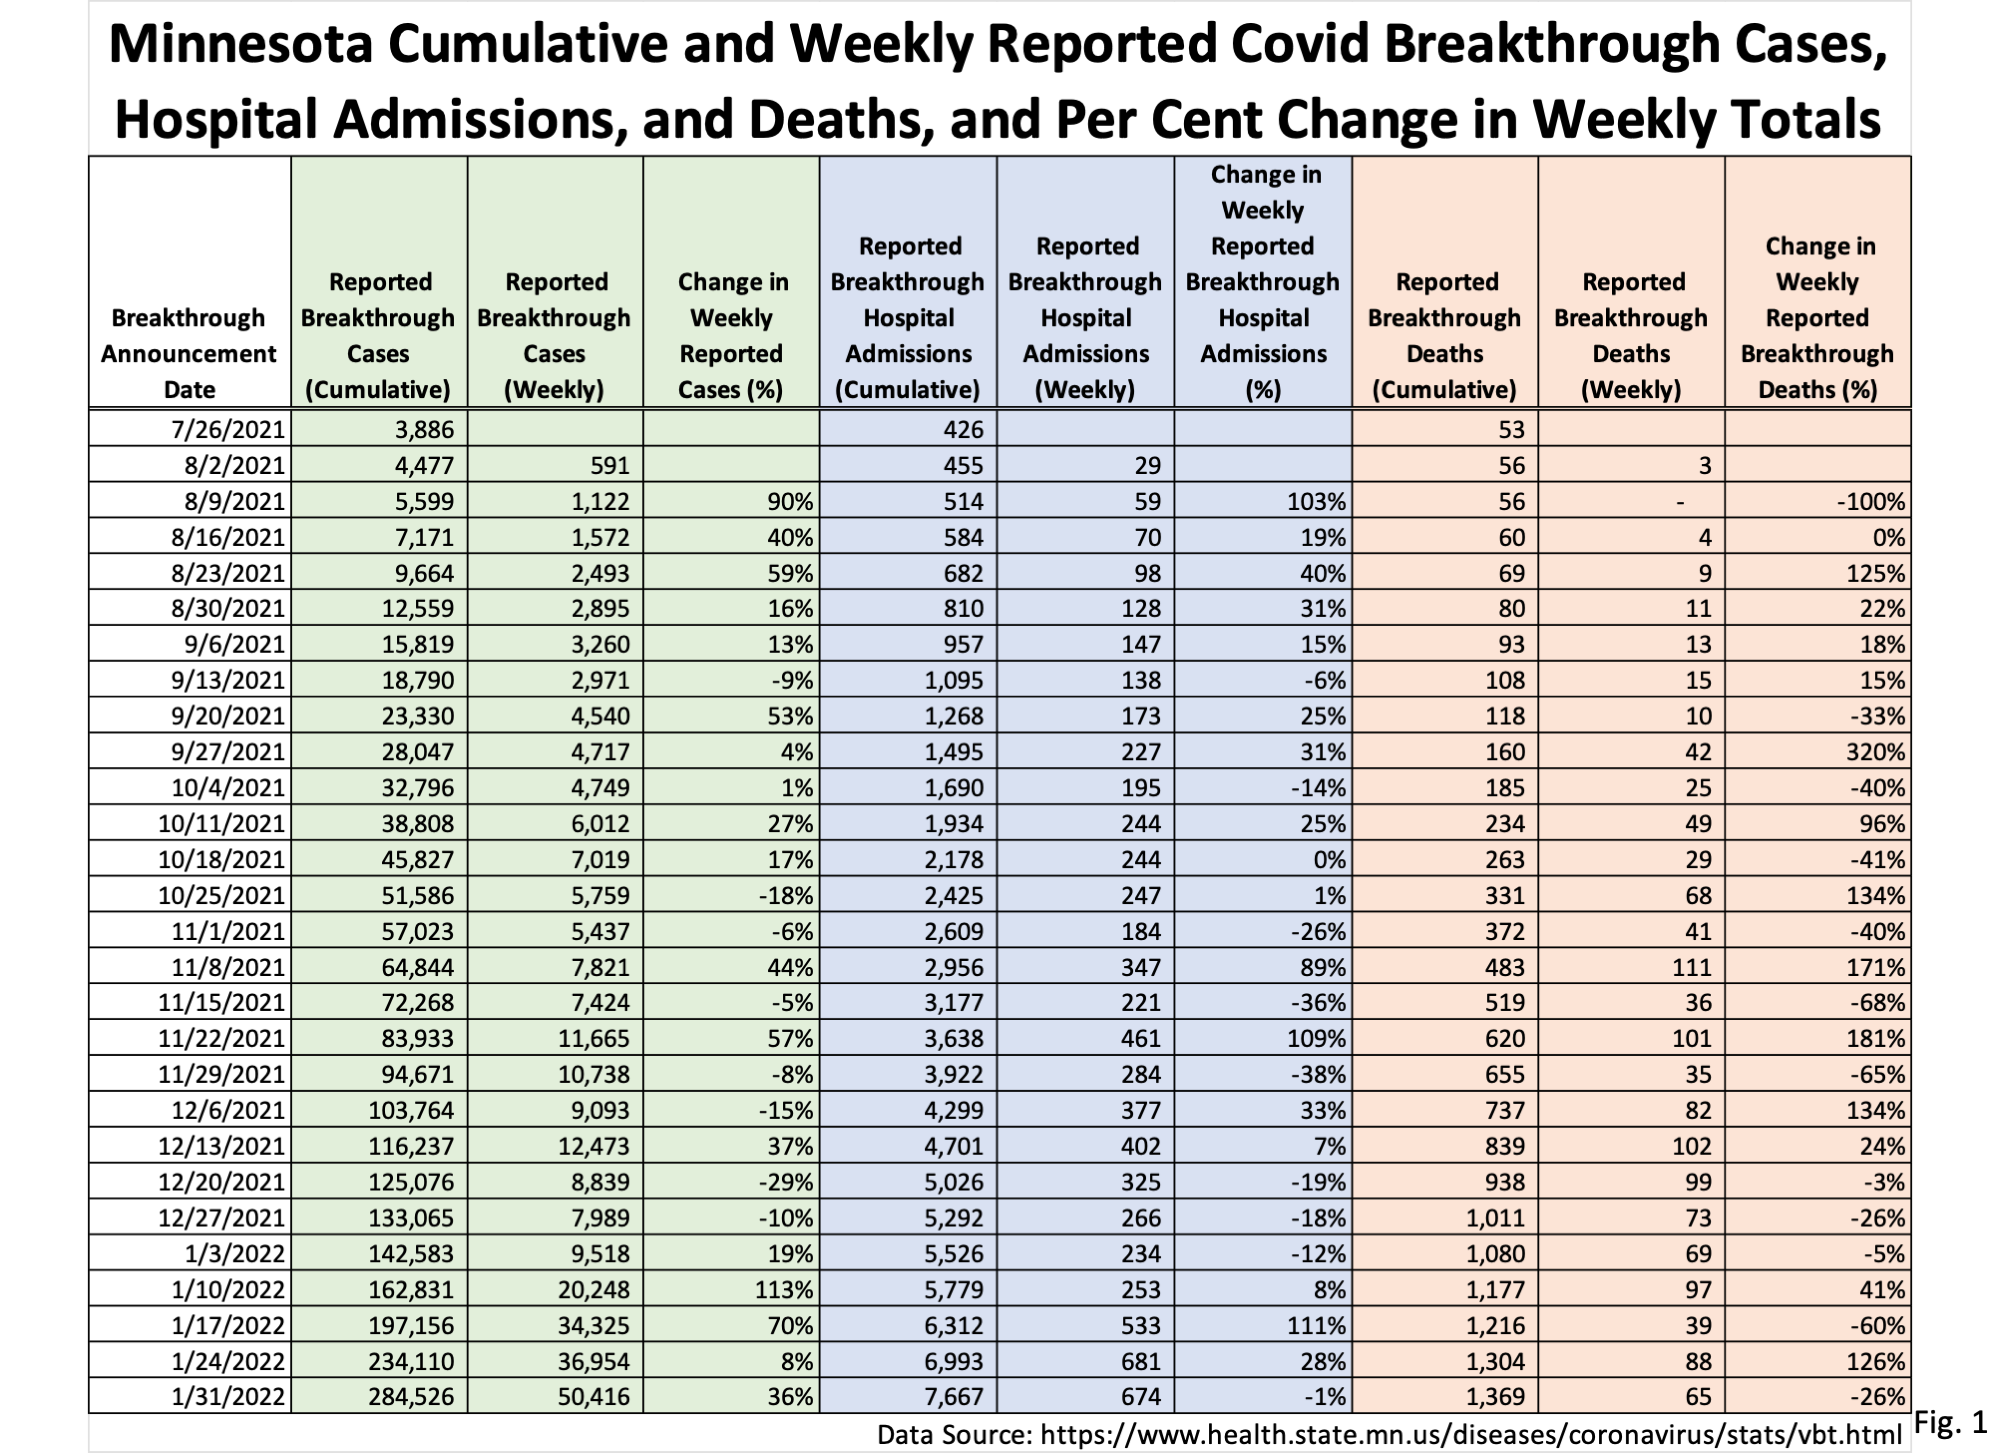
- The data source for the data on Fig. 1 is the cumulative breakthrough cases, hospitalizations, and deaths published on the MDH COVID-19 Vaccine Breakthrough Weekly Update https://www.health.state.mn.us/diseases/coronavirus/stats/vbt.html
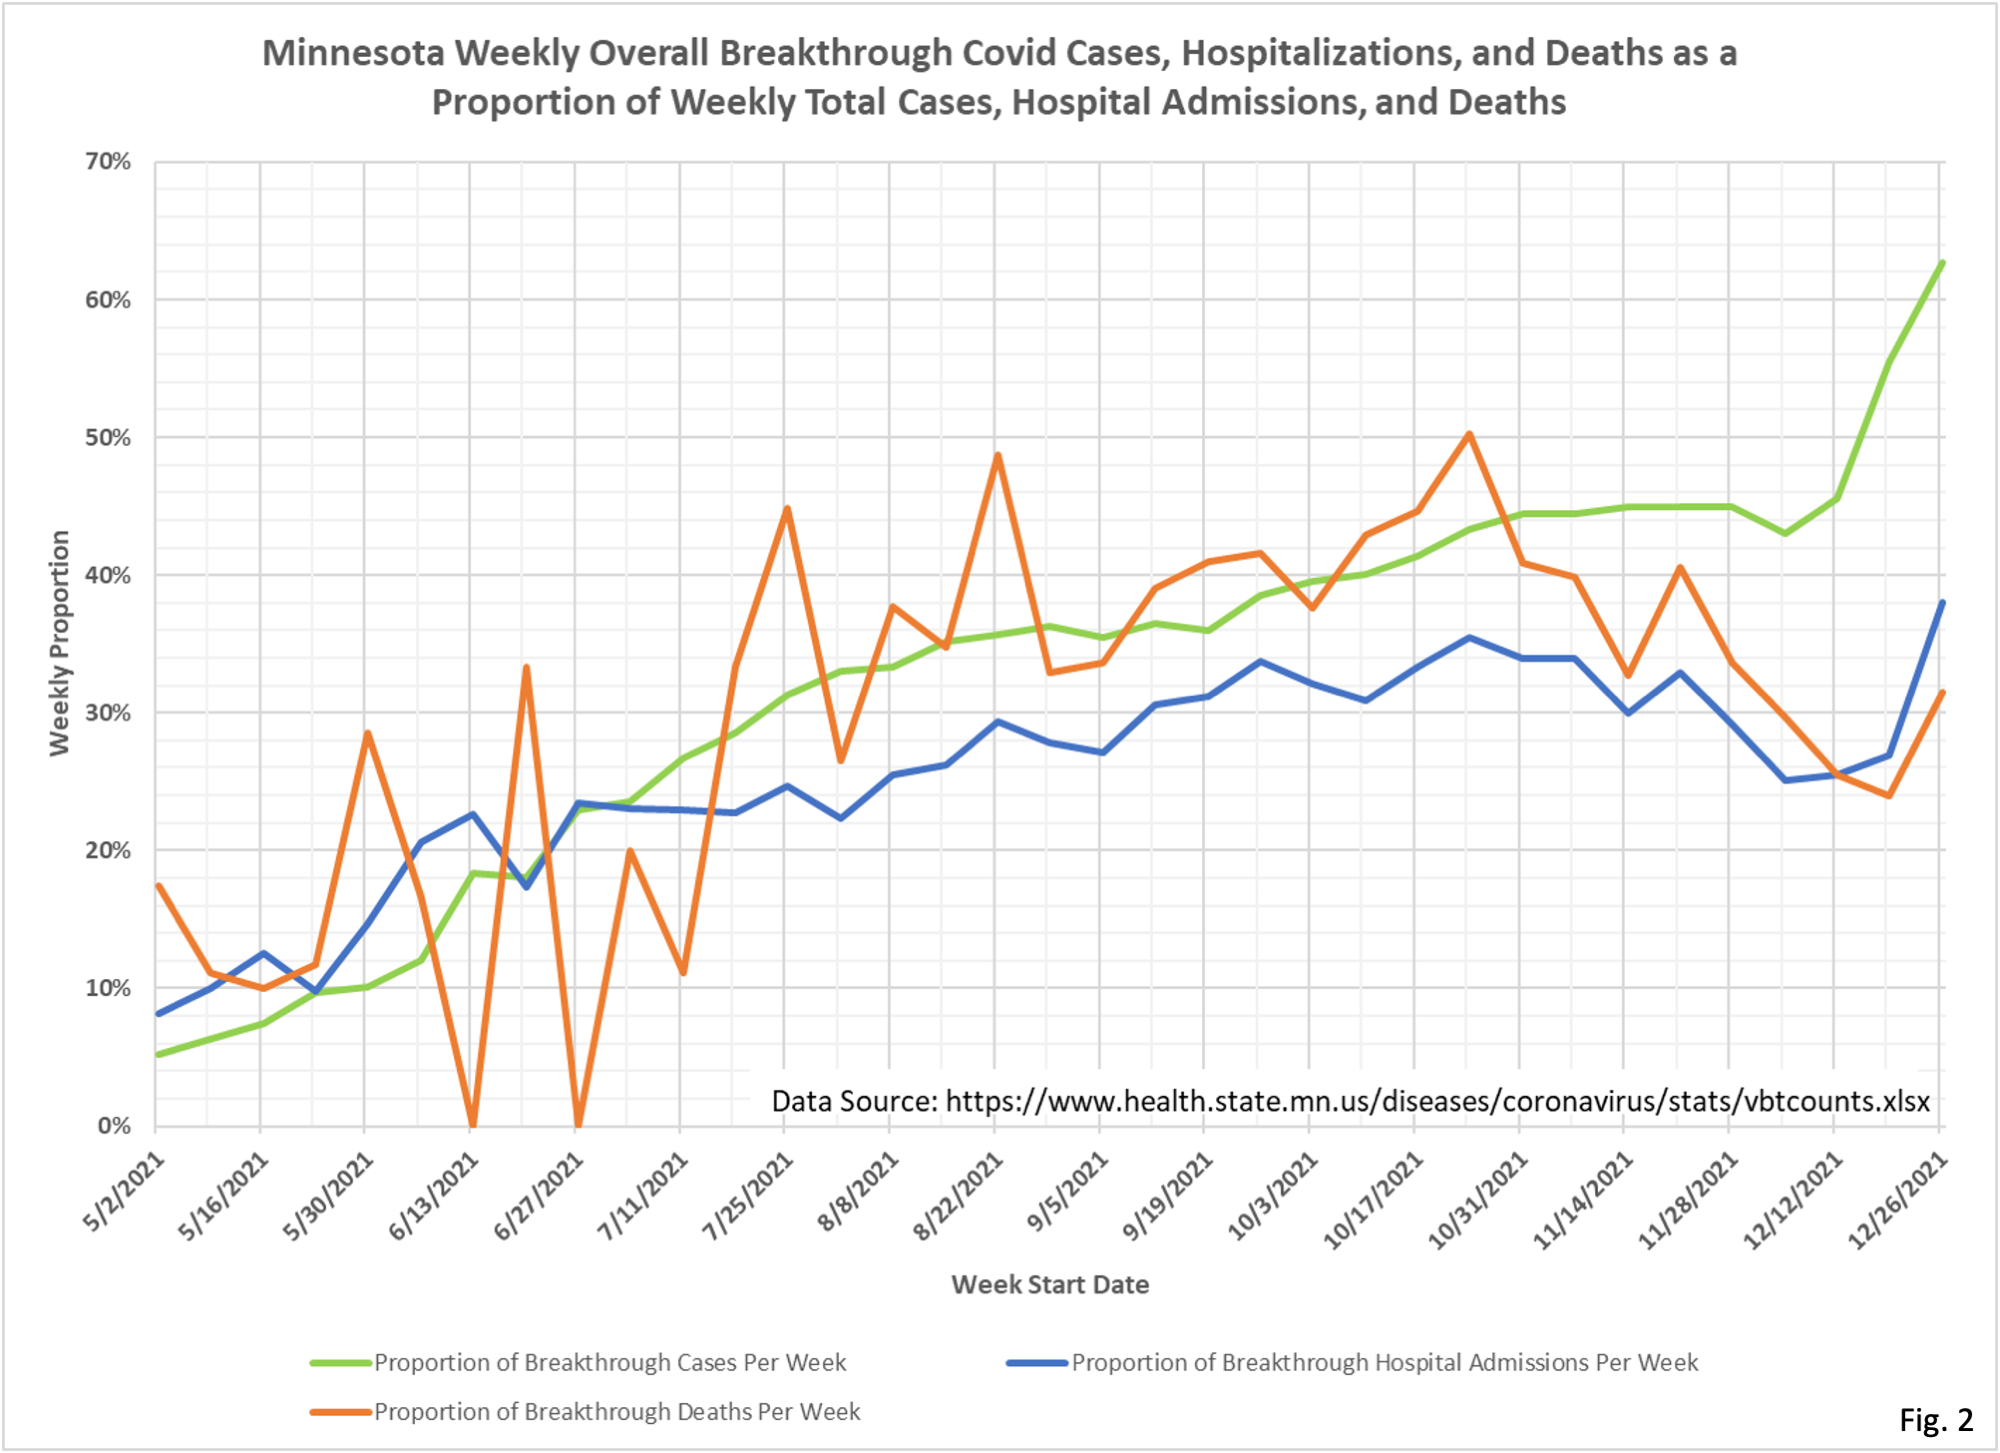
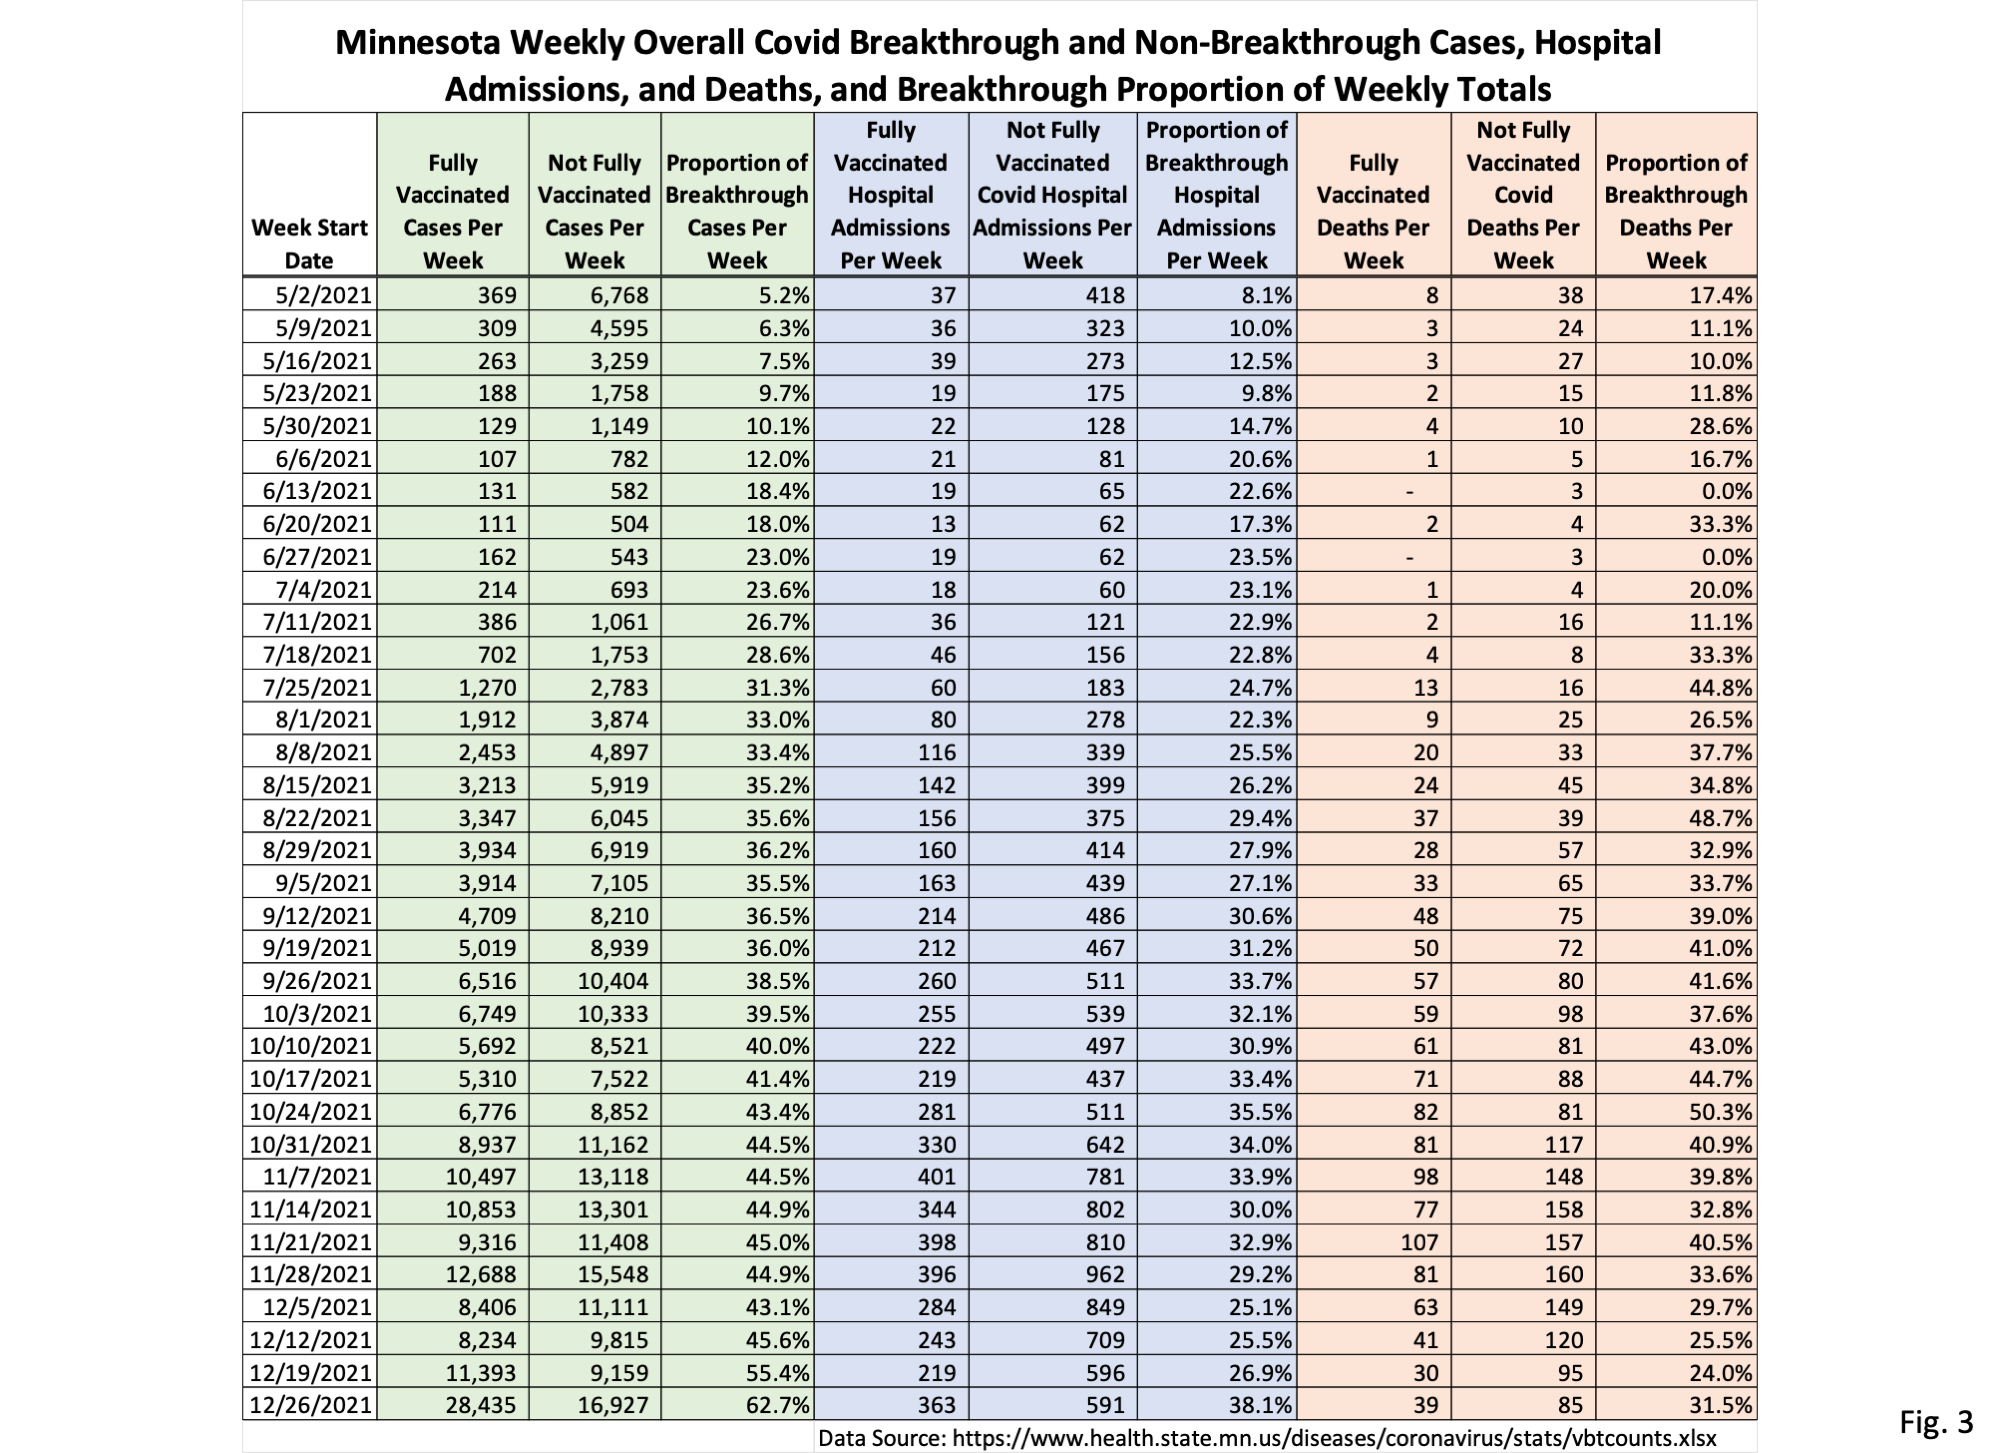
- The data source for Fig. 2 and Fig. 3 is the data file https://www.health.state.mn.us/diseases/coronavirus/stats/vbtcounts.xlsx found on MDH web page https://www.health.state.mn.us/diseases/coronavirus/stats/vbt.html. The data provided in the data file vbtcounts.xlsx is used without modification, other than to sum the weekly events and compute the breakthrough proportion. Vbtcounts.xlsx provides breakthrough and non-breakthrough cases, hospital admissions, and deaths for each week listed.
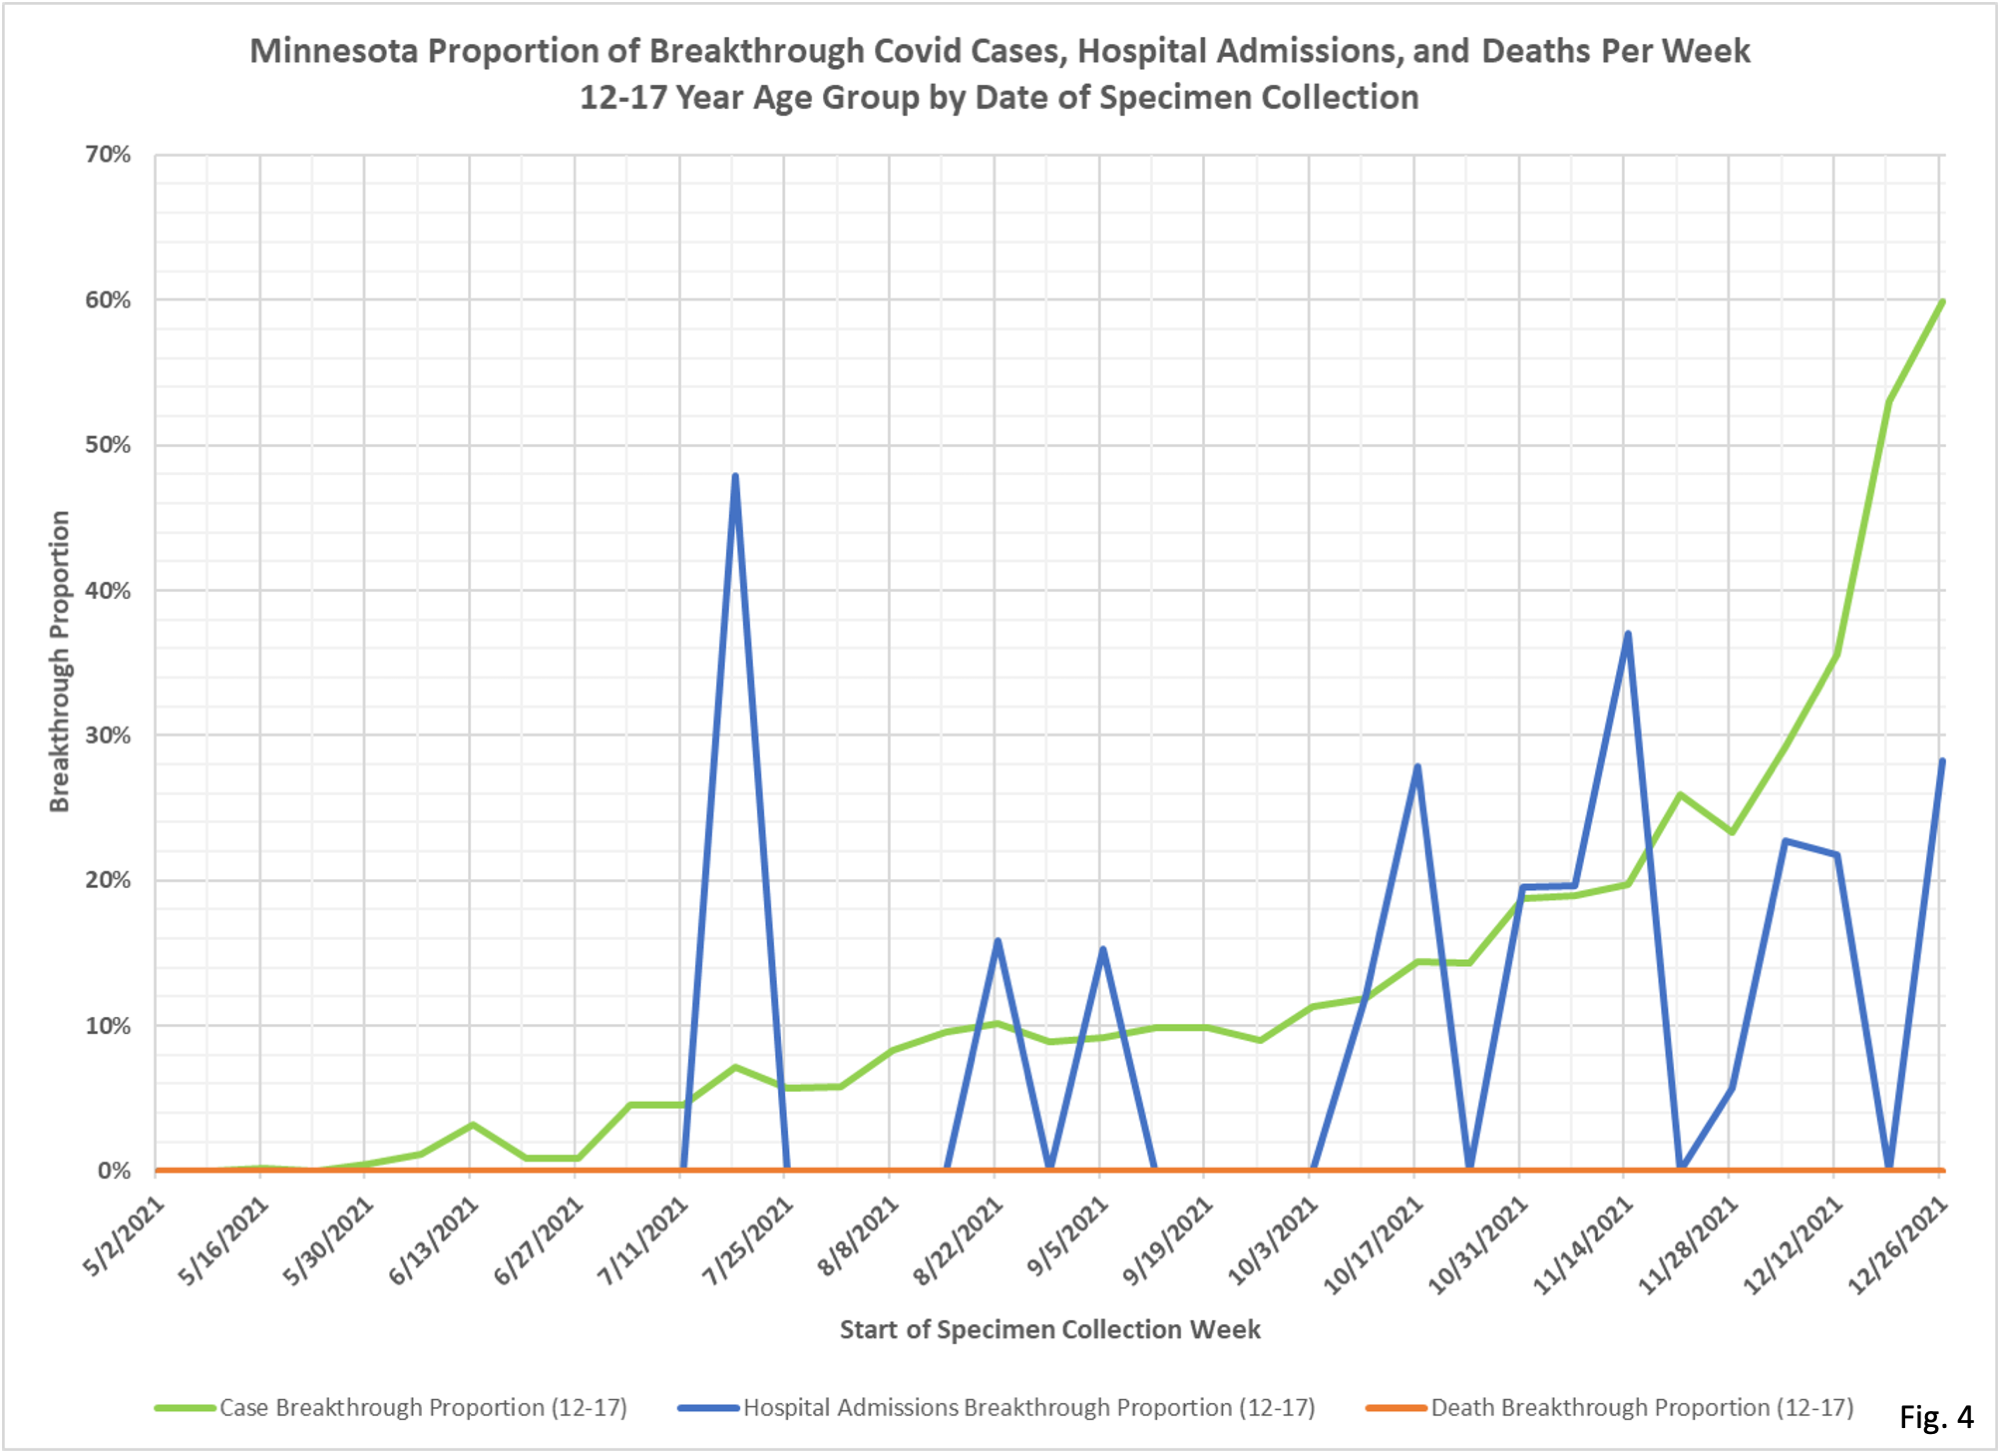
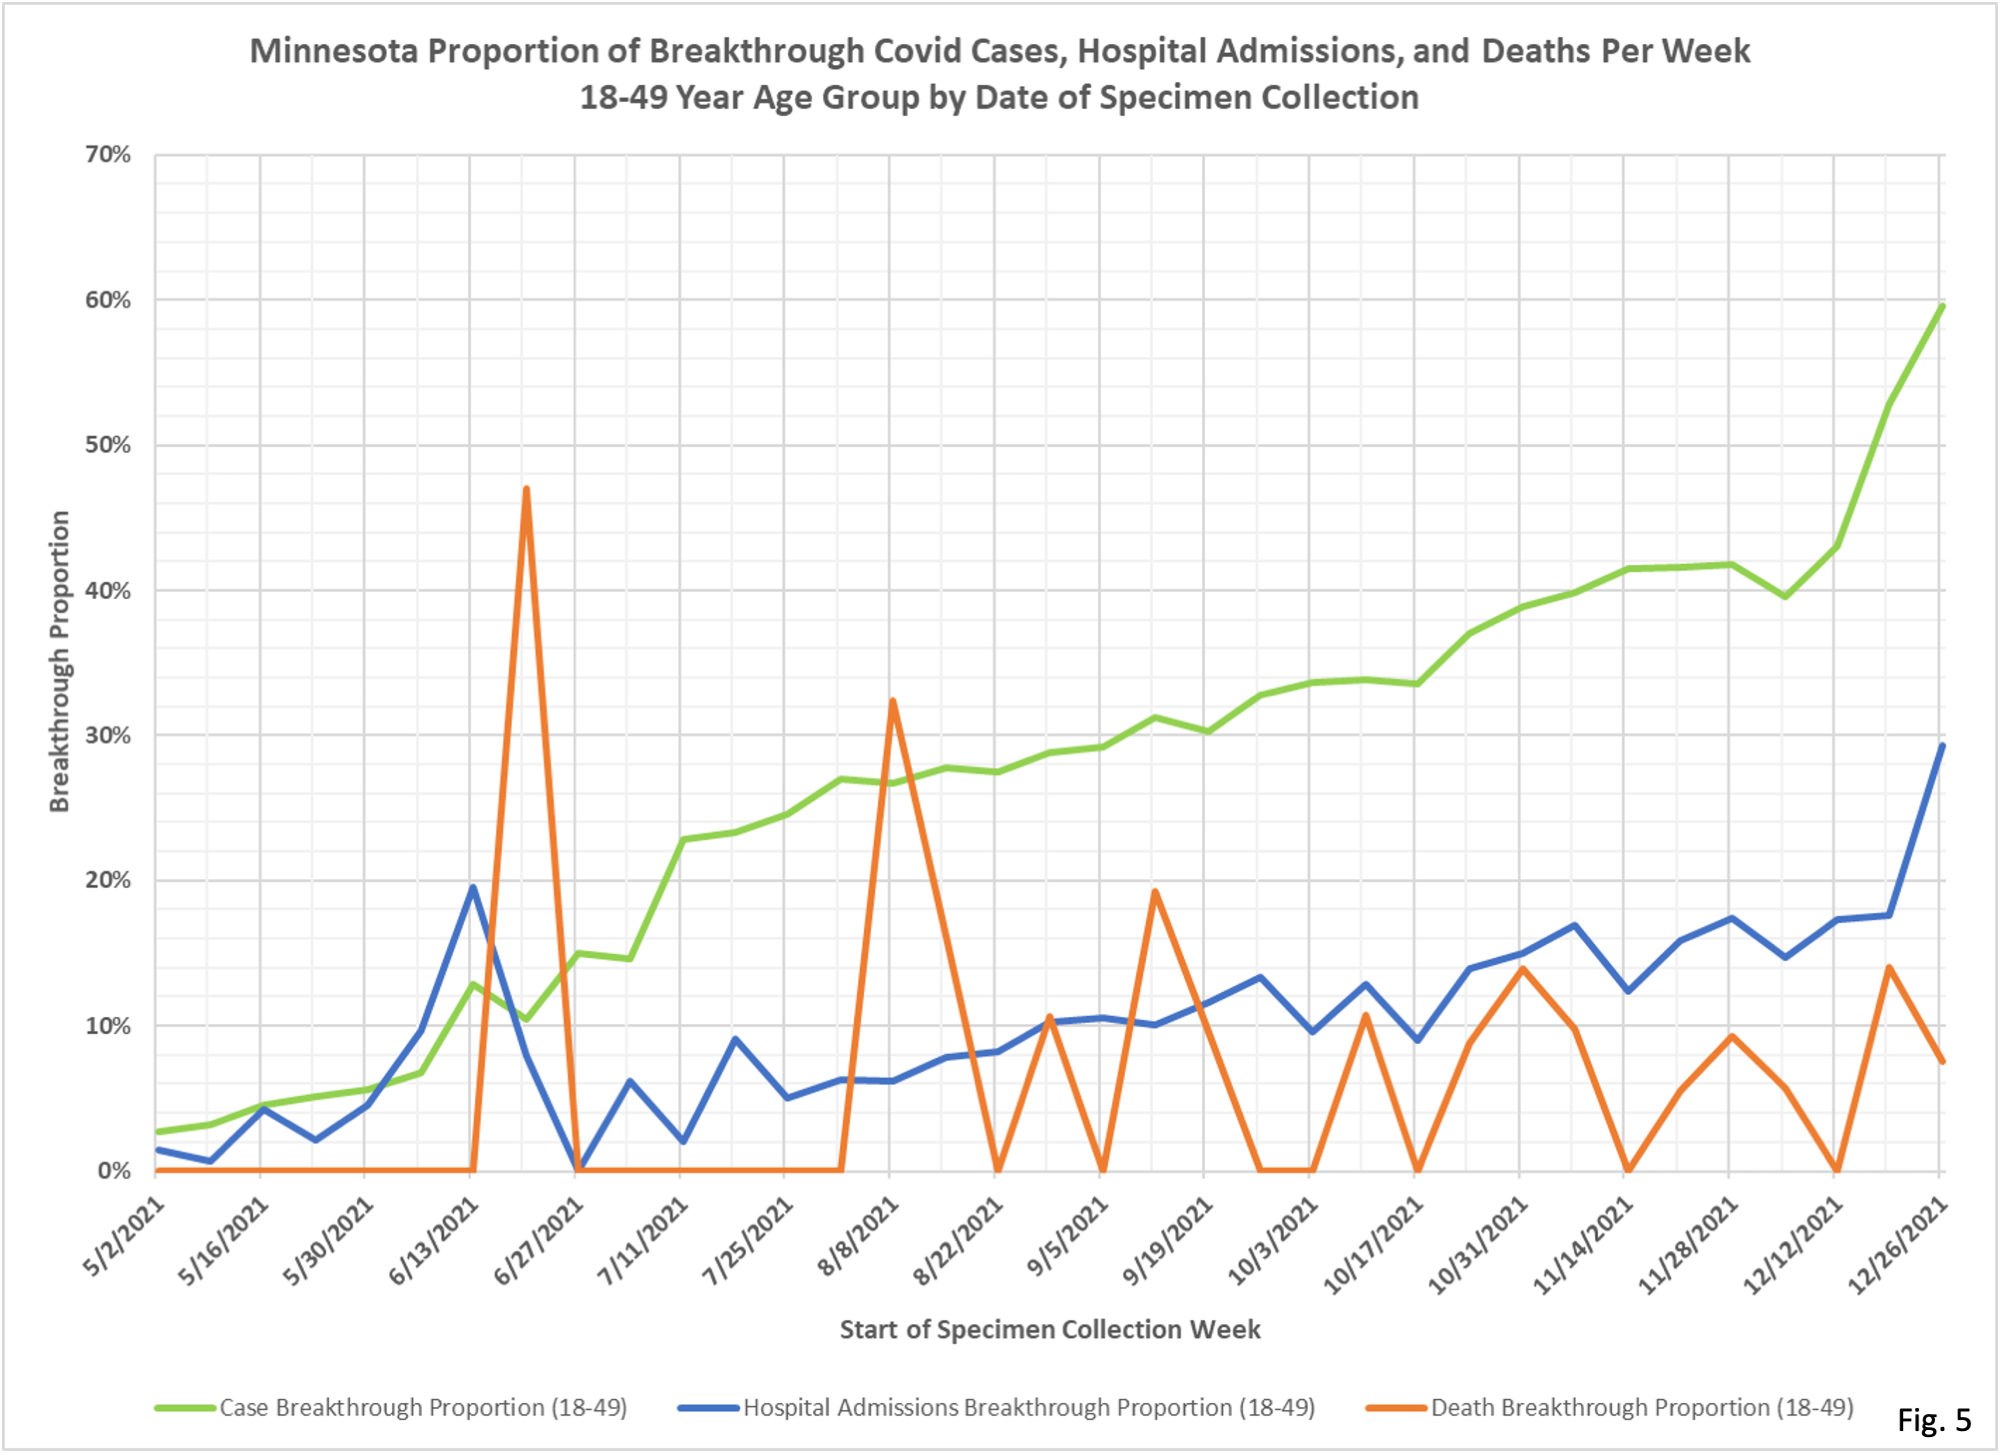
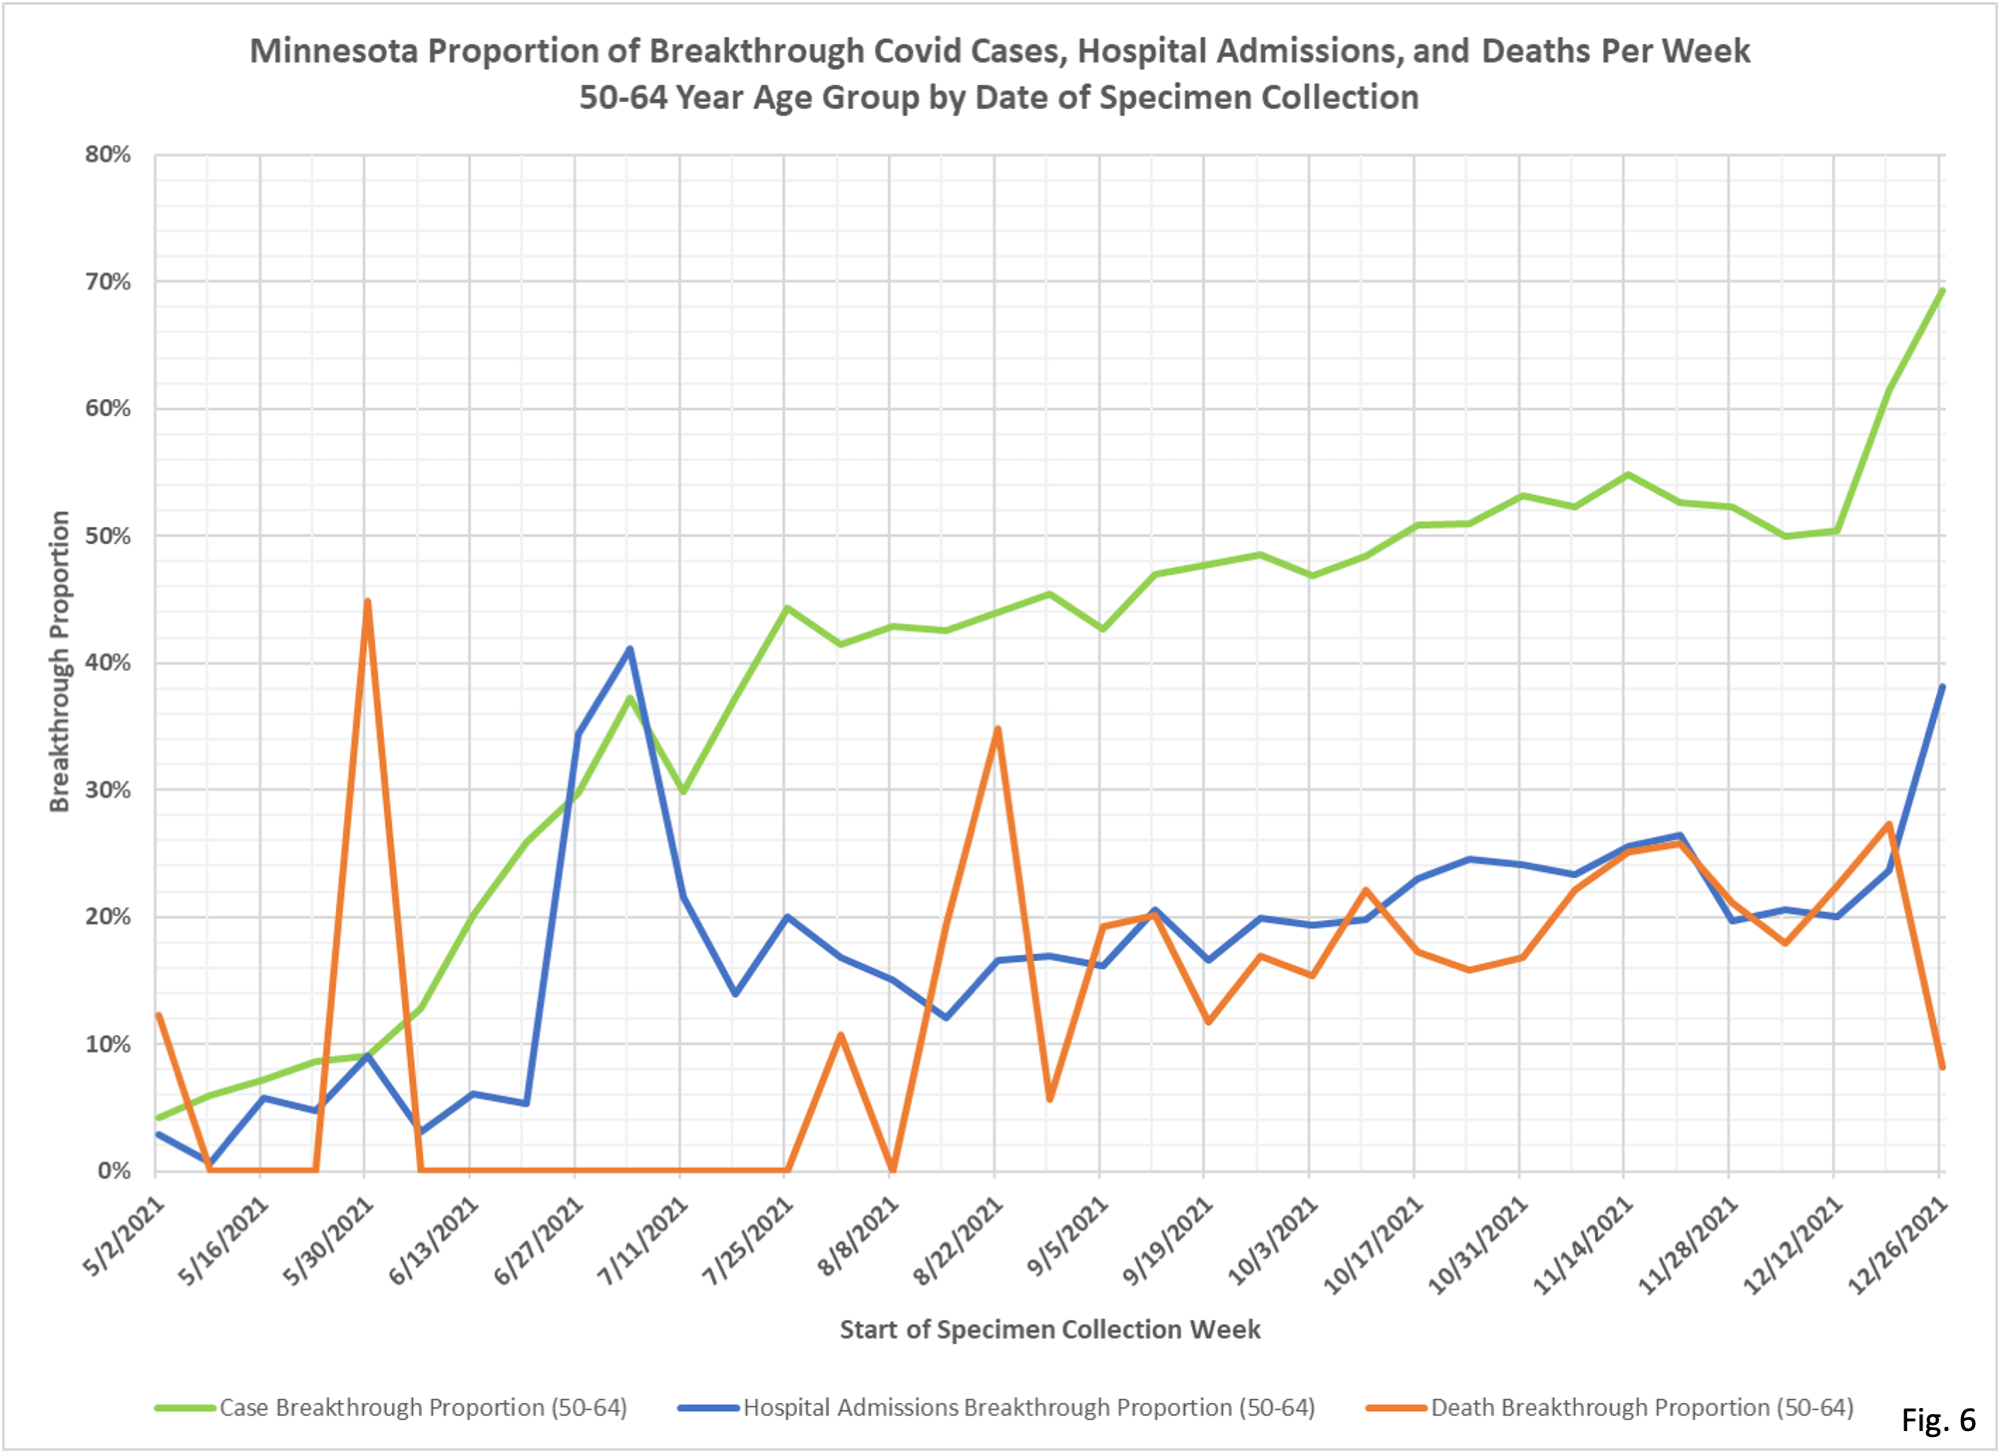
- The data source for the breakthrough proportions by age group (Fig. 4 through Fig. 7) is the data file vbtcirates.xlsx, found on the Minnesota Department of Health (MDH) web page: https://www.health.state.mn.us/diseases/coronavirus/stats/vbtcirates.xlsx . This data file gives the rates per 100k of cases, hospitalizations, and deaths in full vaccinated and not fully vaccinated people, broken out by age group.
- The rates per 100k in vbtcirates.xlsx are converted into cases, hospitalizations, and deaths by multiplying by the appropriate population. The number of vaccinated people by age group can found on the Vaccine Data page, https://mn.gov/covid19/vaccine/data/index.jsp , in the data file People Vaccinated by Age. The unvaccinated population is found by taking the US Census American Community Survey 5-Year Estimate (Data Table S0101, https://data.census.gov/cedsci/table) and subtracting the vaccinated population. The breakthrough proportion is then found by dividing the breakthrough events by the total of the breakthrough and non-breakthrough weekly events.
- MDH defines a breakthrough event as a Covid case, hospital admission, or death that occurs 14 or more days after completing the vaccination series (but not including having a boosters).
- Fig 1: New breakthrough cases announced on 1/31/2022 total 50,416, a new record by far for breakthrough cases in a week. The newly reported breakthrough hospitalizations of 671 were slightly lower than last week’s reported breakthrough hospitalizations of 681 for the week starting 12/19/2021.
- Fig. 2 and Fig. 3, Overall Breakthrough Proportions: Breakthrough cases surged to the highest level seen, at 62.7% of total cases for the week starting 12/26/2021. This would have been the period of time where the Omicron variant was becoming prevalent in Minnesota. The proportion of breakthrough hospitalizations rose as well to 38.1% of all hospitalizations, while breakthrough deaths increased to 31.5% of the total weekly deaths.
- Fig. 4 through Fig. 7: Breakthrough Proportions by Age Group: The breakthrough proportion of cases in each age group continues to surge higher, with the 12-17 and 18-49 age groups just below 60% breakthrough cases for the week of 12/26/2021, and the 50-64 and 65+ age groups around 70% breakthrough cases for the week. The breakthrough proportion of hospitalizations for the week of 12/26/2021 was also higher for each age group the week of 12/26/2021.

well thats because its was never a sterilizing vaccine (like ALL other “vaccines”) … its a treatment … that does little to prevent infection or transmission …
it is not a treatment, it is a vaccine, by any definition of the word. A vaccine is a biologic that prompts the human immune system to develop a response to certain antigens, that is exactly what the CV-19 vaccines do.
Are the rates for 65+ “fully vaccinated” so much lower than any other age group because they are much more likely to be boostered (as well as more likely to be vaccinated in the first place)?
Does MDH have any data on who has received boosters?
yes I think it is boosters and yes DOH has data, but doesn’t release it
If you covered this already, apologies, I missed it. Does “vaxxed” mean “received all the shots plus boosters and waited 14 days before getting Covid”? I ask because I’m hearing anecdotal stories of breakthrough infections occurring much sooner after the booster and I’m wondering if those are counted as “unvaxxed” to skew the count to make vaccines look good? Also, there was talk last June of CDC counting breakthrough infections only if they resulted in hospitalization or death. People with breakthrough infections who were not admitted counted as “unvaxxed” which would skew the count to make vaccines look good. Any data on whether results are skewed by definitions?