One thing Dave Dixon and I pride ourselves on is trying to think of innovative ways to show you data that helps you better understand the epidemic trends. This table and chart shows you, on an attempted date of event basis, the relative trends in unvaxed cases, vaxed cases and reinfection cases. As usual, we have to explain where DOH data is screwed up, because it always is. First note the long lag, about a month. This is because DOH refuses to prioritize getting cases in the right bucket when they come in. So you see the totals and I think most people are unaware that there is bucket shifting going on constantly as cases are identified as breakthrus or reinfections. It literally takes a month to get to the point where you have some confidence in the data and meanwhile the epidemic moves on. And a big issue is that an unknown quantity of cases get lumped in the unvaxed because the vax status is unknown, or they are partly vaxed or were vaxed at a place DOH doesn’t track. And a blindingly stupid omission is DOH not identifying the overlap in vaxed and reinfected, because there is overlap. But as usual we do the best we can.
Dave’s notes:
- Given the rapid rise in Covid cases in Minnesota since the December 2021 low, we thought it would be a good idea to take a detailed look at the data we have available from the Minnesota Department of Health (MDH).
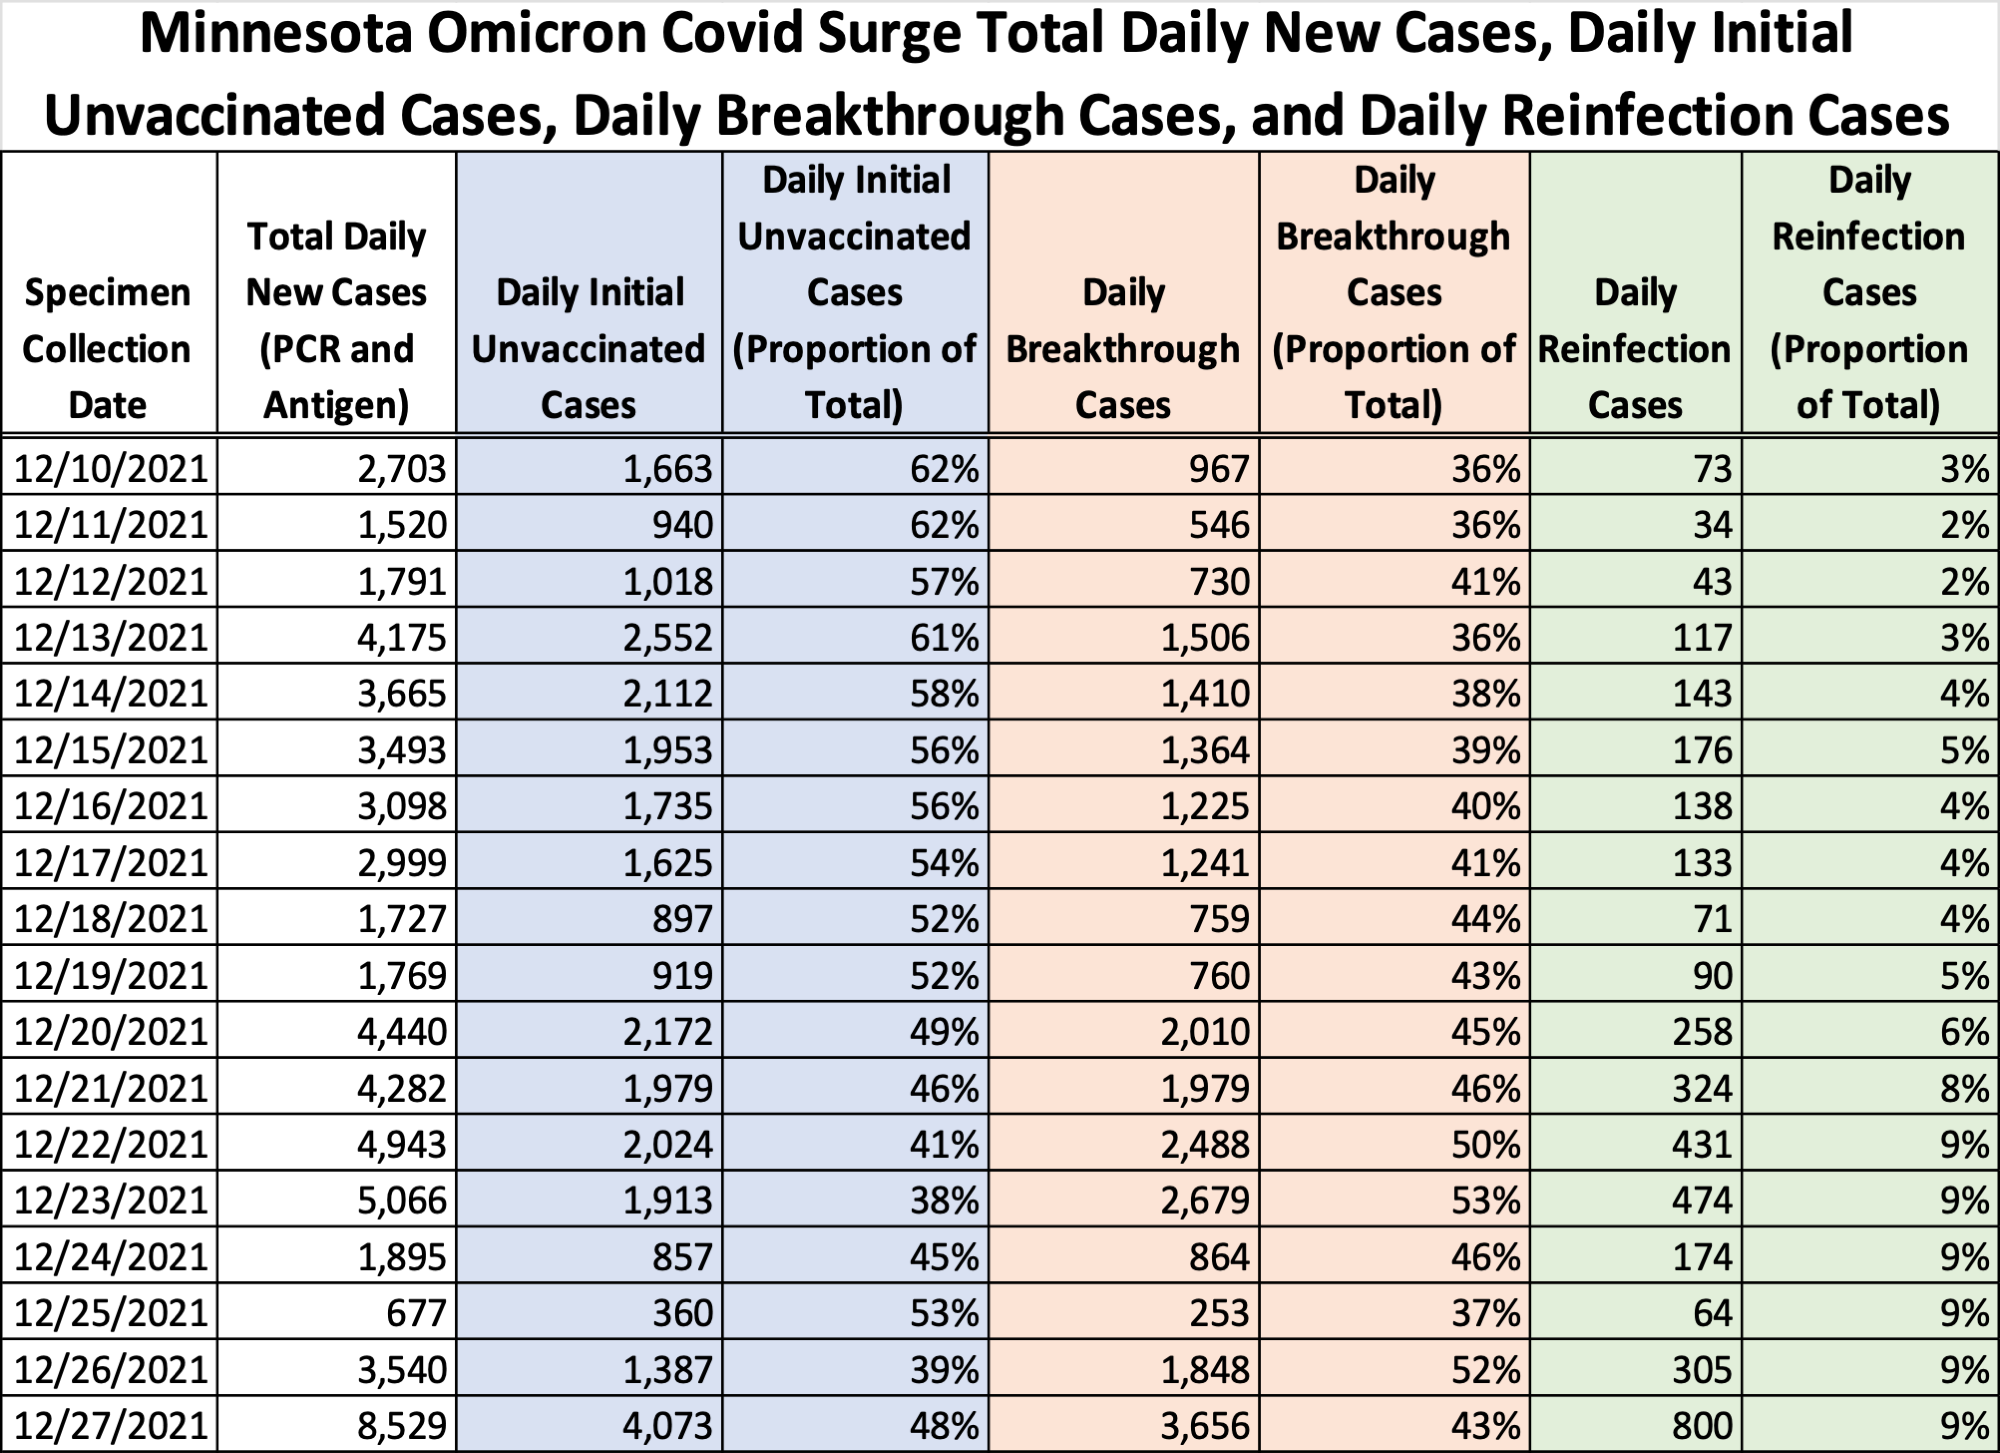
- In December 2021, Covid cases in Minnesota declined as the Delta variant wave waned, reaching a low point on 12/11/2021 of 1520 total PCR and antigen cases. On a 7 day running average basis the December low occurred on 12/16/21, at 2921 average daily cases. This 7 day average on 12/16/21 is the average of cases occurring from 12/10/21 to 12/16/21. For the purposes of this post we chose to define the start of the Omicron Surge as 12/10/21, the start of the 7 day period that was the low average daily cases in December 2021.
- MDH publishes daily cases and daily reinfection cases, both by specimen collection date, on the Situation Update for COVID-19 web page, https://www.health.state.mn.us/diseases/coronavirus/situation.html. We have taken the total of the PCR and antigen daily cases, and the total of the PCR and antigen reinfection cases, and display them in the white and green columns of the data table below. Reinfection cases are defined as a positive Covid test more than 90 days after a prior positive test. We presume that reinfections can occur in both vaccinated and unvaccinated people, since MDH does not comment on this issue.
- In response to our Data Practice Act Request No. 21-211 MDH has periodically provided a list of all breakthrough cases by specimen collection date, along with Yes/No flags for whether each case was admitted to a hospital or had died. Breakthrough cases are defined as a positive Covid test 14 days or more after vaccination. The most recent data file was received from MDH on 1/14/2022, with a file date of 1/10/2022, and the most recent breakthrough case dated 1/02/2022. It is clear in the data that breakthrough cases start to decrease rapidly in the end of December 2021 in the data file, very likely because of the lag in processing data. We have somewhat arbitrarily chosen 12/27/2021 as the cutoff date for what we hope is relatively complete breakthrough data. The breakthrough cases were sorted and counted by specimen collection date, and are displayed in the orange column of the data table below. Unfortunately our 12/27/21 cutoff date is several weeks before the peak in Omicron cases in Minnesota. We expect that the next breakthrough data file will be sent to us in the middle of February, based on MDH communications regarding this data practice act request.
- Now that we have total daily cases, daily breakthrough cases, and daily reinfection cases, all by specimen collection date, we are able to calculate the daily initial unvaccinated cases. Daily initial unvaccinated cases are the first infection an unvaccinated person gets, and is equal to total daily cases minus daily breakthrough cases and minus daily reinfections. These cases are displayed in blue in the data table below.
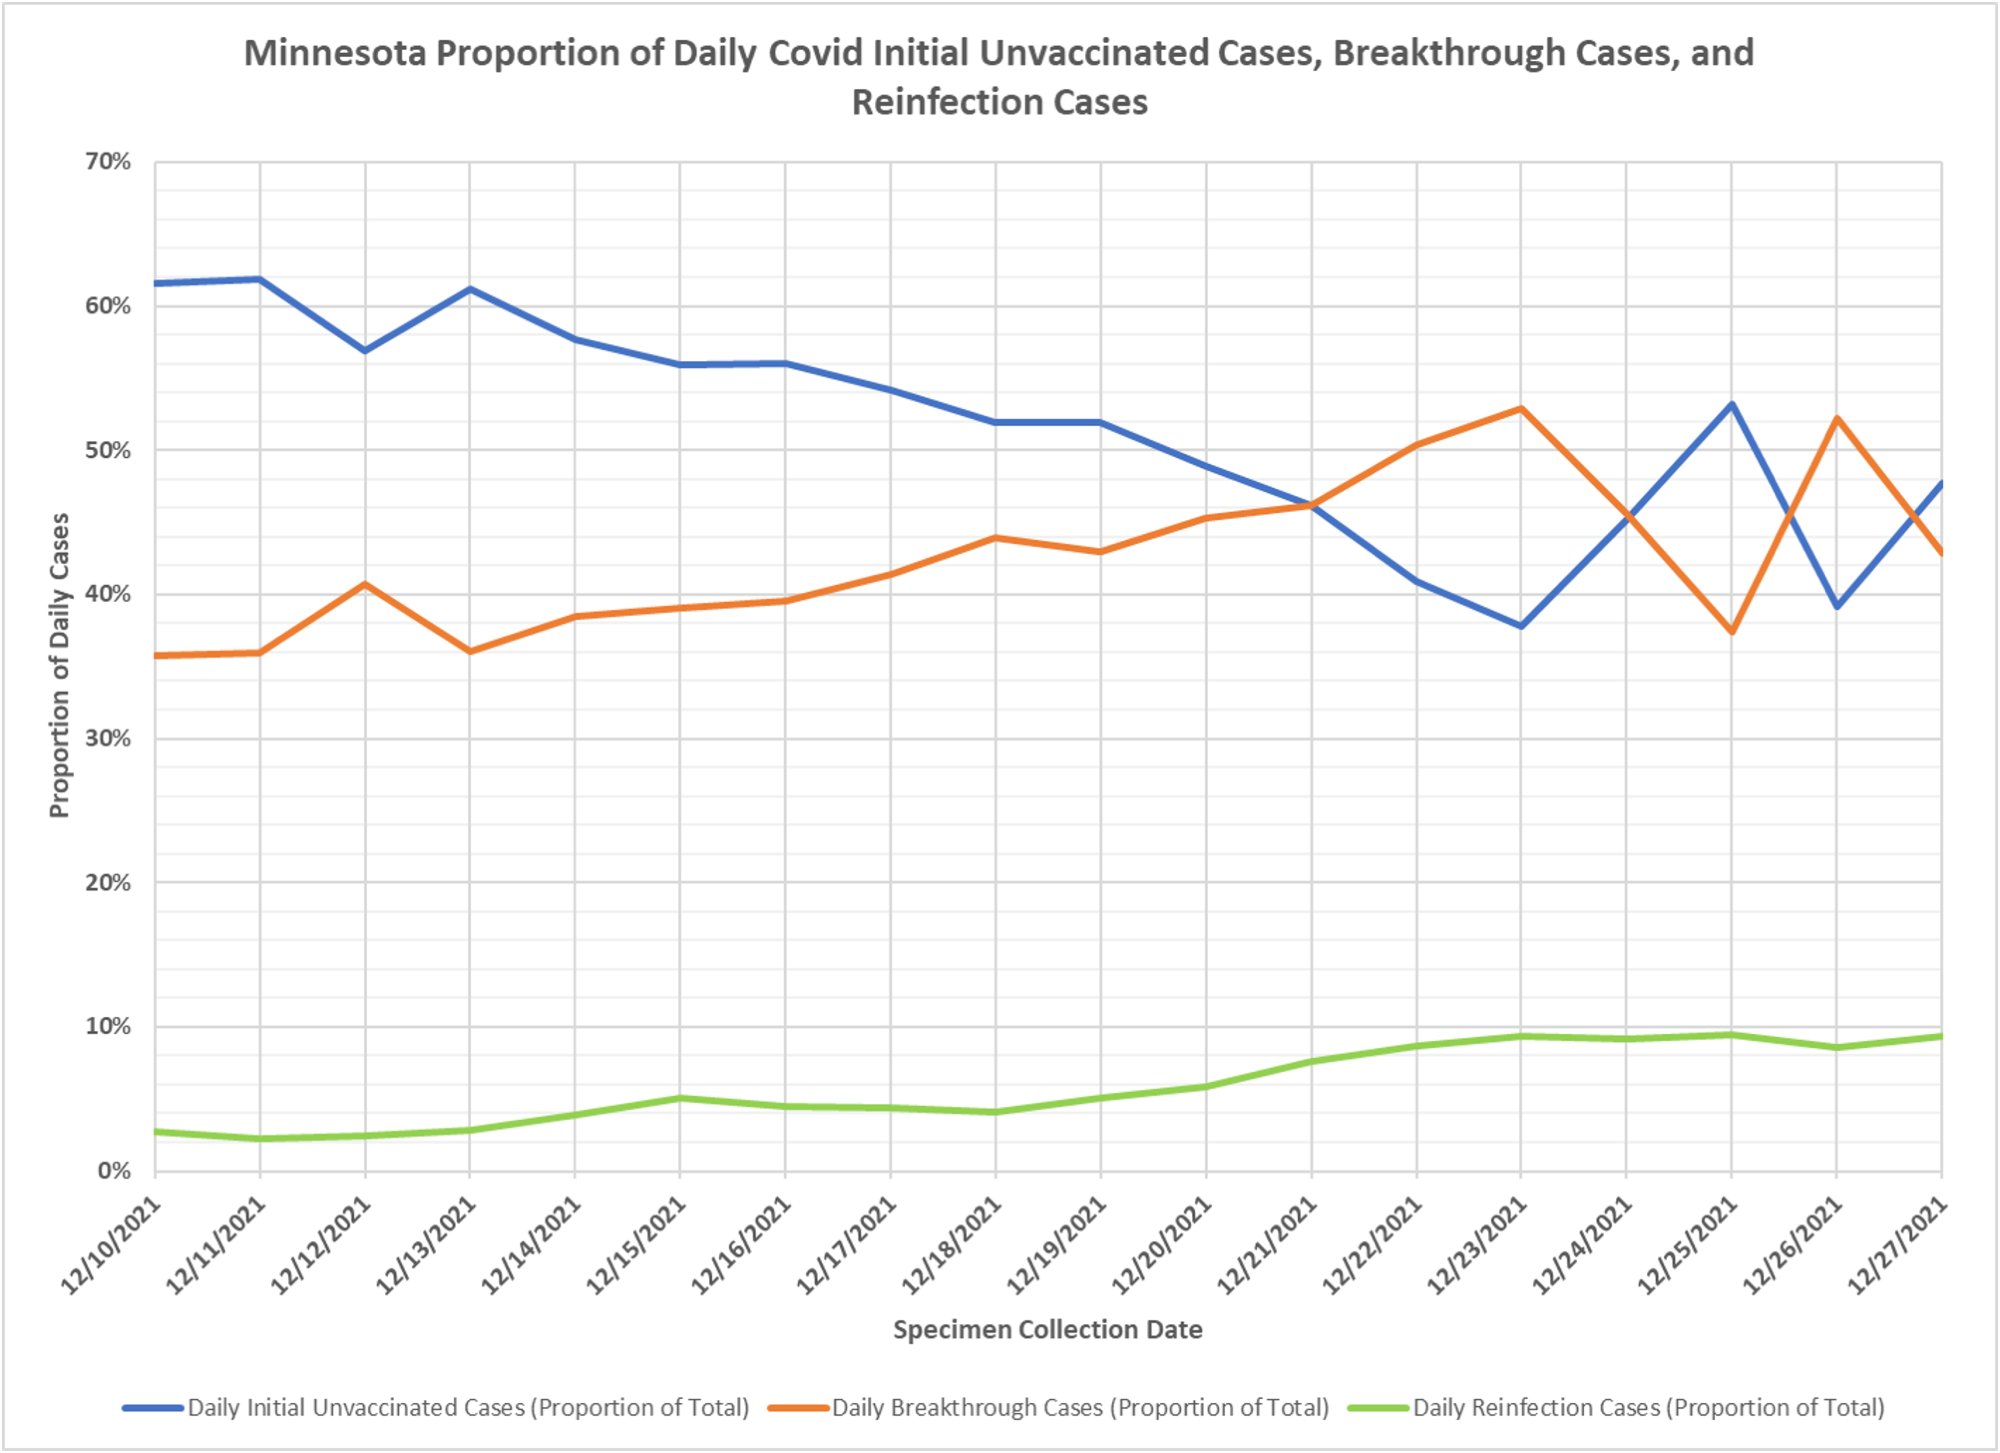
- The proportions of initial unvaccinated cases, breakthrough cases, and reinfection cases were then computed for each day, and are displayed in the data table and plotted in the chart below.
- We can see that breakthrough cases increased as a proportion gradually throughout this time period. Because of the lag in reporting breakthrough cases, it is likely that the breakthrough proportions will increase in this time period when we get the next data file from MDH.
- Reinfections as a proportion of daily cases increased steadily during this Omicron surge, from 3% on 12/10/21 to 9% on 12/27/21. This fits well with anecdotal reports that have been seen in the press about reinfections.

You state that reinfection cases are defined as a positive Covid test more than 90 days after a prior positive test and that reinfections can occur in both vaccinated and unvaccinated people. It would be interesting if these two categories were disambiguated to see how many unvaccinated, previously infected re-infection cases are occurring. I personally know of a single case of an individual who was not vaccinated, had been infected, and then tested positive a year later (asymptomatically). I am suspecting that those with naturally acquired immunity have almost zero reinfections. There are now over 1 million detected positive test cases and probably 2x that number in reality.
I completely agree and that is some of the data we are pushing the state for
Can a PCR and/or Antigen test distinguish between the type of variant? Or does a verified positive just mean the person has Covid and can be any one of the variants? For “reinfection” is it any of the variants or is it likely it’s a reinfection of a different variant than the person had prior?
if they are properly designed they can. I suspect most reinfections, partly because of the passage of time, are by a different strain.
Thank you for all your good work!!
To me the chart shows,
Omicron is replacing Delta;
Omicron is somewhat (?) resistant to injections and natural immunity;
Injection protection is in decline;
Natural immunity provides almost 50% immunity;
Being injected is about equal to not being injected; and
Lockups, masking, injections, restrictions do not prevent or protect against this virus. ANY virus.
Kevin, are you going to Kris Ehresmann’s retirement party or just send flowers?