Not sure what to highlight here, some increase in death proportions in the very old, sounds like Omicron got into the nursing homes. Generally things are turning down across all age groups.
Dave’s notes:
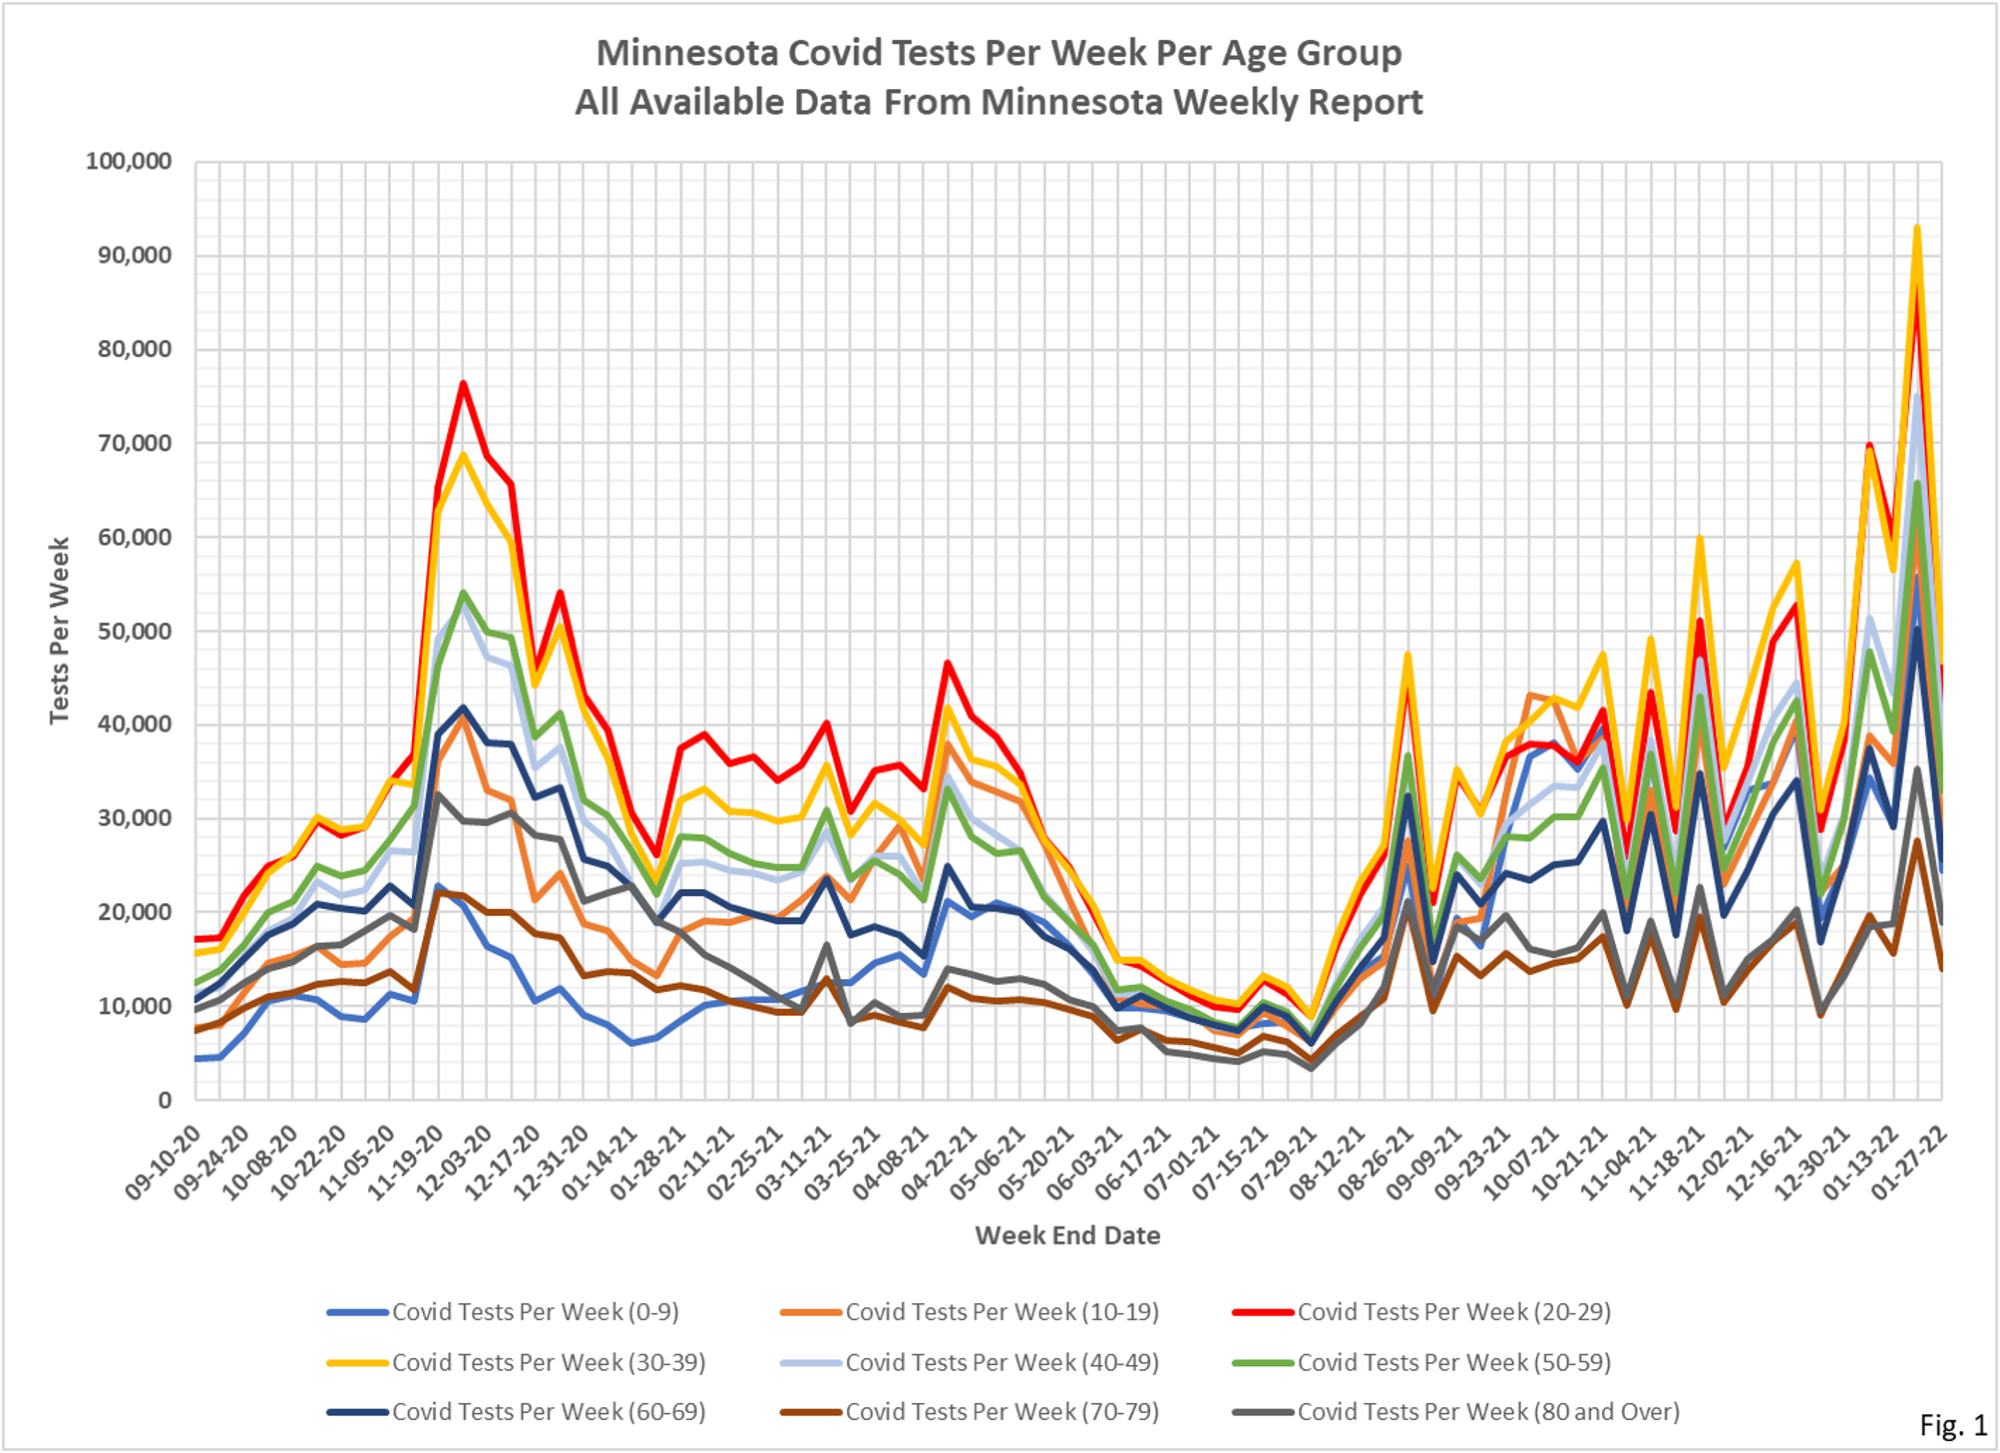
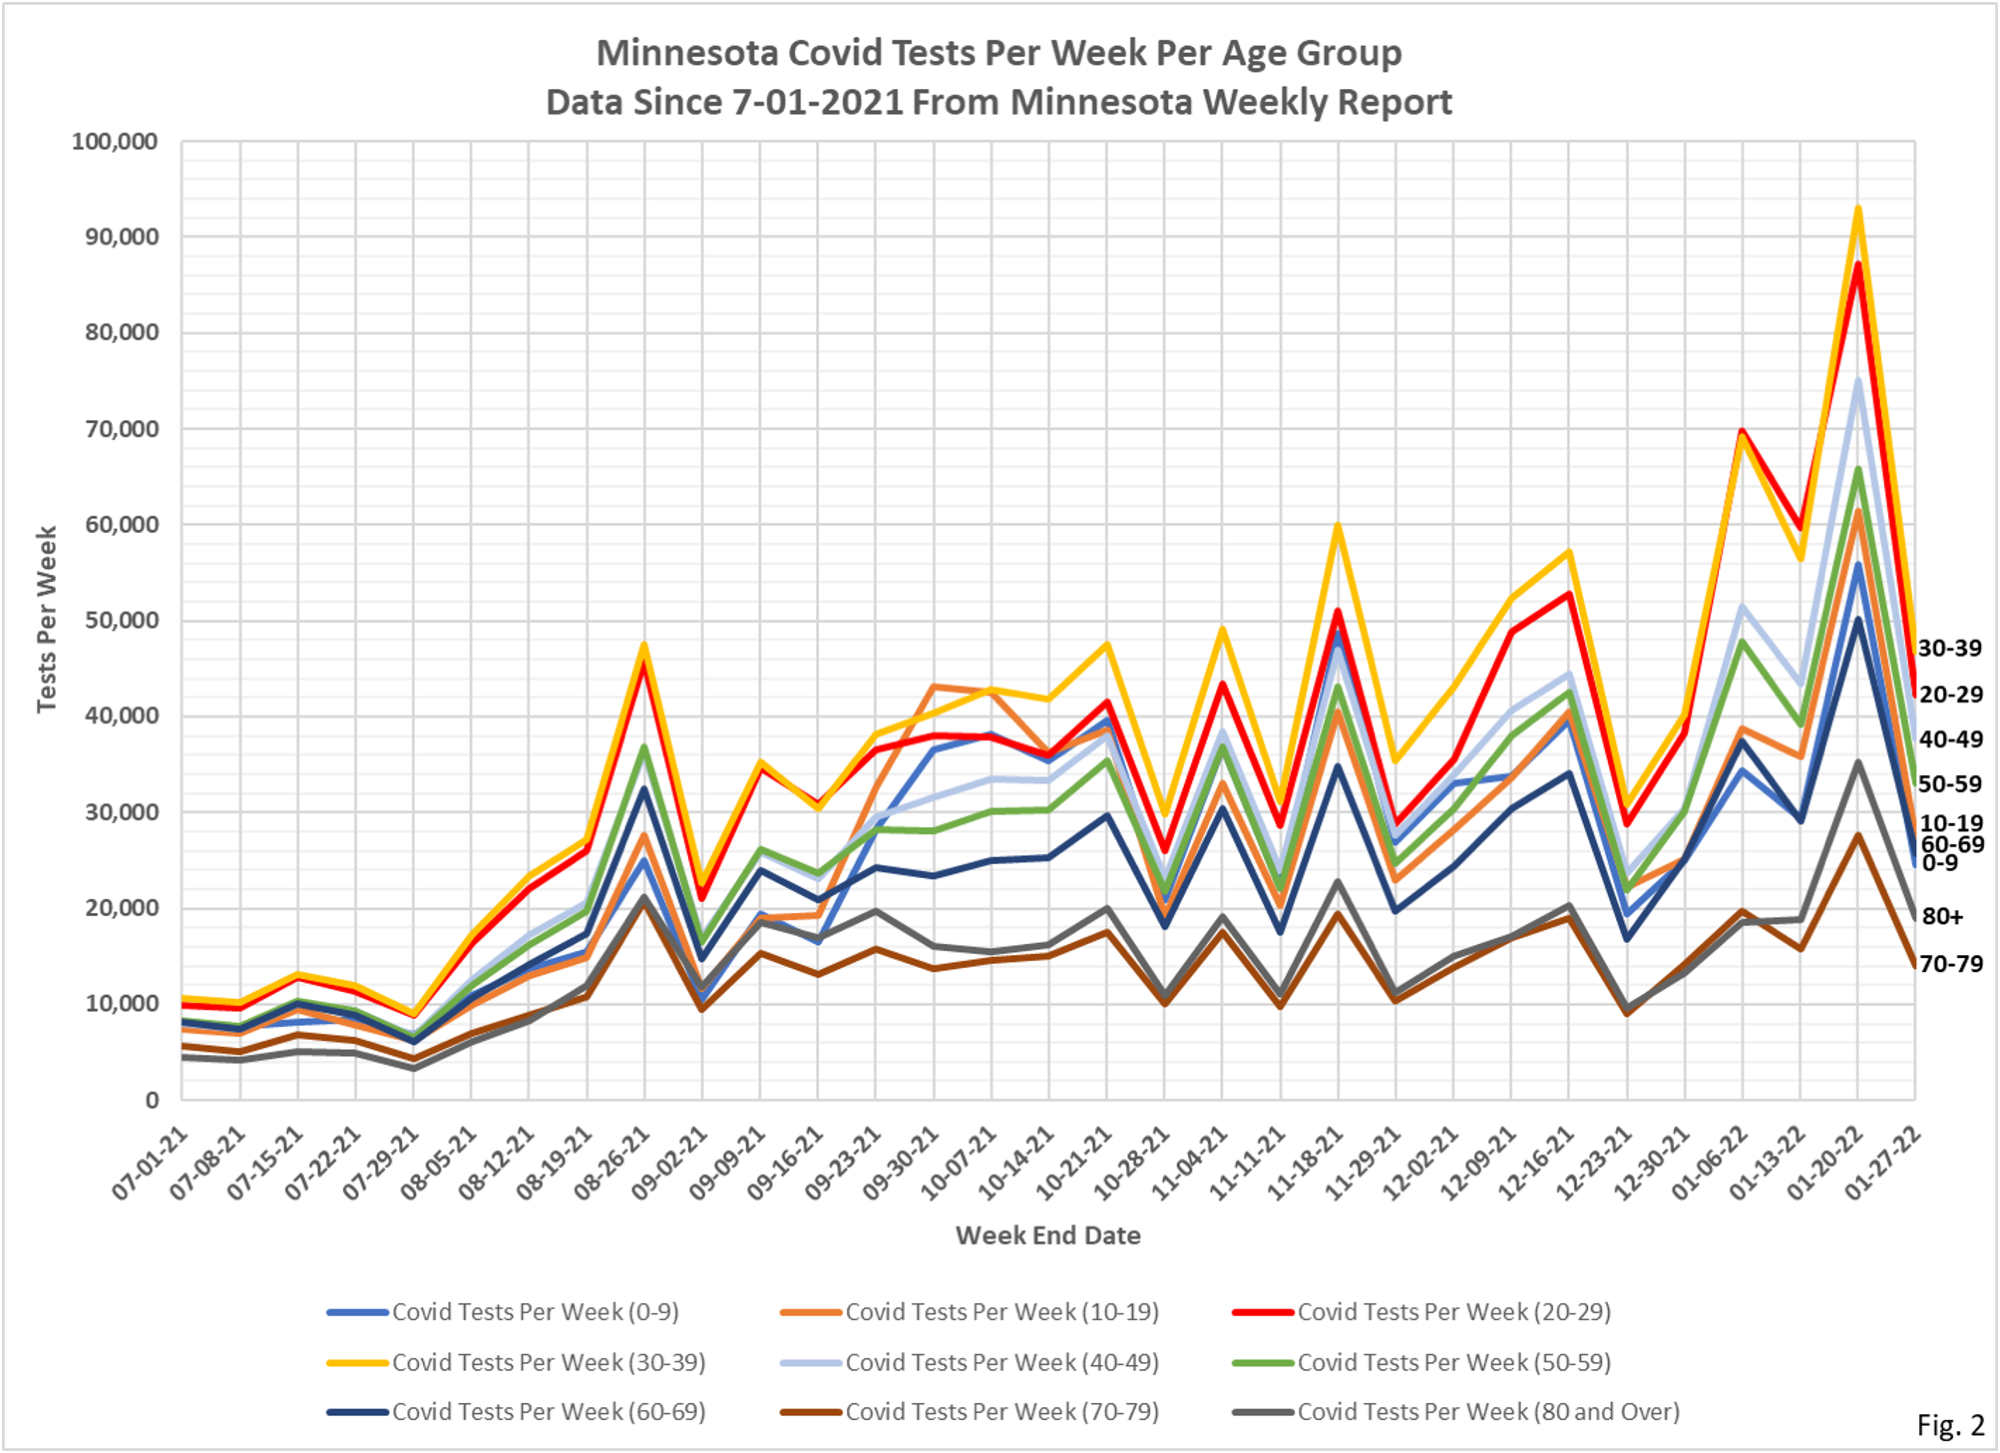
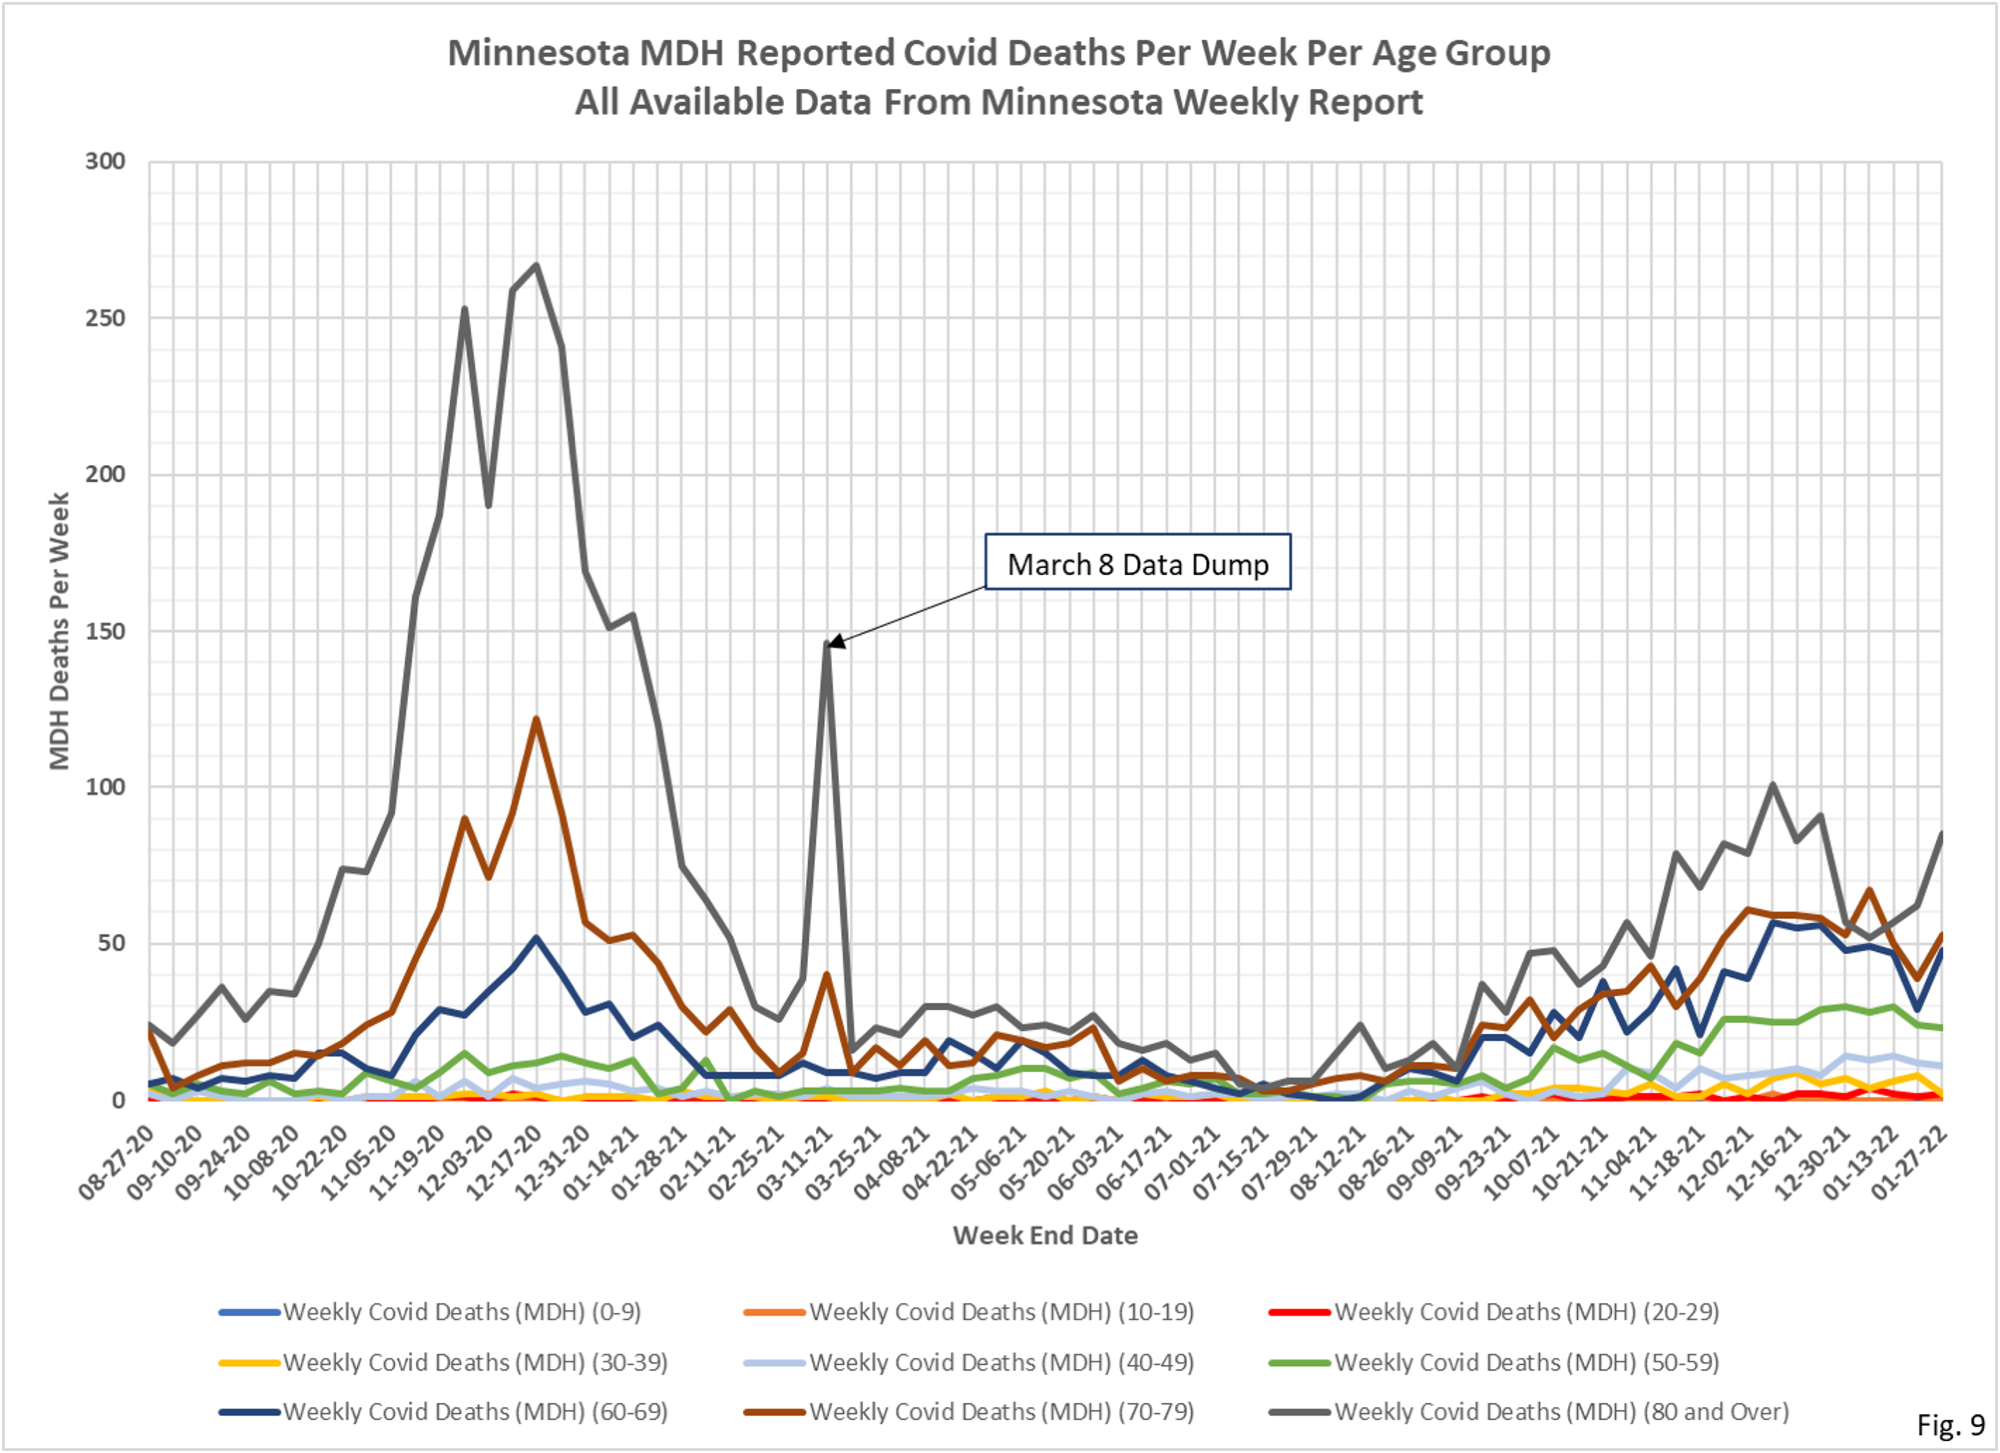
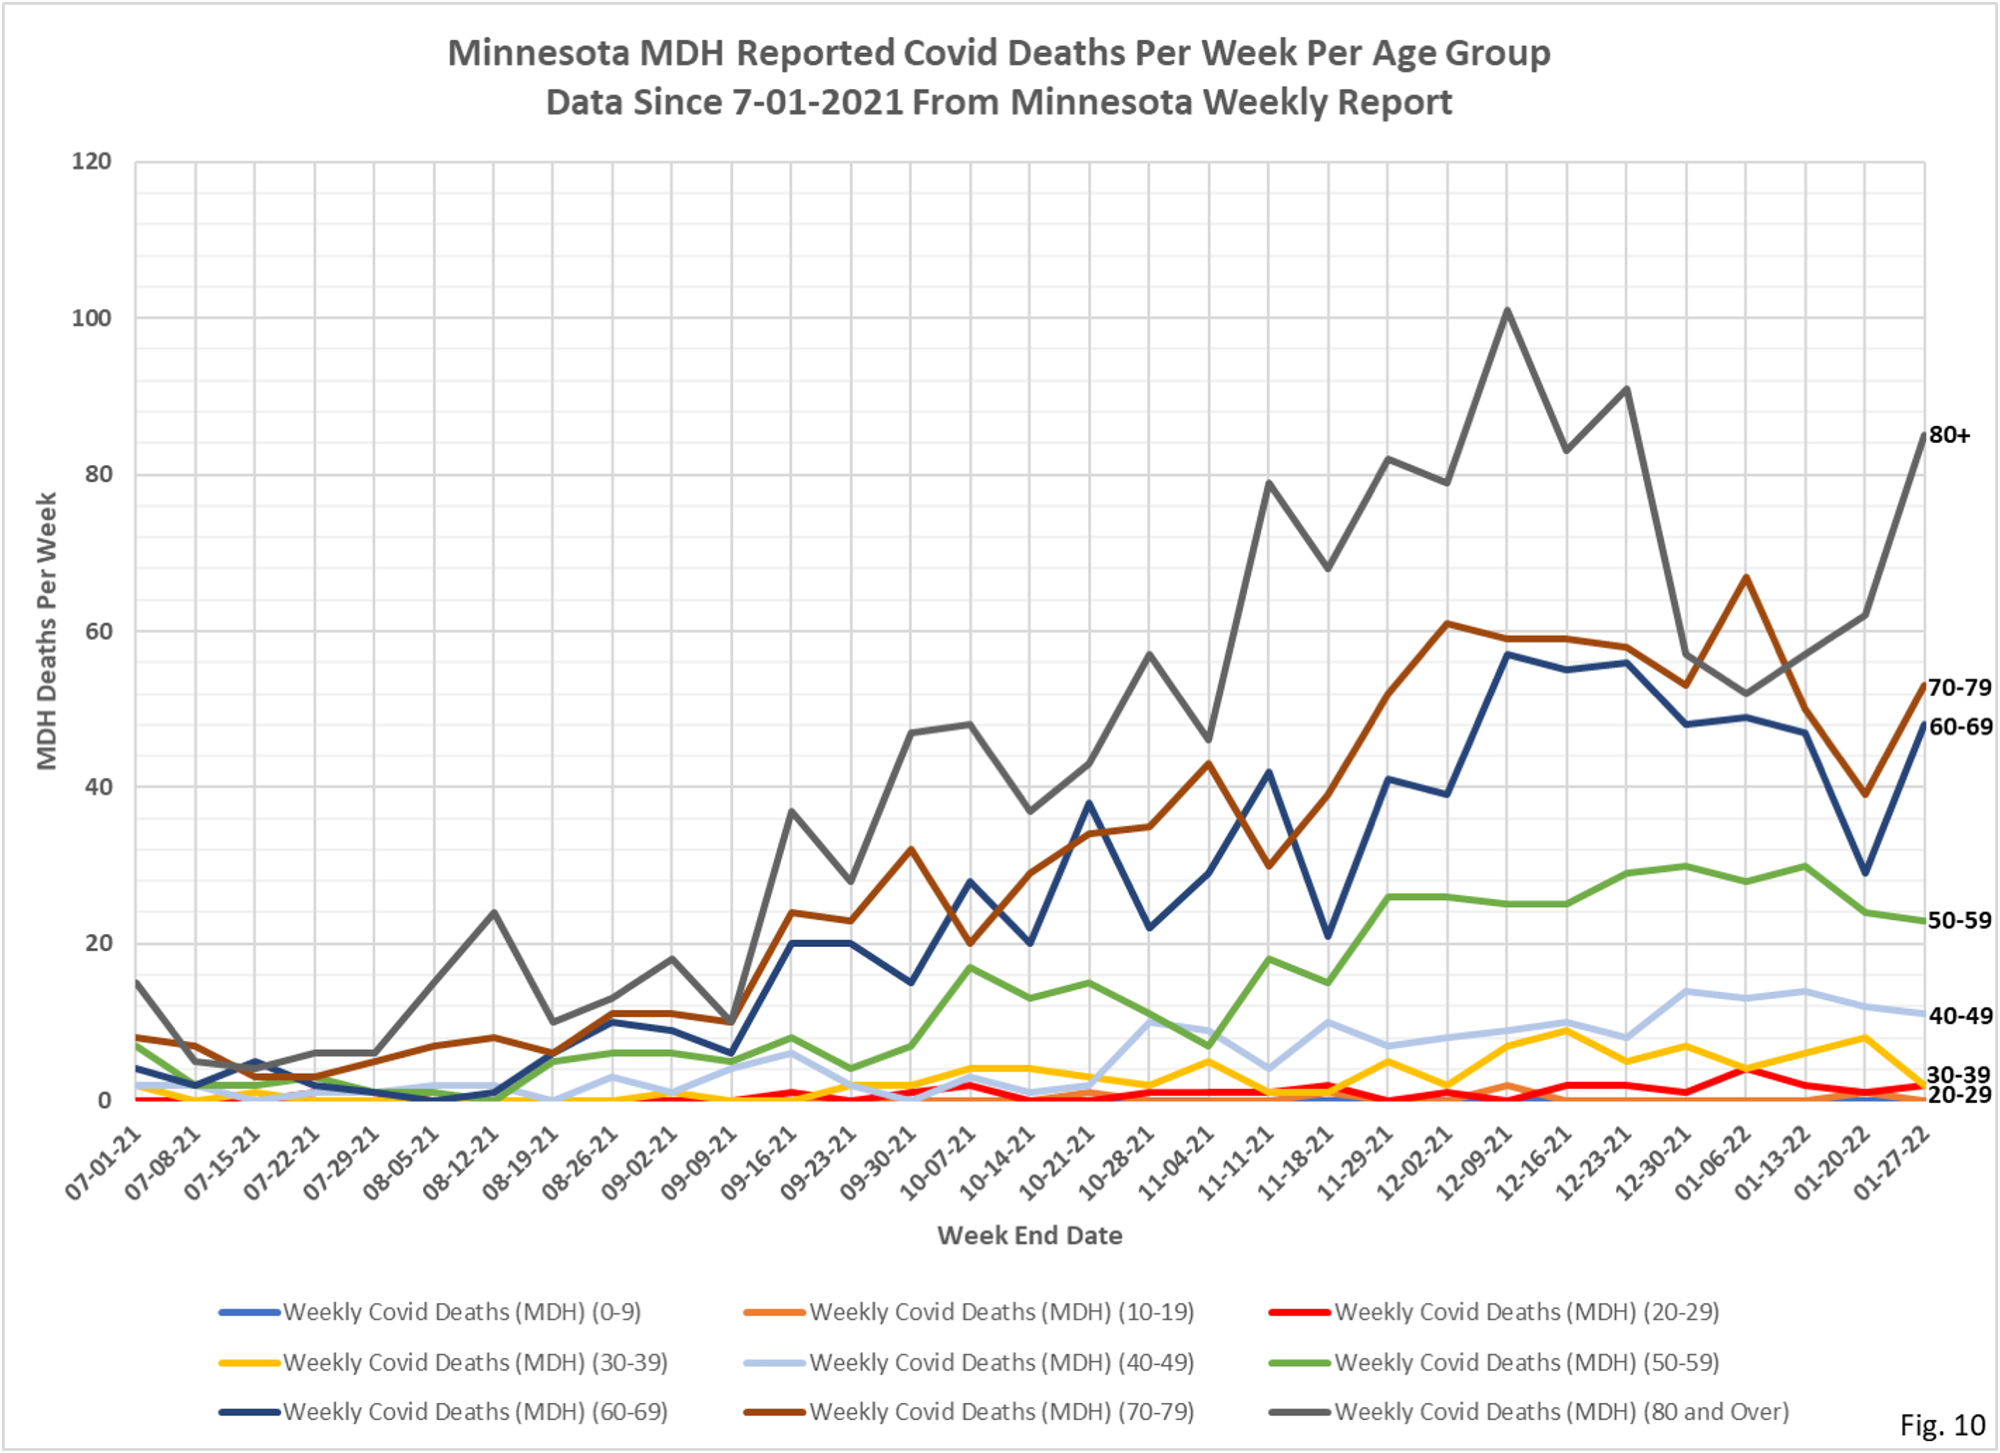
1. There are 2 slides for each set of data, one showing data for the whole pandemic and a second chart showing only data since early July 2021. Note that the full pandemic slides have different start dates, because Minnesota Department started publishing different data on different dates.
2. The data for the charts on testing, hospital admissions, and deaths comes from the Minnesota Weekly Report (available here: https://www.health.state.mn.us/diseases/coronavirus/stats/index.html). The data in the Weekly Report is presented as cumulative totals for each data type each week. I am taking weekly differences and assembling the data into charts. This data is by date of report, meaning the charts are documenting new events reported this week, even though the underlying event occurred sometime in the past. The data is provided for 5 year age groups, and I am assembling into 10 year age groups to make the charts more readable.
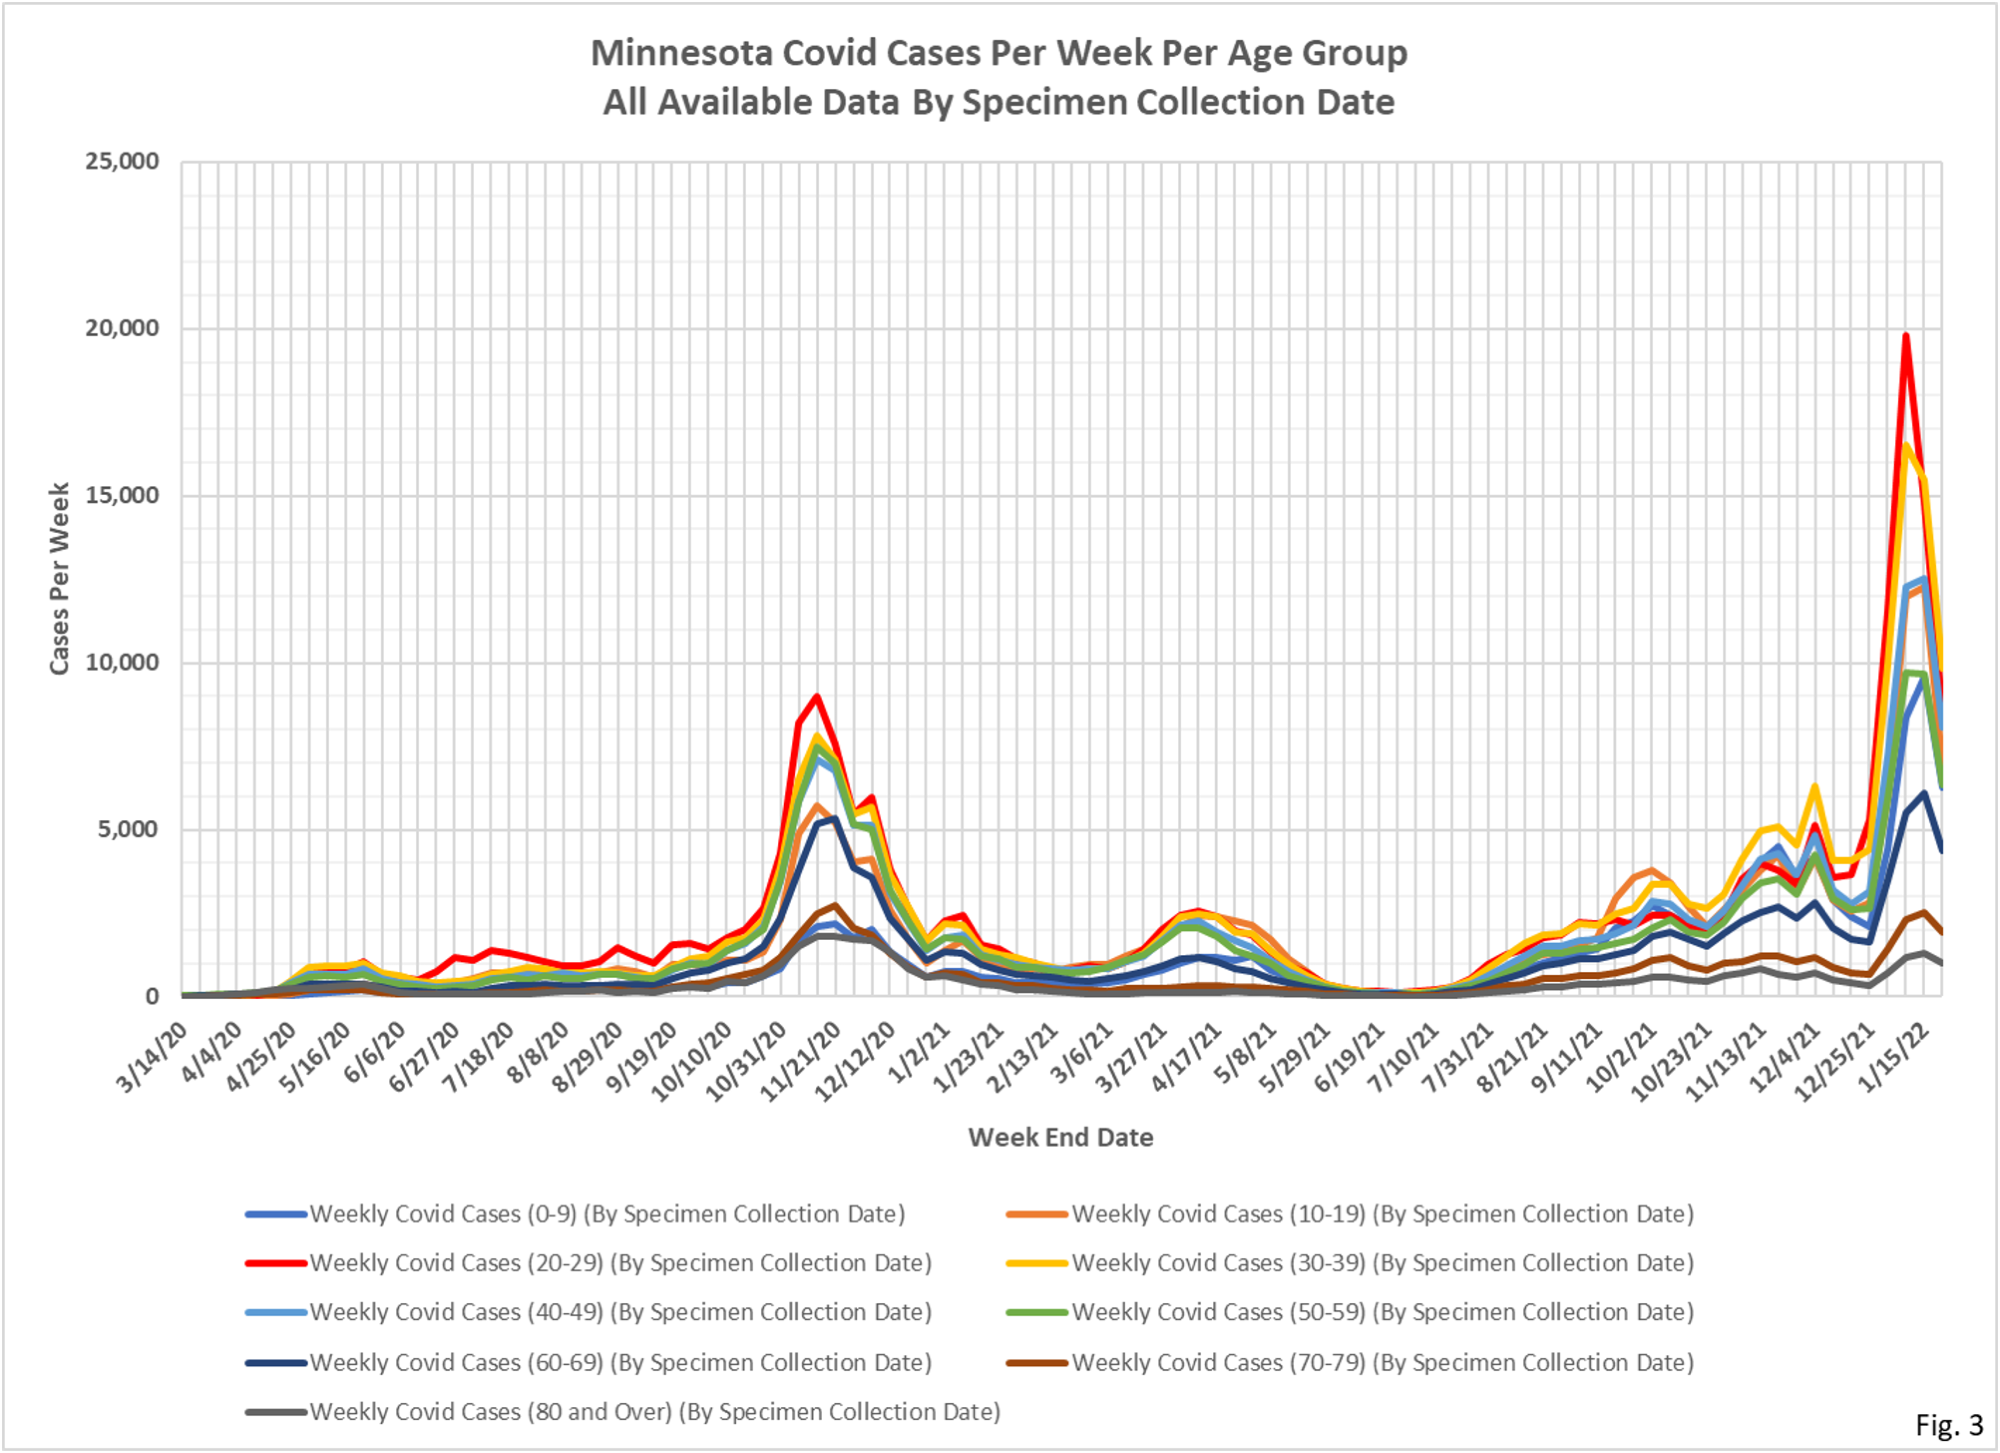
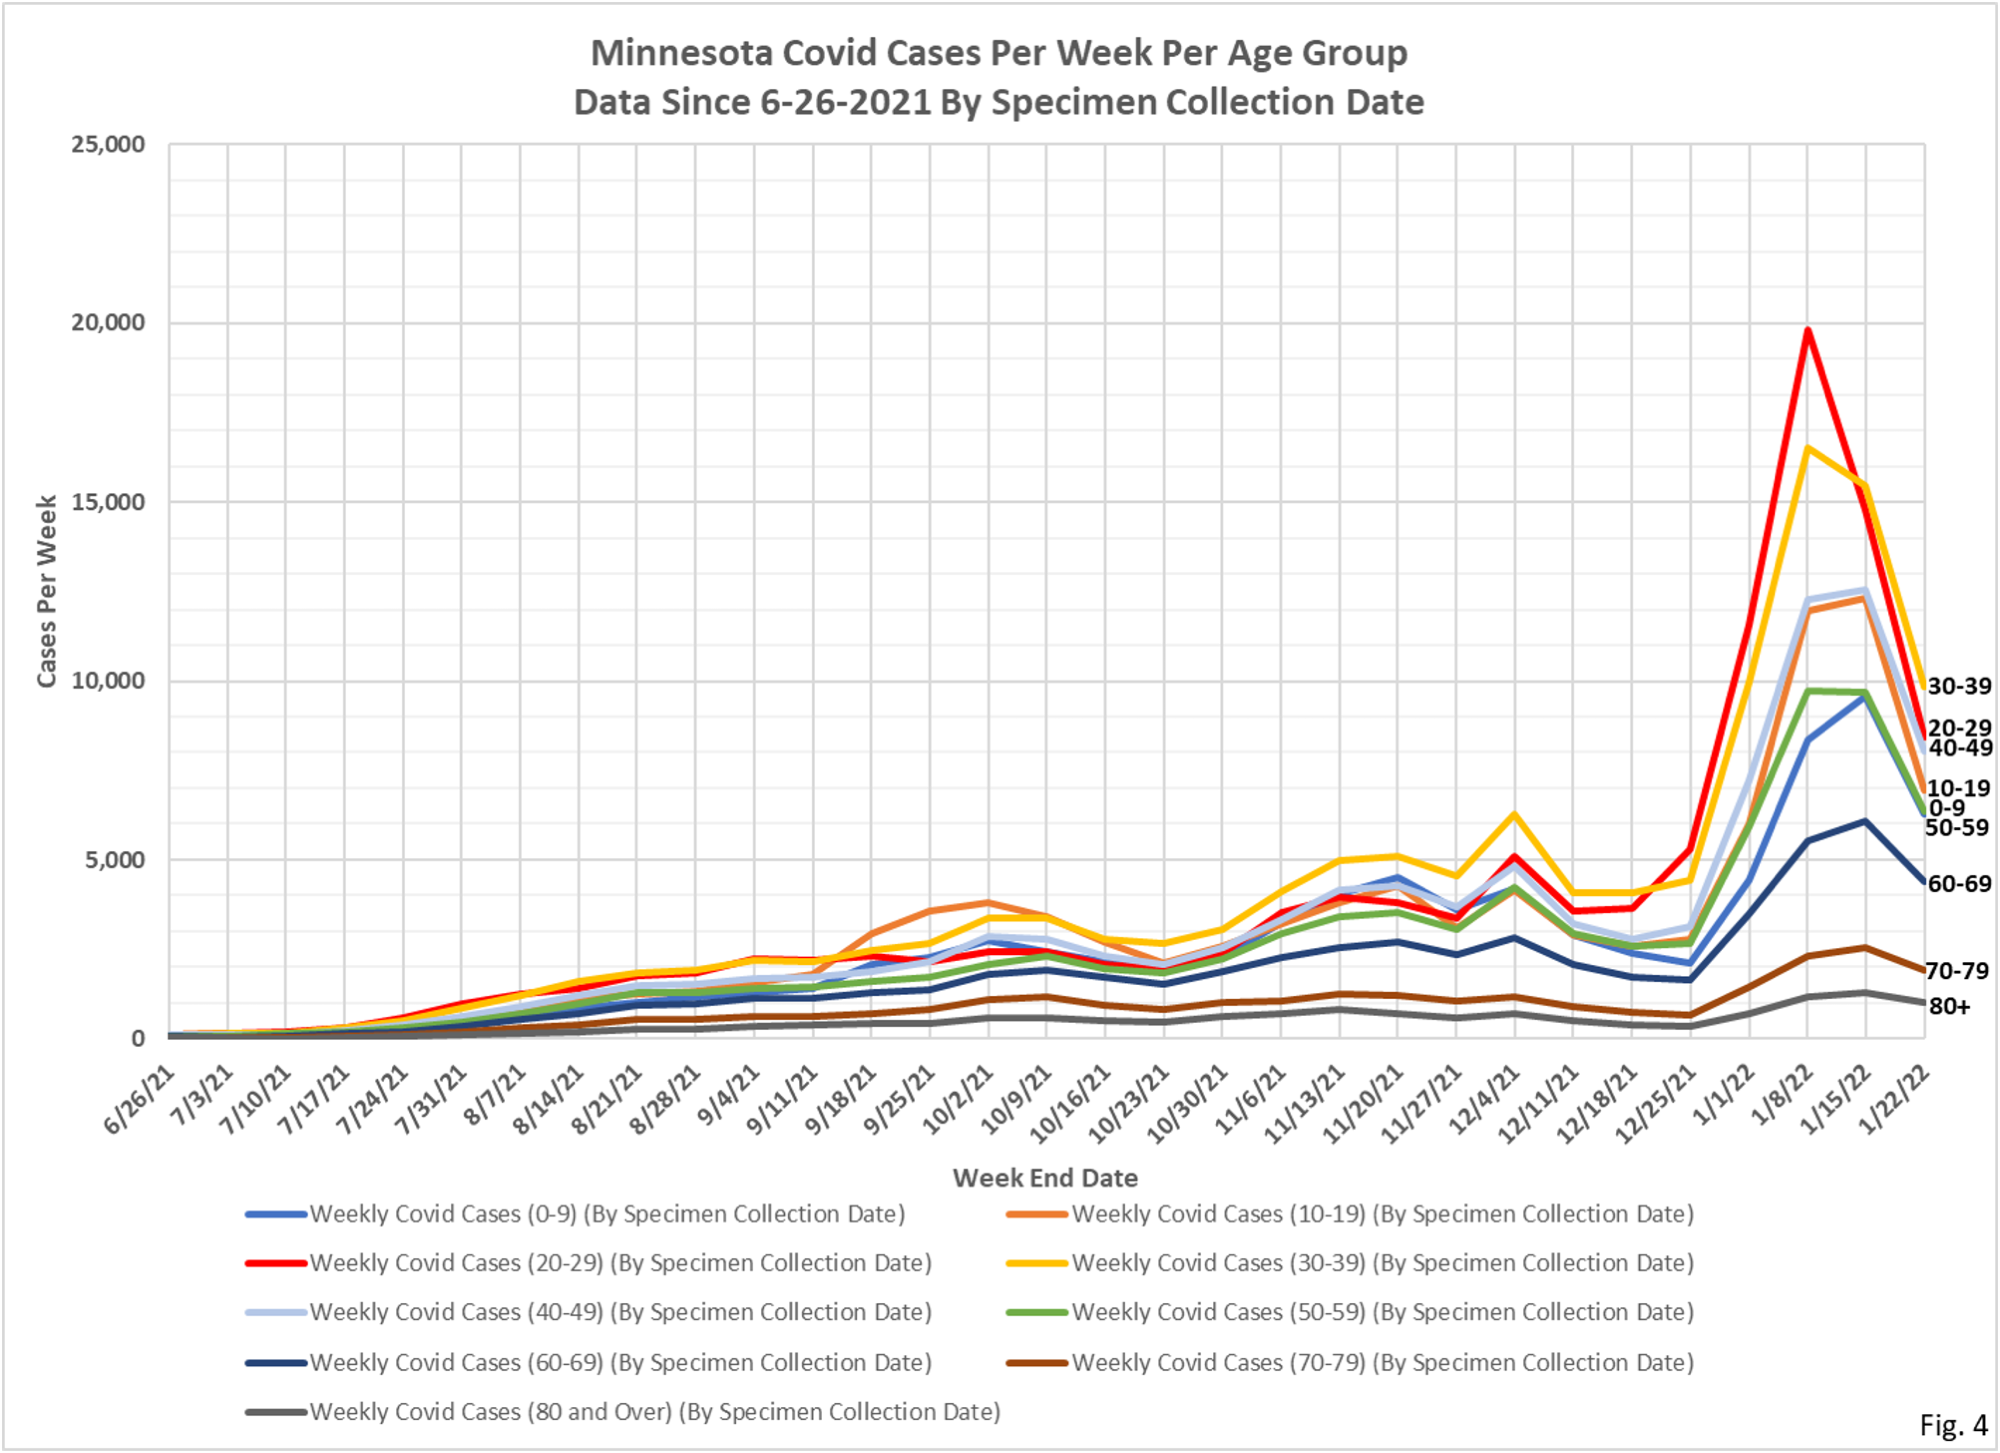
3. The data for the Covid cases per week come from a data file published along with the Minnesota Weekly Report, here: https://www.health.state.mn.us/diseases/coronavirus/stats/index.html#wagscd1 This data is published by date of specimen collection, rather than by date of report as the other data is. The data is provided as cases per week in 5 year age groups. I am compiling the data into 10 year age groups in order for the charts to be more readable. This data is updated by date of specimen collection, so it is possible that past week’s data will be updated.
4. Fig. 1 and 2: Covid Tests Per Week. Reported testing is sharply lower this week, matching the decreases seen recently in testing data on the Situation Update for COVID-19 web page https://www.health.state.mn.us/diseases/coronavirus/situation.html.
5. Fig. 3 and 4: Covid Cases Per Week. The reported Covid cases this week were sharply lower this week in all age groups. The reported cases on the Situation Update page peaked on Jan.10, matching the appearance of the this chart fairly well. Processing of Covid cases has been lagging more than usual according to MDH, and there were large changes to last week’s reported cases. Total cases for the week were reported as 53,226, a 36% decrease from last week’s revised total of 84,278 cases.
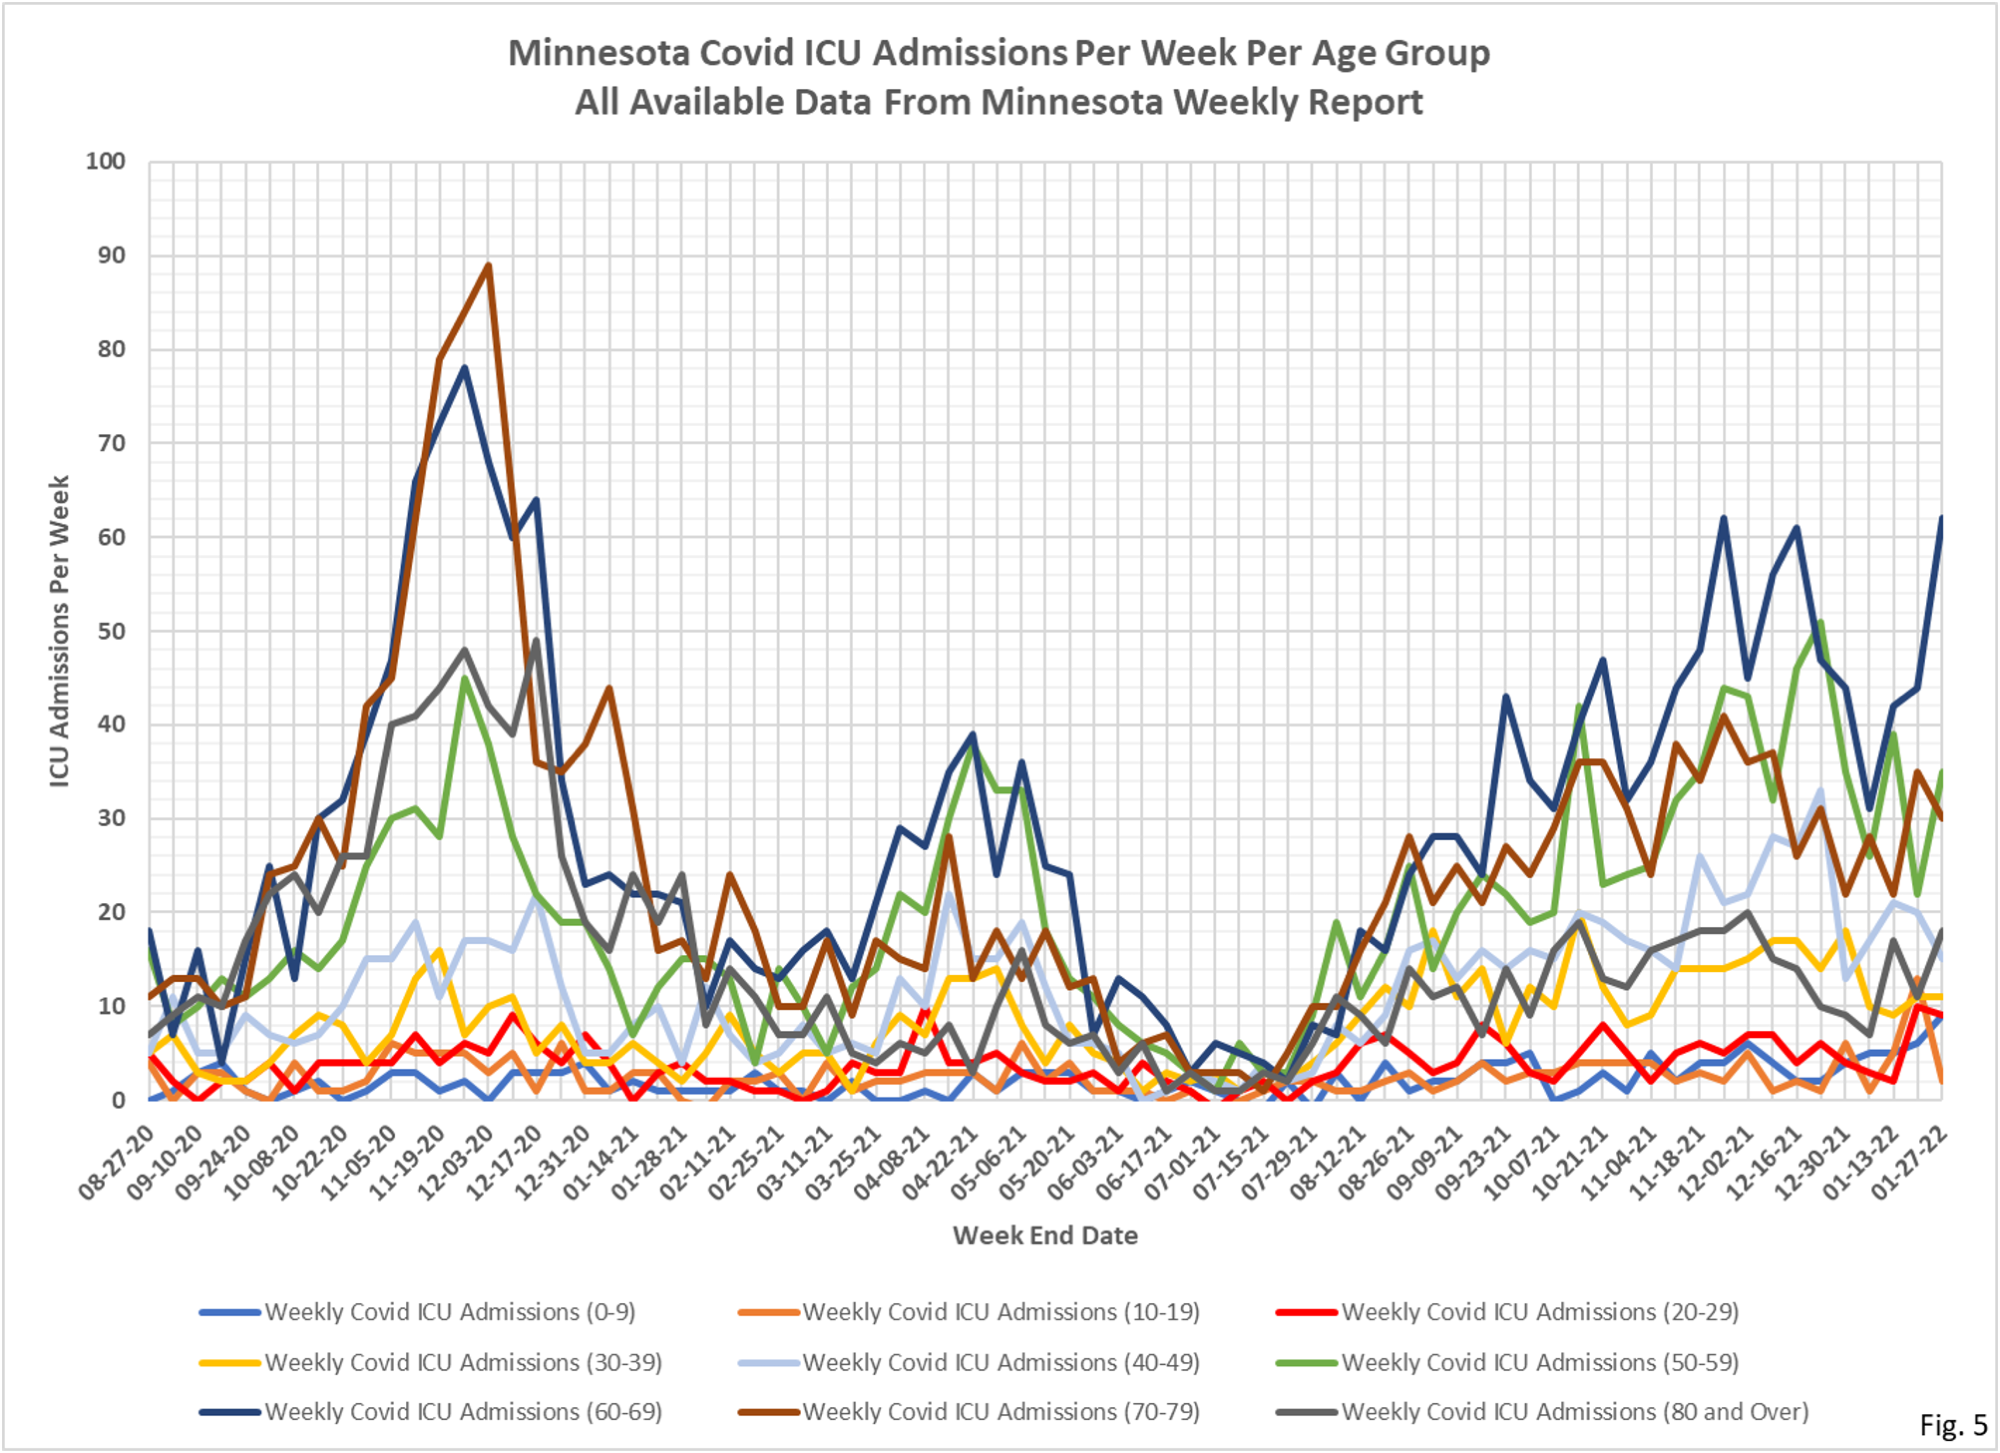
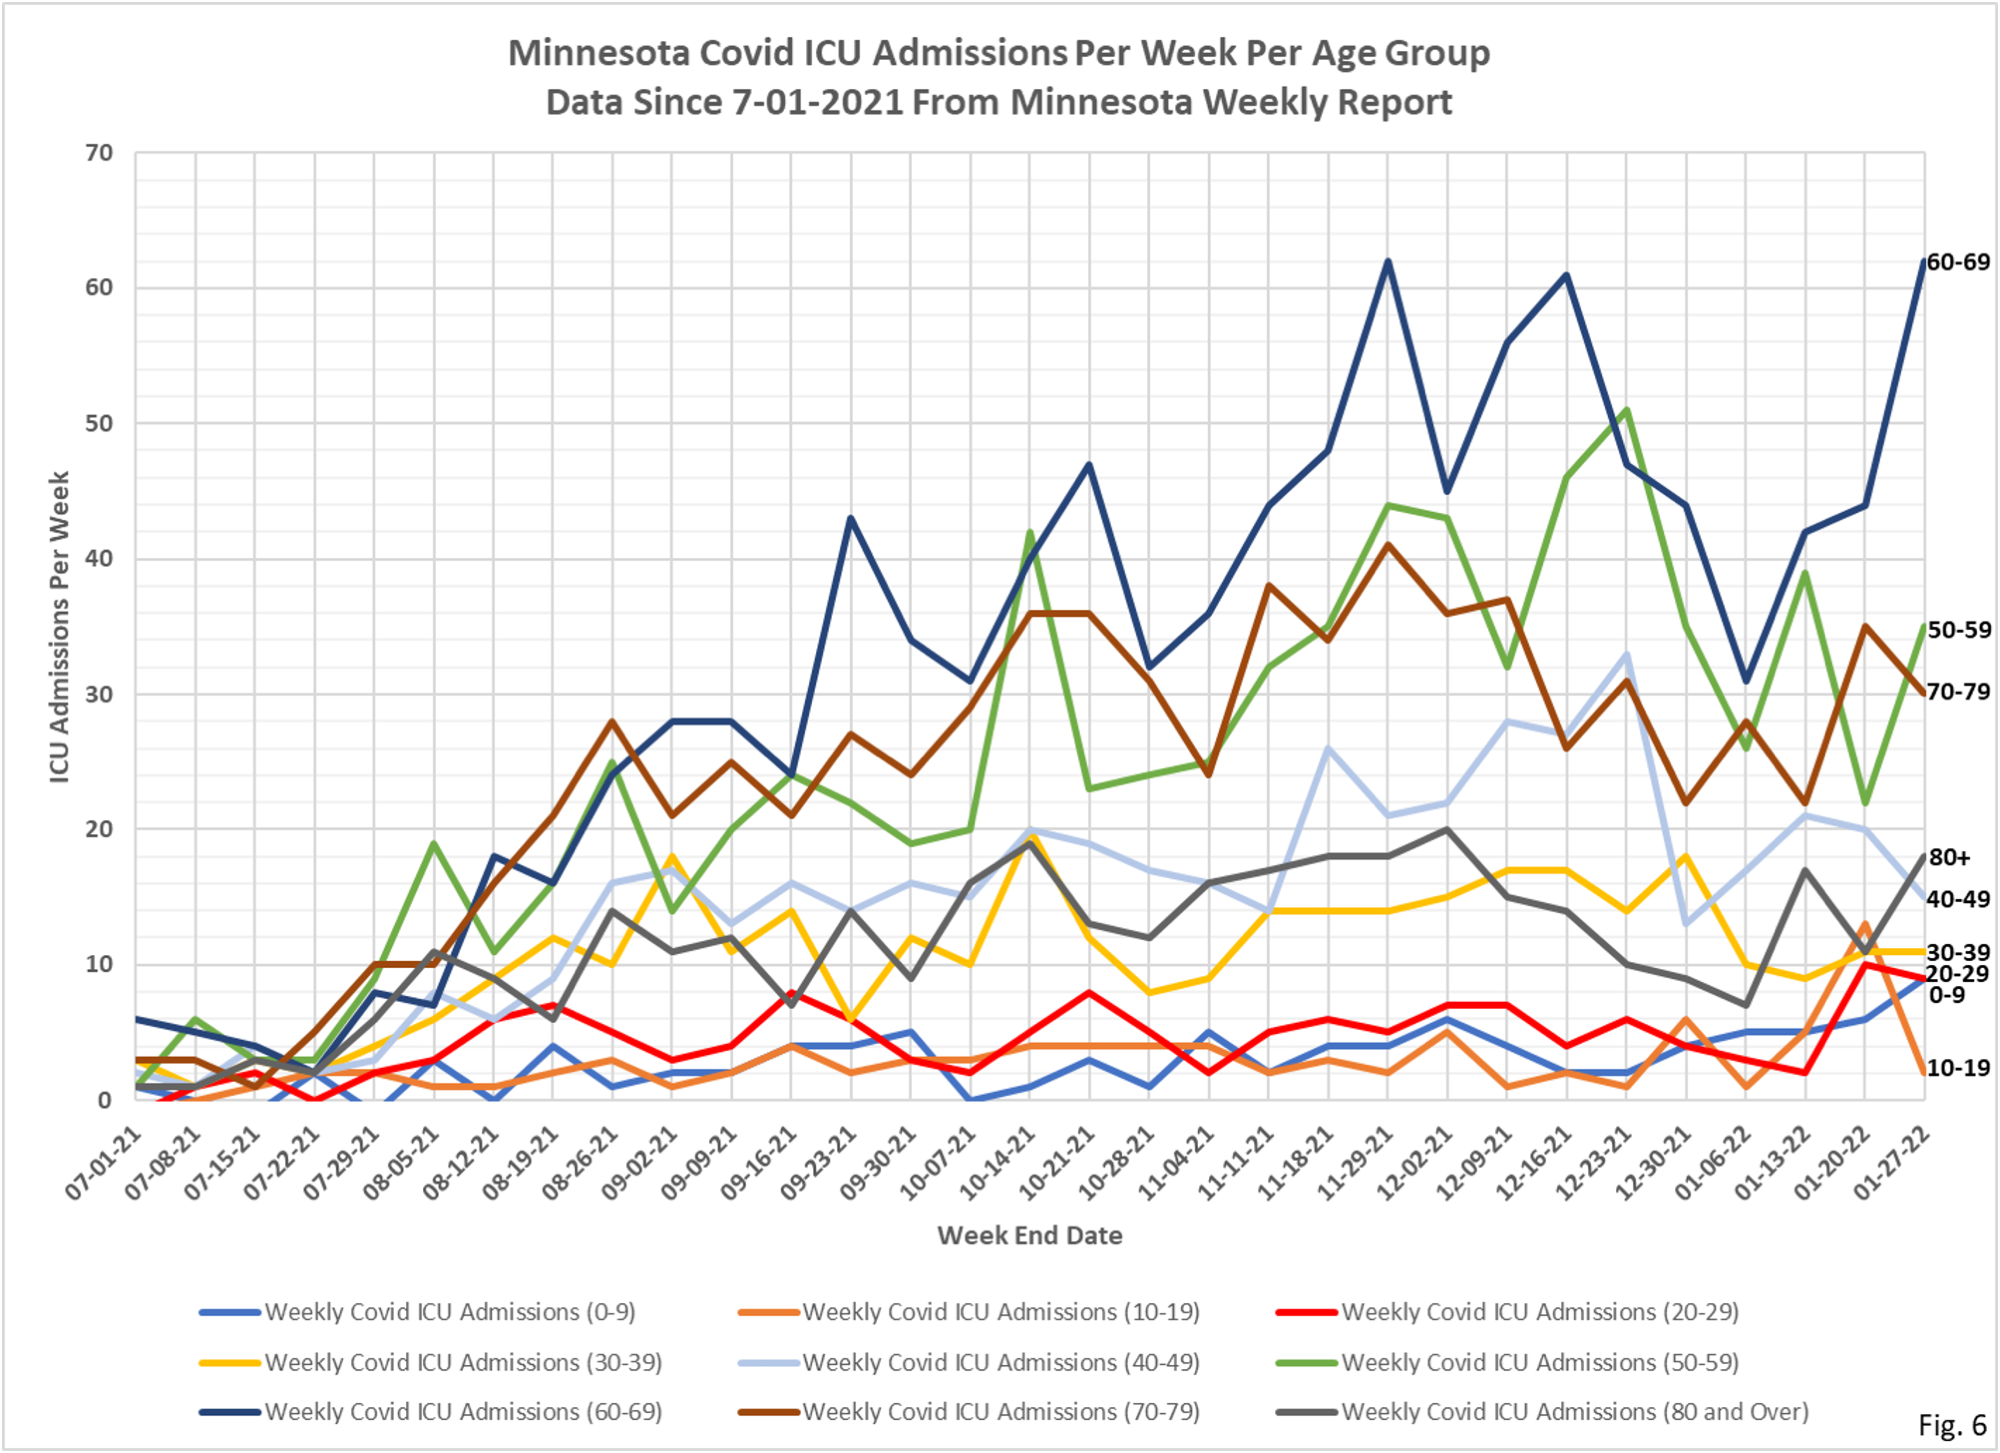
6. Fig. 5 and 6: ICU Covid Admissions Per Week. ICU Covid admissions were mixed again this week, with the 50-59, 60-69, and 80+ age groups having large increases, and the 10-19, 40-49, and 70-79 age groups decreasing. Reported total ICU admissions for the week were 191, an increase of 19 from the 172 admissions the prior week.
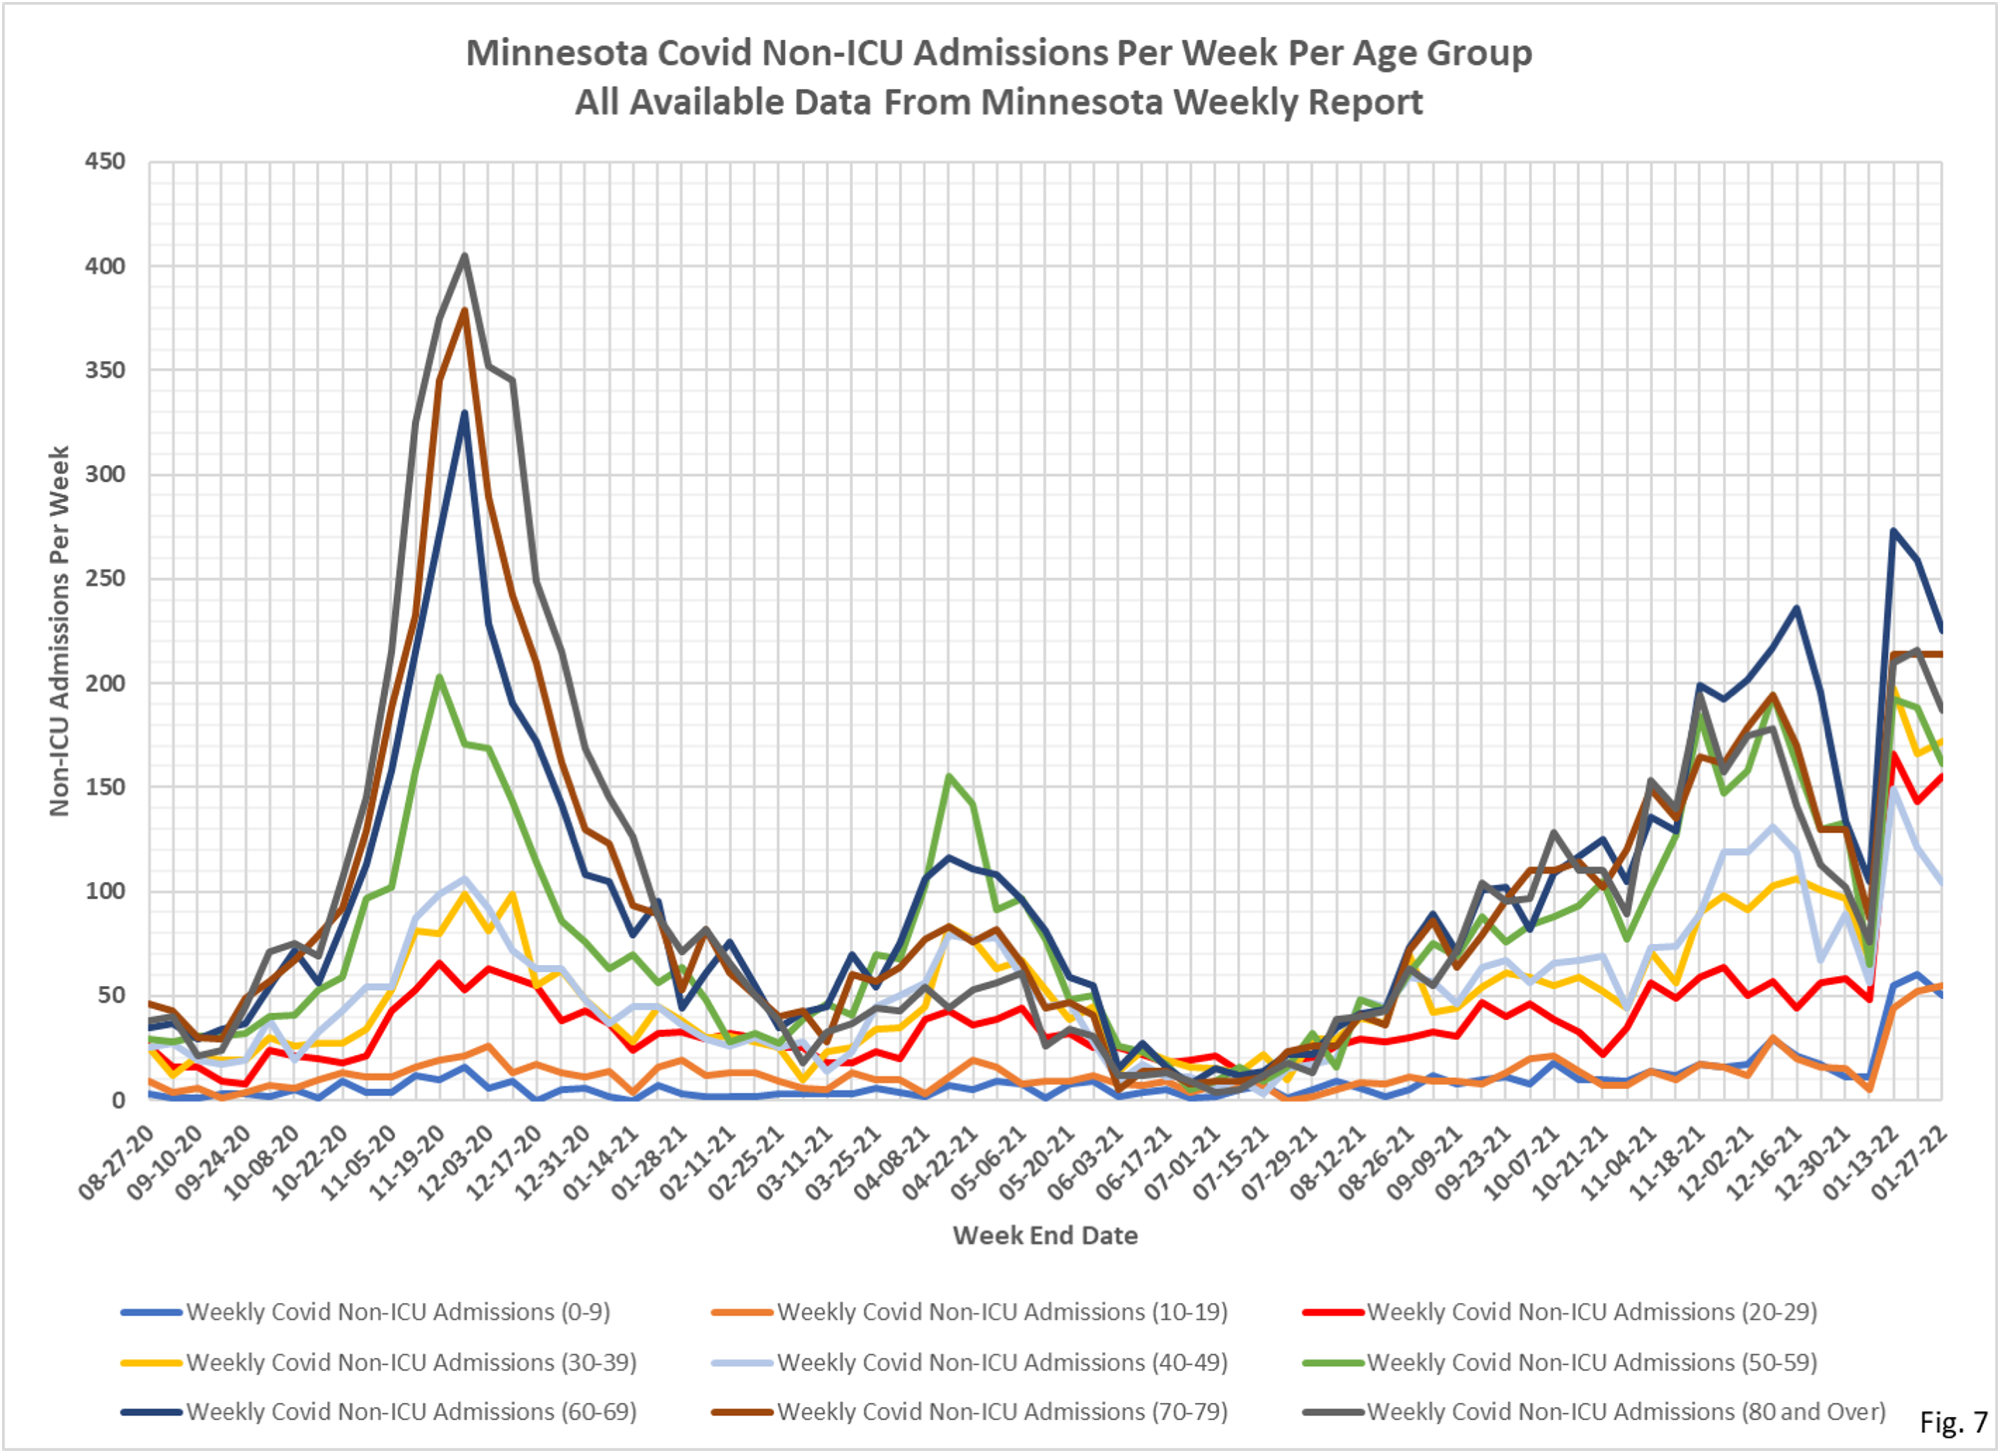
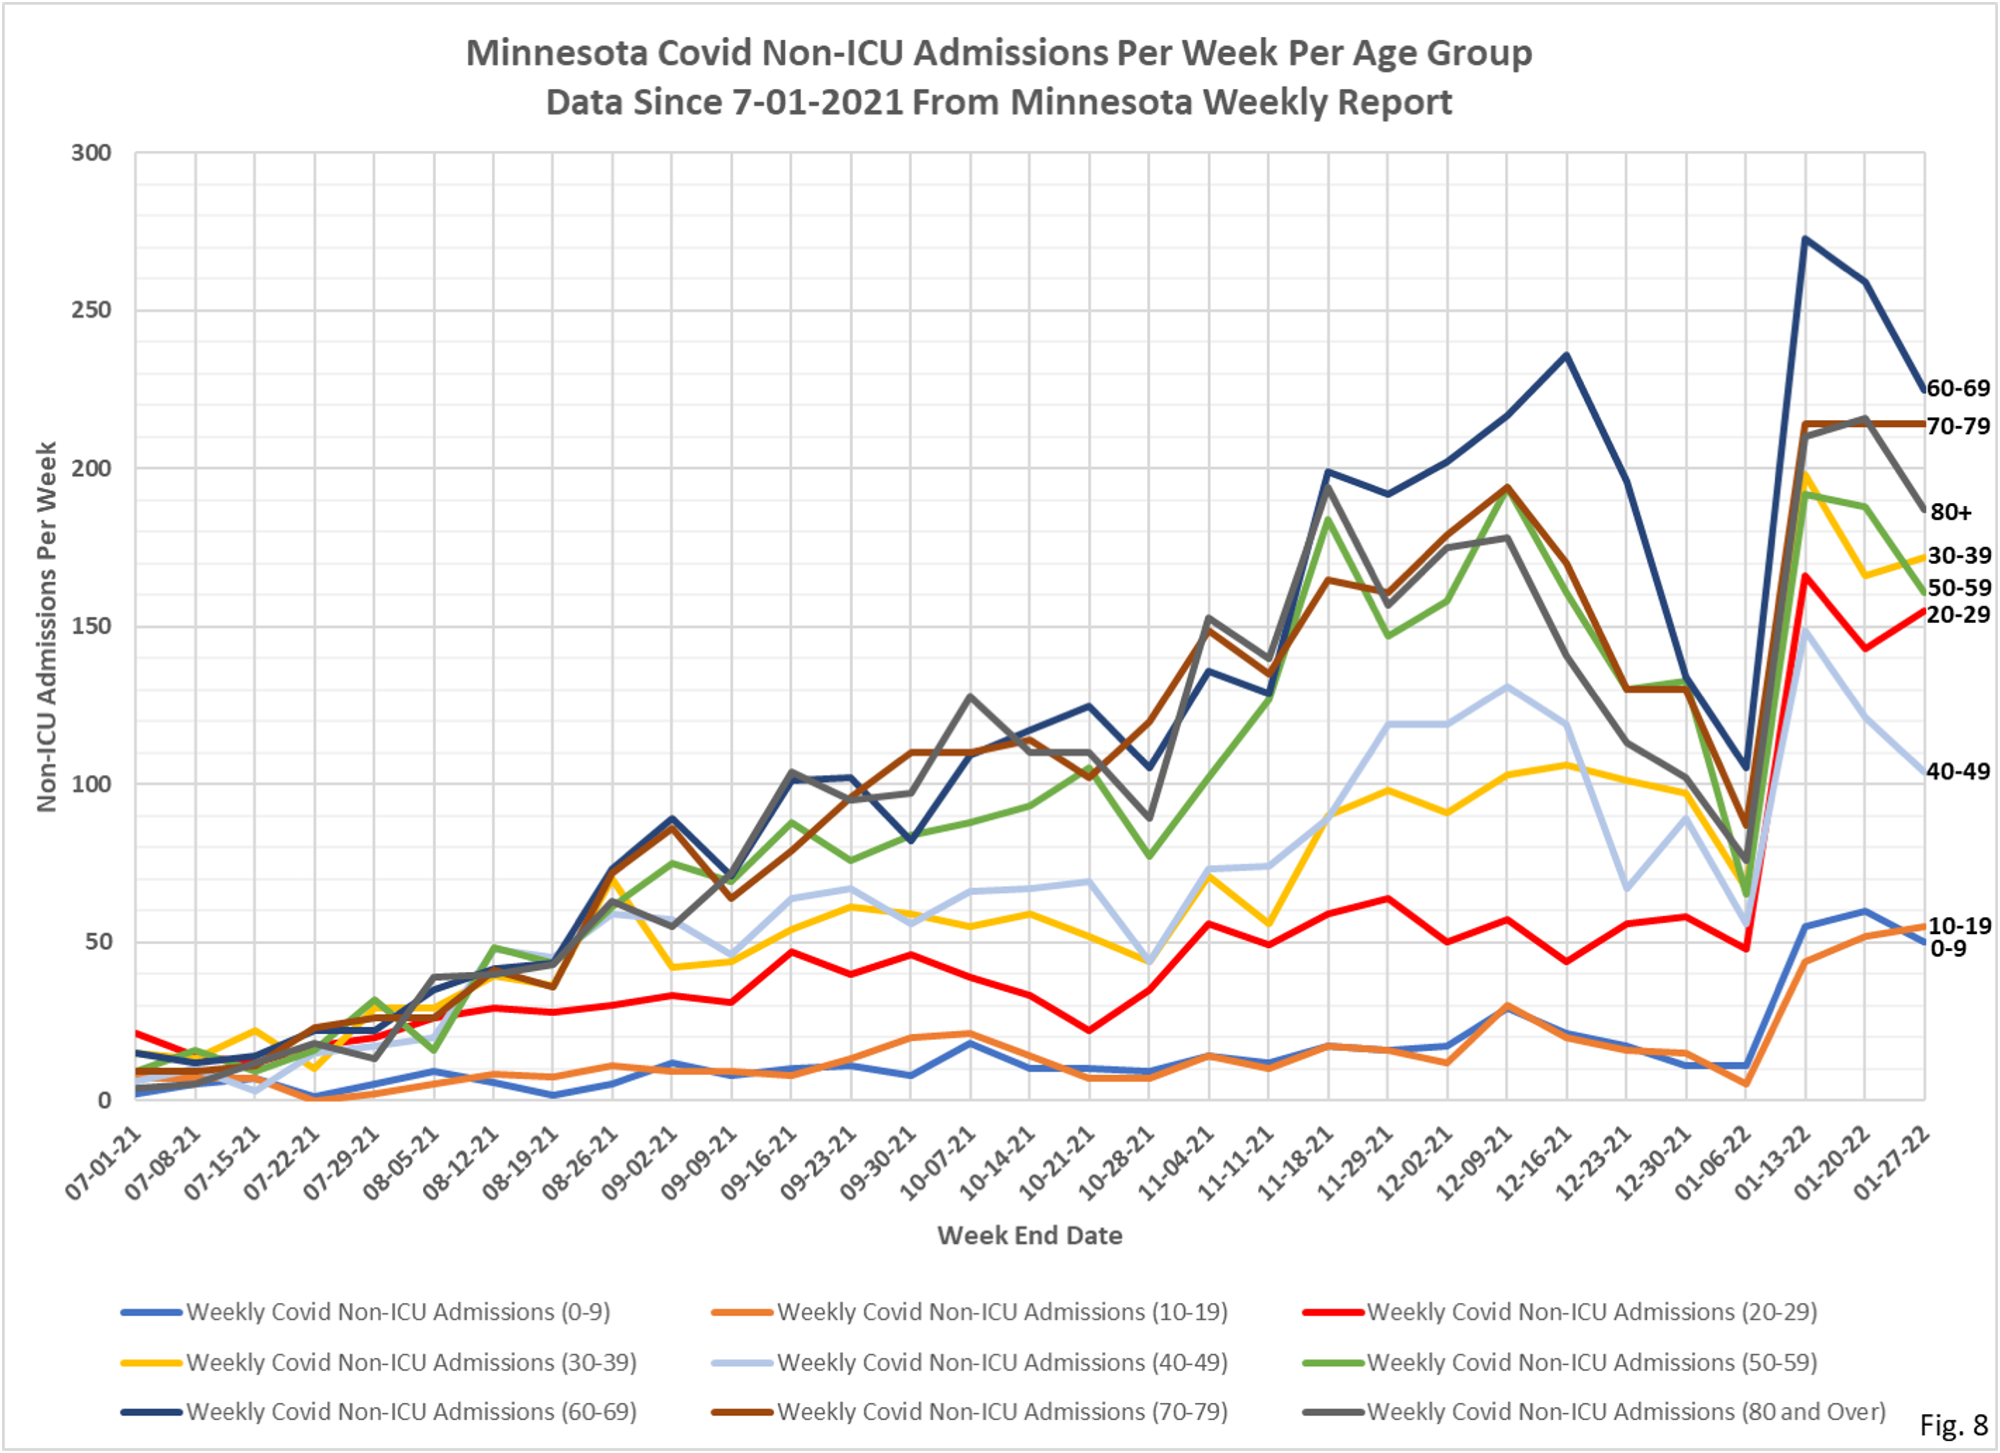
7. Fig. 7 and 8: Non-ICU Covid Admissions Per Week. Reported Non-ICU Covid admissions have remained fairly level for the second week in a row. The 40-49, 60-69, and 80+ age had moderate decreases in admissions for the week. Total Non-ICU Covid admissions for the week were 1323, a decrease of 96 admissions from the prior week.
8. Fig. 9 and 10: Covid Deaths Per Week. Total reported Covid deaths for the week were 224, an increase of 48 from the 176 reported deaths the week before. The deaths per age group were in order of age, as seen throughout most of the pandemic.