Jeremy Olson (who is truly an excellent and thorough reporter) noted in a story that the metro is the most heavily vaxed part of the state but also has the most cases (now caught up to by a certain area of the state with an internationally prominent health center which fires unvaxed workers) and an earlier surge. Dave validated this and you see the results below. When the epidemic of the unvaxed narrative is getting blown up by the media arm of the Democrat party in the state, you know its over. Dave’s notes:
- In the Minneapolis-Star Tribune on 1-24-2022 (https://www.startribune.com/minnesota-breakthrough-covid-19-trends-support-vaccine-effectiveness/600139075/) Jeremy Olson noted that the Omicron wave of cases in Minnesota started in the highly vaccinated Metro area before spreading out to the less vaccinated rural areas of the state. We thought it might be worth a closer look to see what the Minnesota regional cases and death data looks like.
- In the archives for the Minnesota Weekly Report, the Minnesota Department of Health publishes data on Covid cases and deaths by county (https://www.health.state.mn.us/diseases/coronavirus/stats/index.html). This data is published as cumulative totals in each county each week. The weekly cumulative data is collected, and one week subtracted from the next to determine the cases and deaths in each county each week.
- Cases and deaths per week per county are converted to cases per week per county per 10k, and deaths per county per week per 10k, using US Census county population estimates for 2019 available here: https://www.census.gov/data/datasets/time-series/demo/popest/2010s-counties-detail.html
- The Minnesota regional averages are computed using the same regional definitions used to display regional hospital bed availability on the Minnesota COVID-19 Response Capacity web page: https://mn.gov/covid19/data/response-prep/response-capacity.jsp.
- Minnesota regional vaccination rates were computed using the People Vaccinated by County data file available on the MDH Vaccine Data web page: https://mn.gov/covid19/vaccine/data/index.jsp. These data files are contain cumulative totals on the date published. We have been collecting these data files since nearly the start of vaccinations and are able to calculate regional vaccinations rates.
- Note that MDH does not publish any details about vaccination booster shots, only the cumulative totals administered statewide.
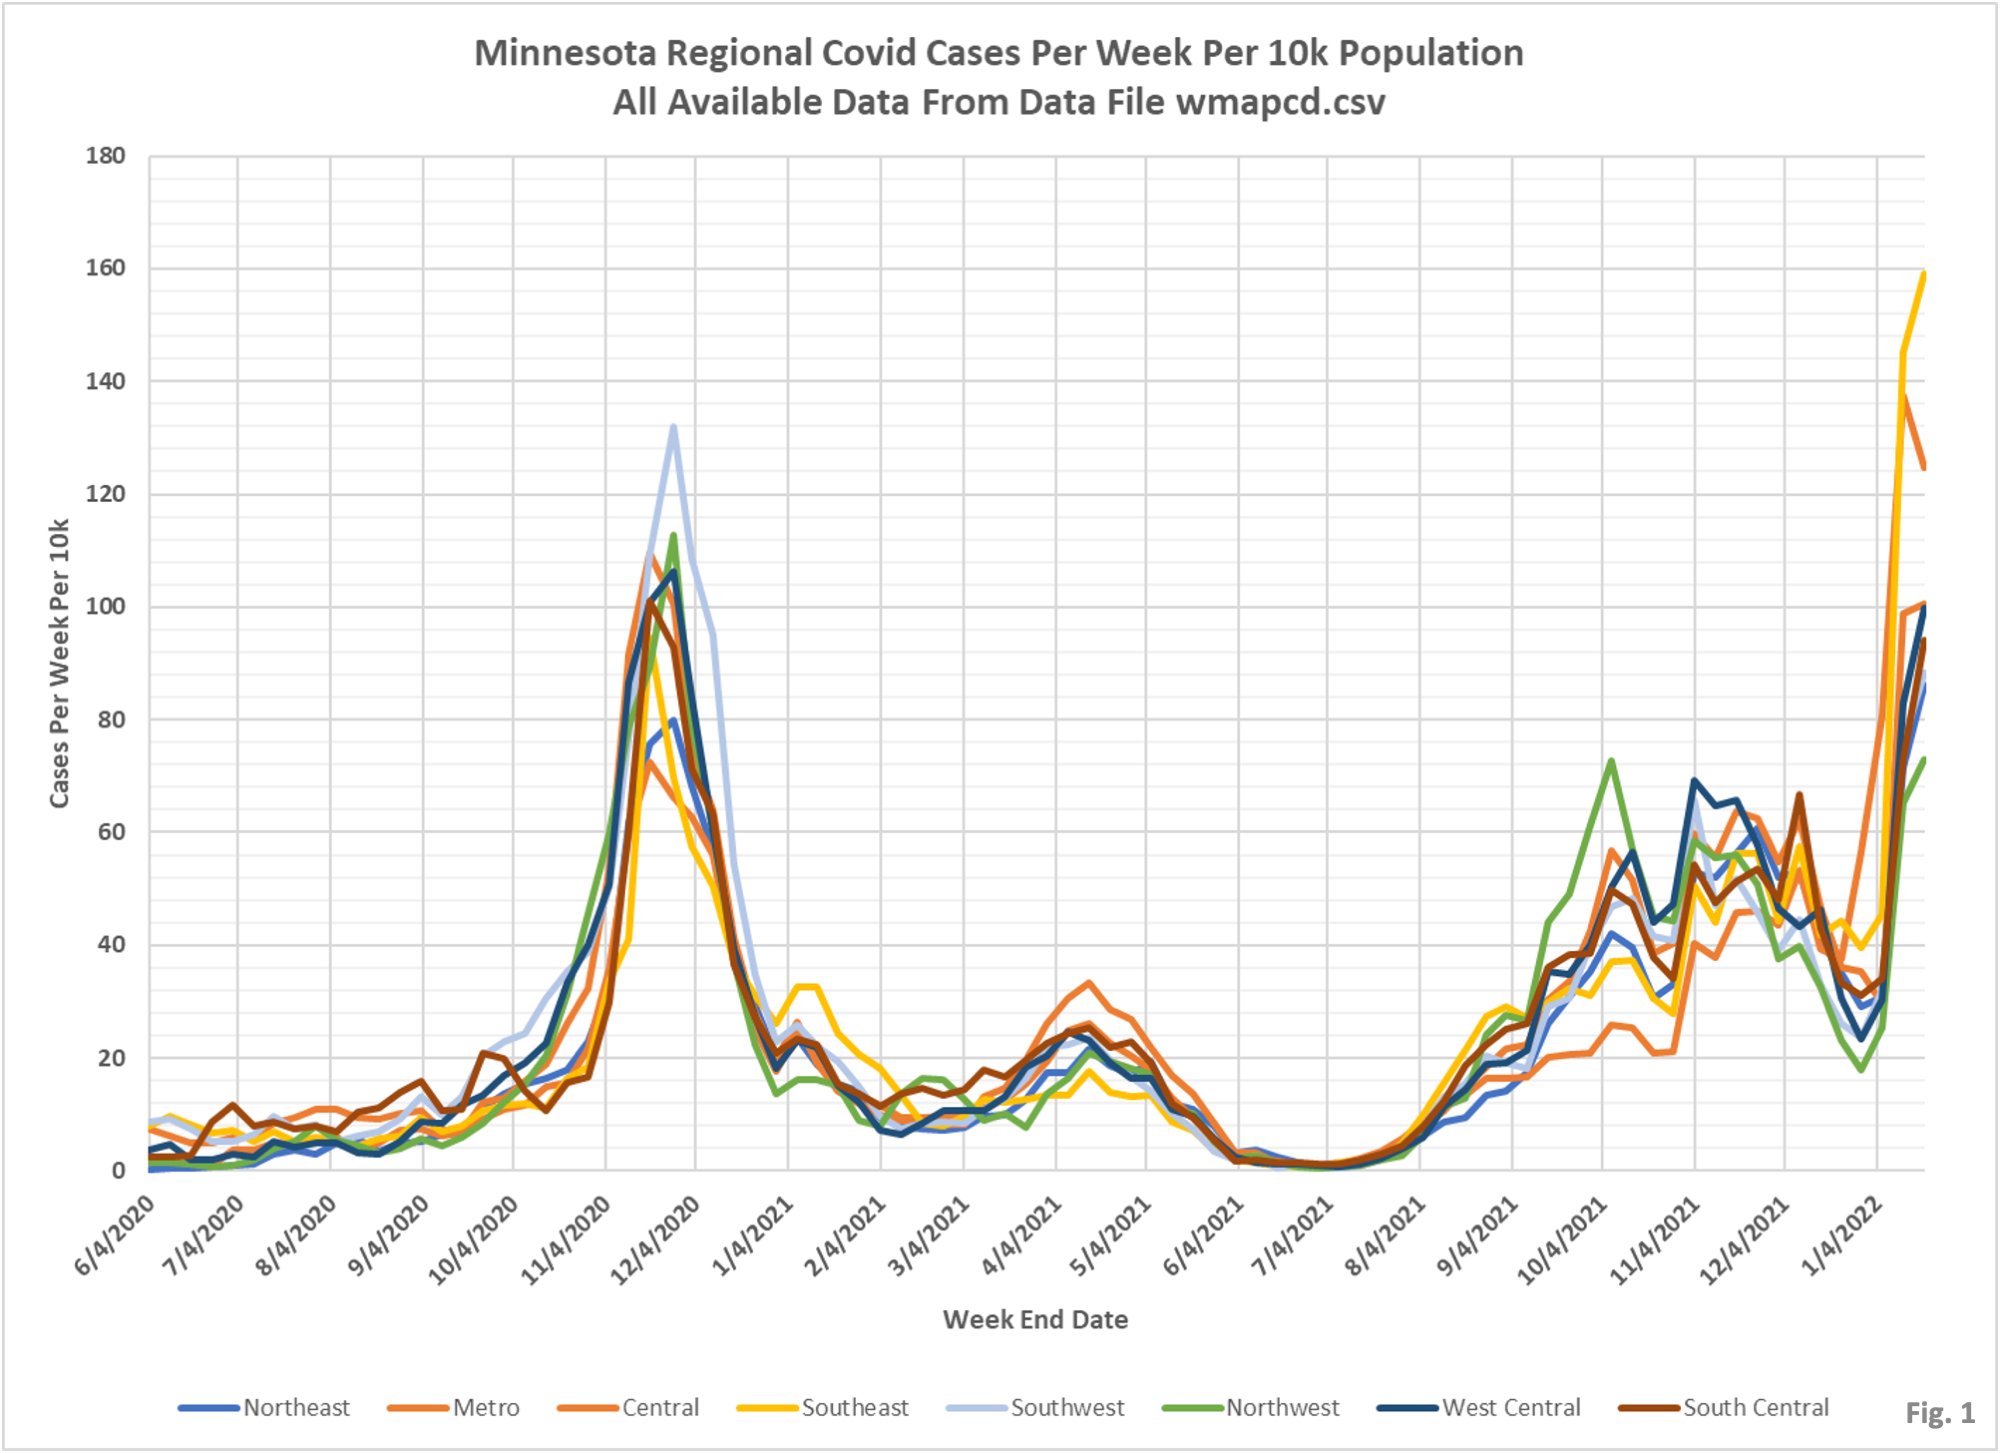
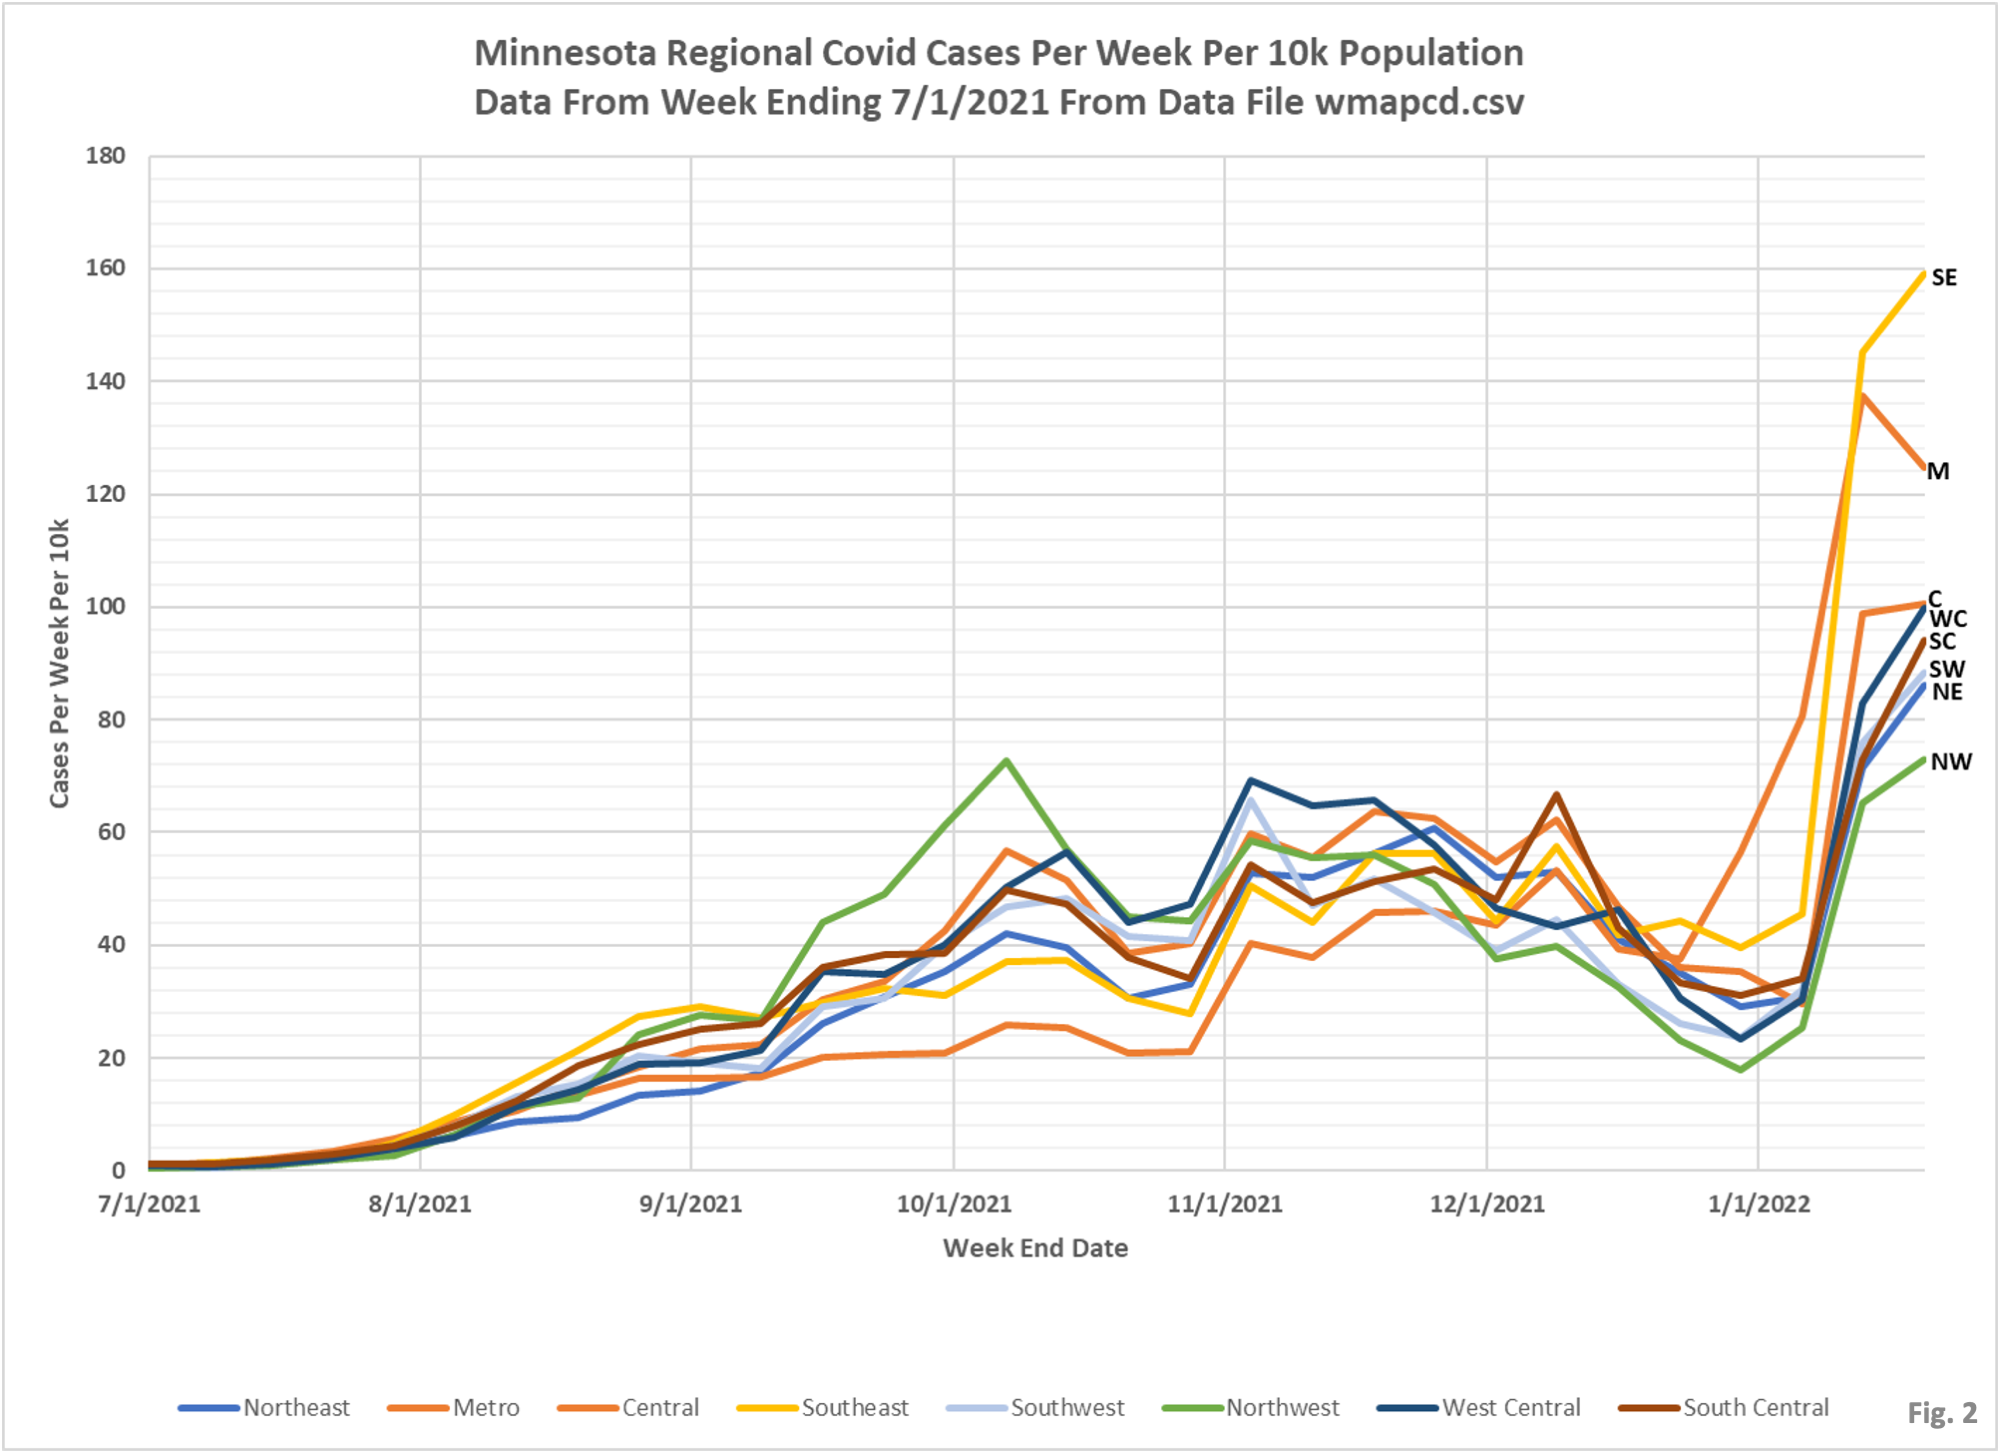
- Fig. 1 and 2: Cases per region per week per 10k. We can see in Fig. 2 that the cases in the Metro region were in fact the first region to start to spike with the presumed Omicron variant in the middle of December 2021. The Southeast region had elevated cases throughout December 2021, and then spiked in early 2022, followed shortly after by all the other regions. However, so far, none of the other regions has reached the levels achieved by the Metro and Southeast regions.
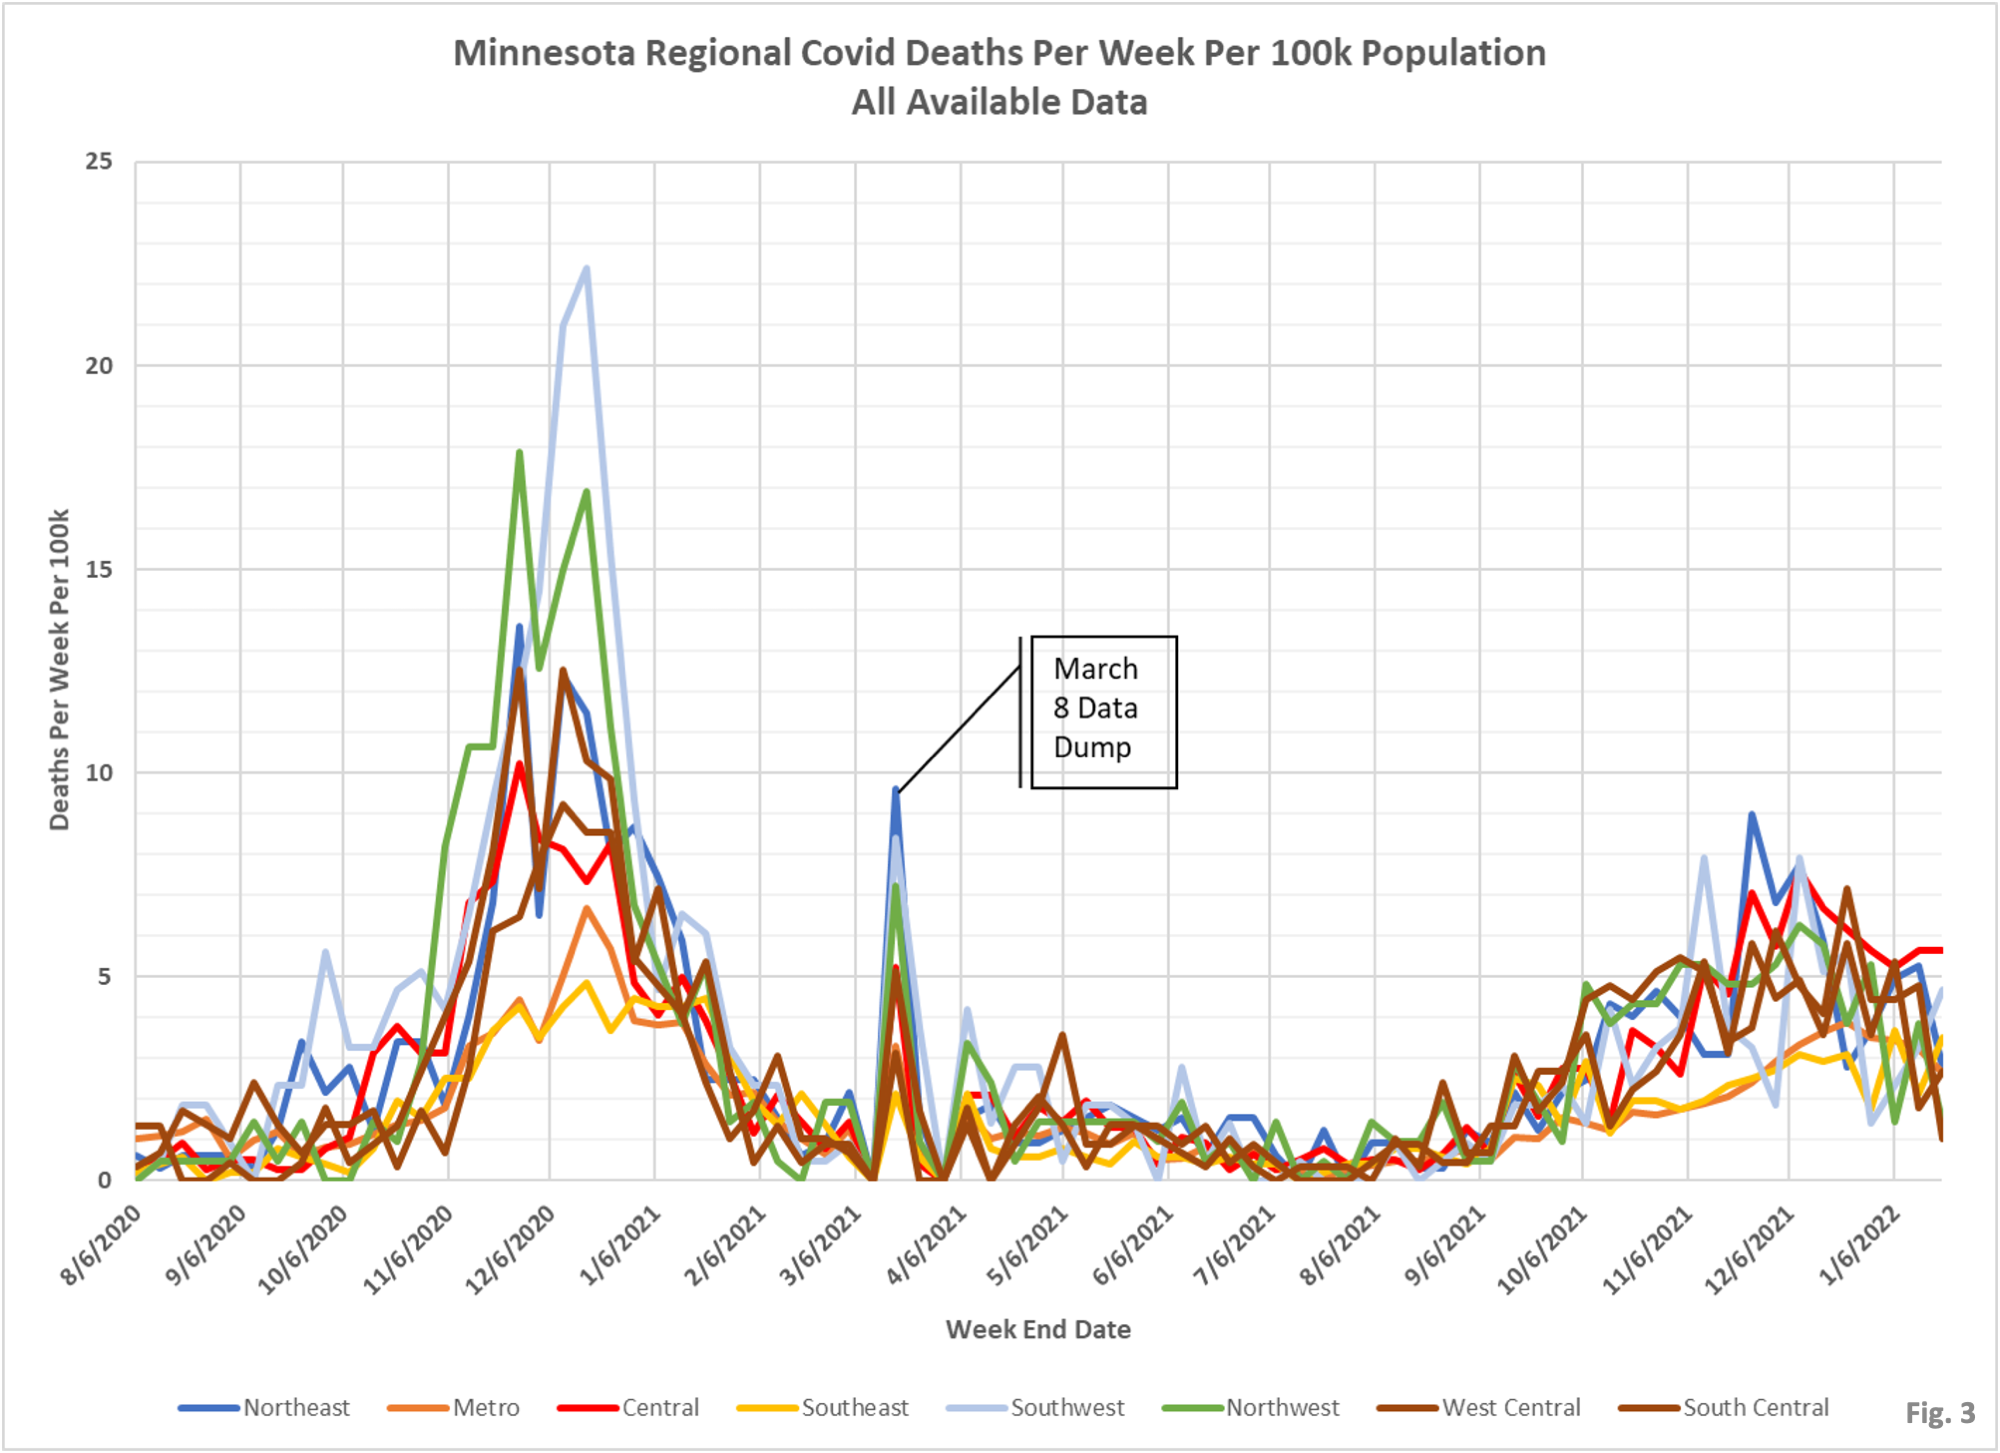
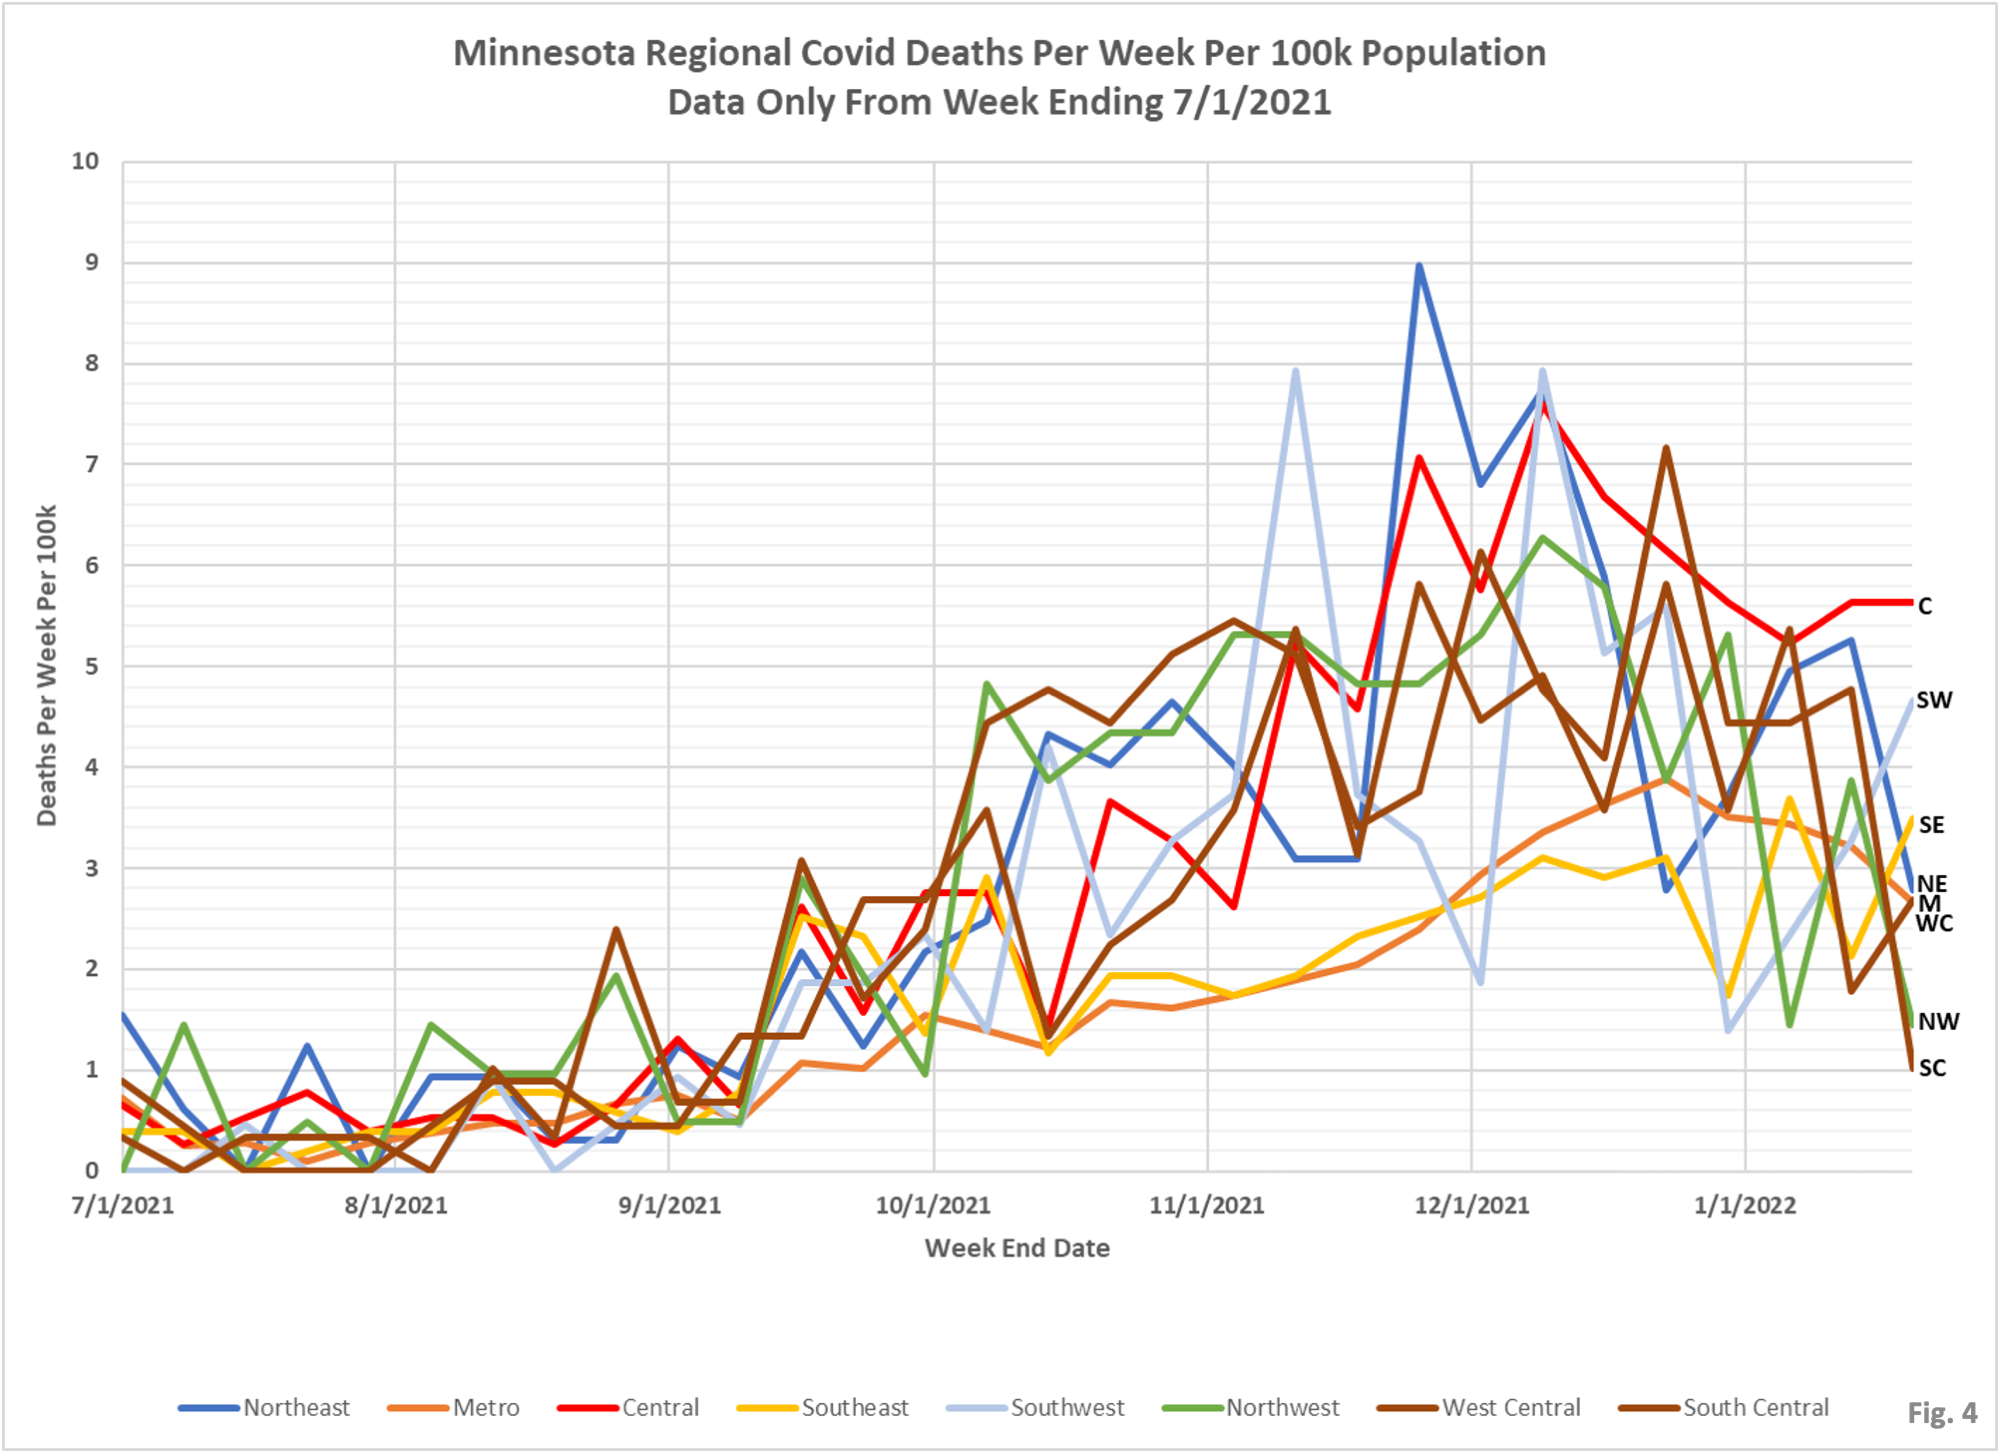
- Fig. 3 and 4: Deaths per region per week per 10k. We can see that there is really quite a large spread in death rates across the regions, although in general deaths have been declining for the last several months. An exception is the Southwest region which has seen an increase in the reported death rate for the past several weeks, along with the Southeast and West Central regions.
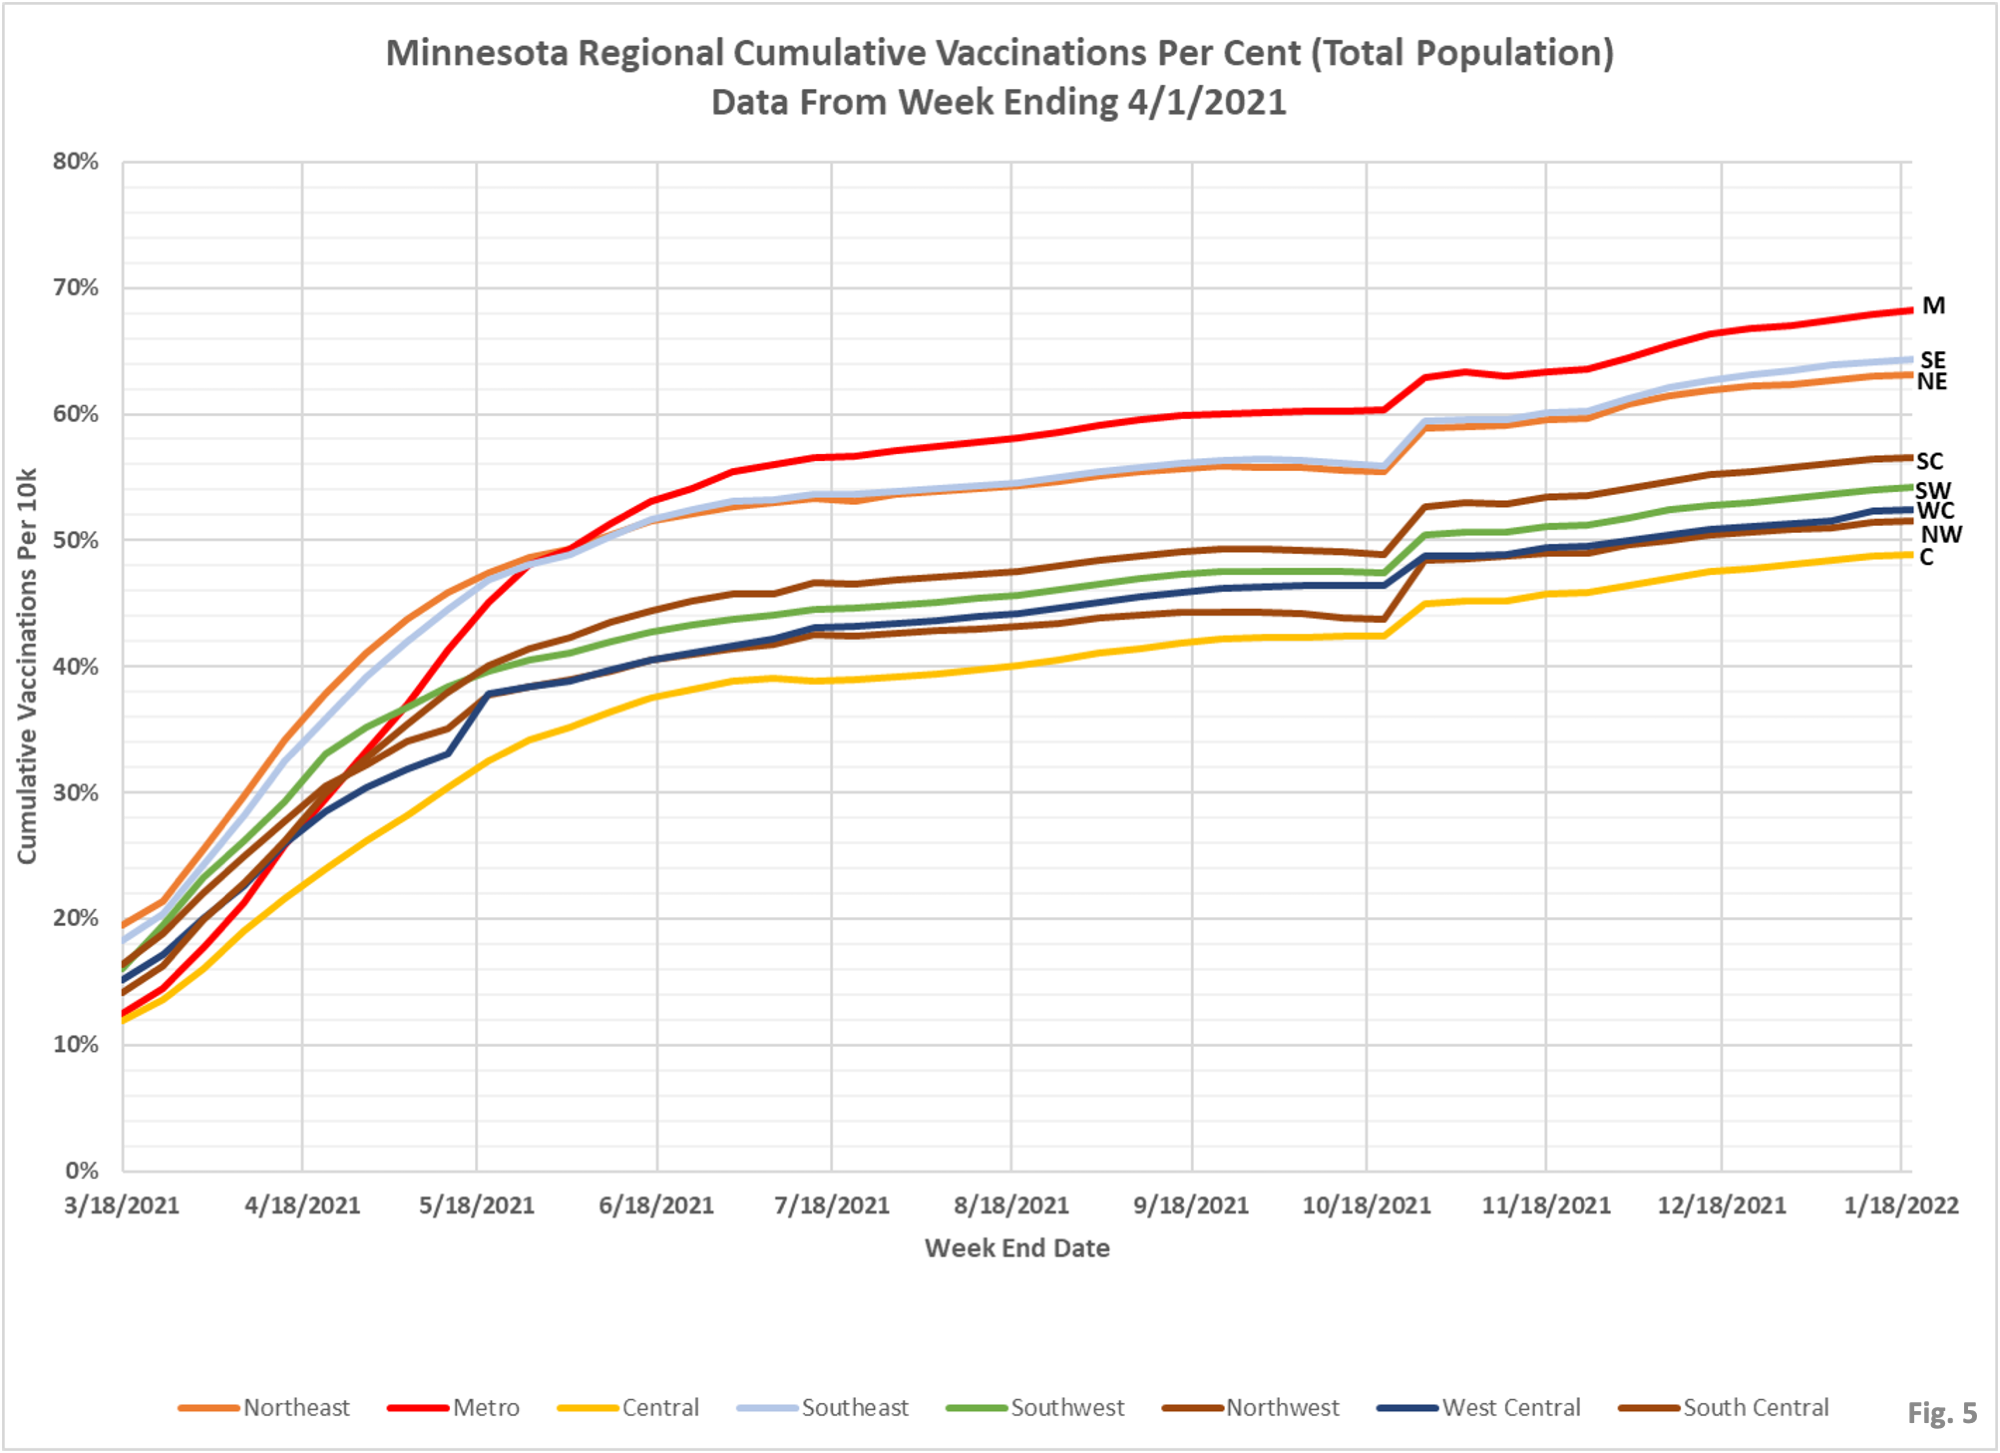
- Fig. 5: Vaccination Rates. This chart shows the vaccination rate of the entire population. We do not have the data available to us to compute vaccination rates of only the population eligible to be vaccinated. We can see some discontinuities in the rate curves in November, 2021. In this time period there are peculiarities where some counties have cumulative people vaccinated fall from one week to the next, while other counties have a large increase. If the mistake is mine I can’t find it. As Jeremy Olson reports the Metro region is indeed the most highly vaccinated, followed closely by the Southeast region, the 2 regions with the highest infection rate during the Omicron wave of cases. Are these 2 regions also the most highly tested? One suspects that this is the case.