Dave Dixon really does a superb job of putting this information in tables and charts that give the picture. And it is pretty interesting right now. All my usual caveats–these are proportions, not case rates, not per capita rates. They still serve a valid function. And we give you the others when we think we have adequate data. DOH is really good at hiding the relevant data. For example, we get no information on where the partly vaxed are, or the people whose vax status they don’t know, or people vaxed in places they don’t track. How many people is that? We get no information on prior infection status in each group, and that data DOH definitely has. We don’t know how many of the hosps and deaths in each subgroup are incidental. And we have no idea how many real cases there are right now.
I am hearing constantly of vaxed and boosted people, not just here, but everywhere, who get infected. Many of them do home tests and never get a formal test that shows up in the numbers. This past week alone I heard this story from several people and these people typically said other family members or friends were also infected. So I think we have a ton of vaxed cases that are very mild and people just manage it themselves. This is important, not because of the proportion issue, but because if true, the hosp and death case rates for vaccinated people are likely to be far lower than they appear. You would think the state would figure out how to get this news out there. I can tell them how.
In any event, just to give Dave and myself a little credit for how we track this thing, we said in mid-December that when the breakthru data, which is lagged a month, for that time finally came out, we would be over 50% vaxed cases. And I think right now it is potentially as high as 75%. We also said that the peak would be around the end of the first week, start of the second week in January, and assuming no further processing dumps, it looks to be in the area of January 10. It went up fast and we think it will also come down extremely fast. There really are very few people left with no immunity.
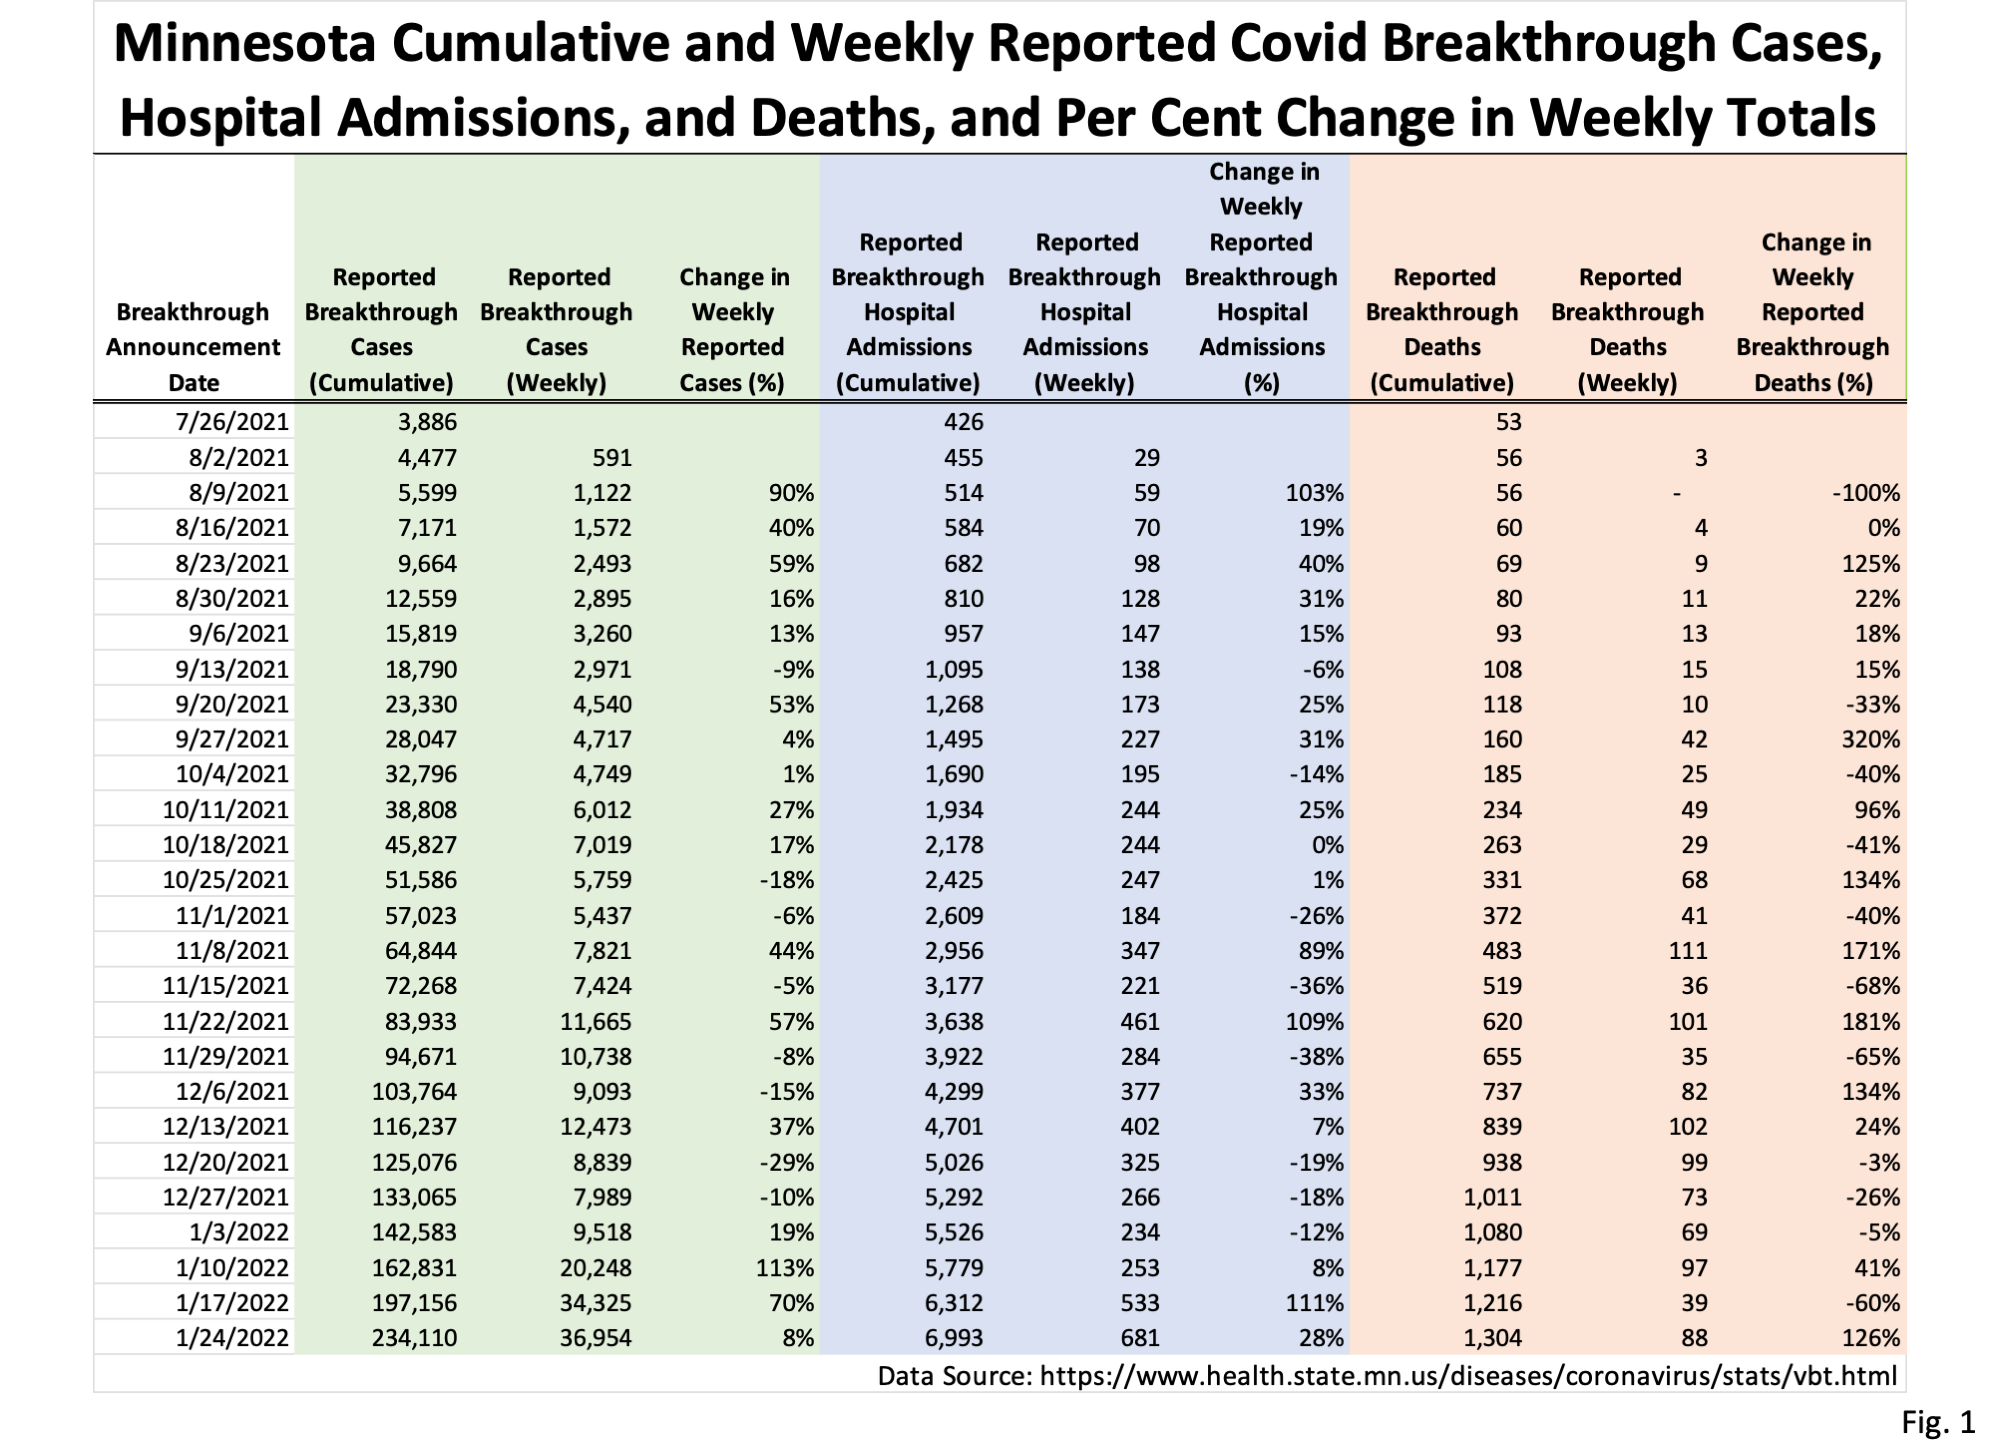
Please note, as Dave points out below, the astounding number of new breakthroughs reported this week, again heavily lagged, and the over 680 new breakthrough hosps. If you look at the first table, which is just looking at changes in the weekly numbers reported, not assigning them to date of event, you see the big jumps in hosps and deaths reported this week. If you look at the proportions graph and table you see that while cases are rising in proportion, deaths and hosps are declining. This, again, could be part vaccine and boosters and part Omicron. The age group charts are interesting too as the proportion of hosps and deaths in the middle aged groups is creeping up, but declining in the very old. That could be a vax effect.
Dave’s notes:
- The table and charts are updated for new data released by Minnesota Department of Health (MDH) on 1/24/2022, adding data for the week starting 12/19/2021.
- The data source for the data on Fig. 1 is the cumulative breakthrough cases, hospitalizations, and deaths published on the MDH COVID-19 Vaccine Breakthrough Weekly Update https://www.health.state.mn.us/diseases/coronavirus/stats/vbt.html
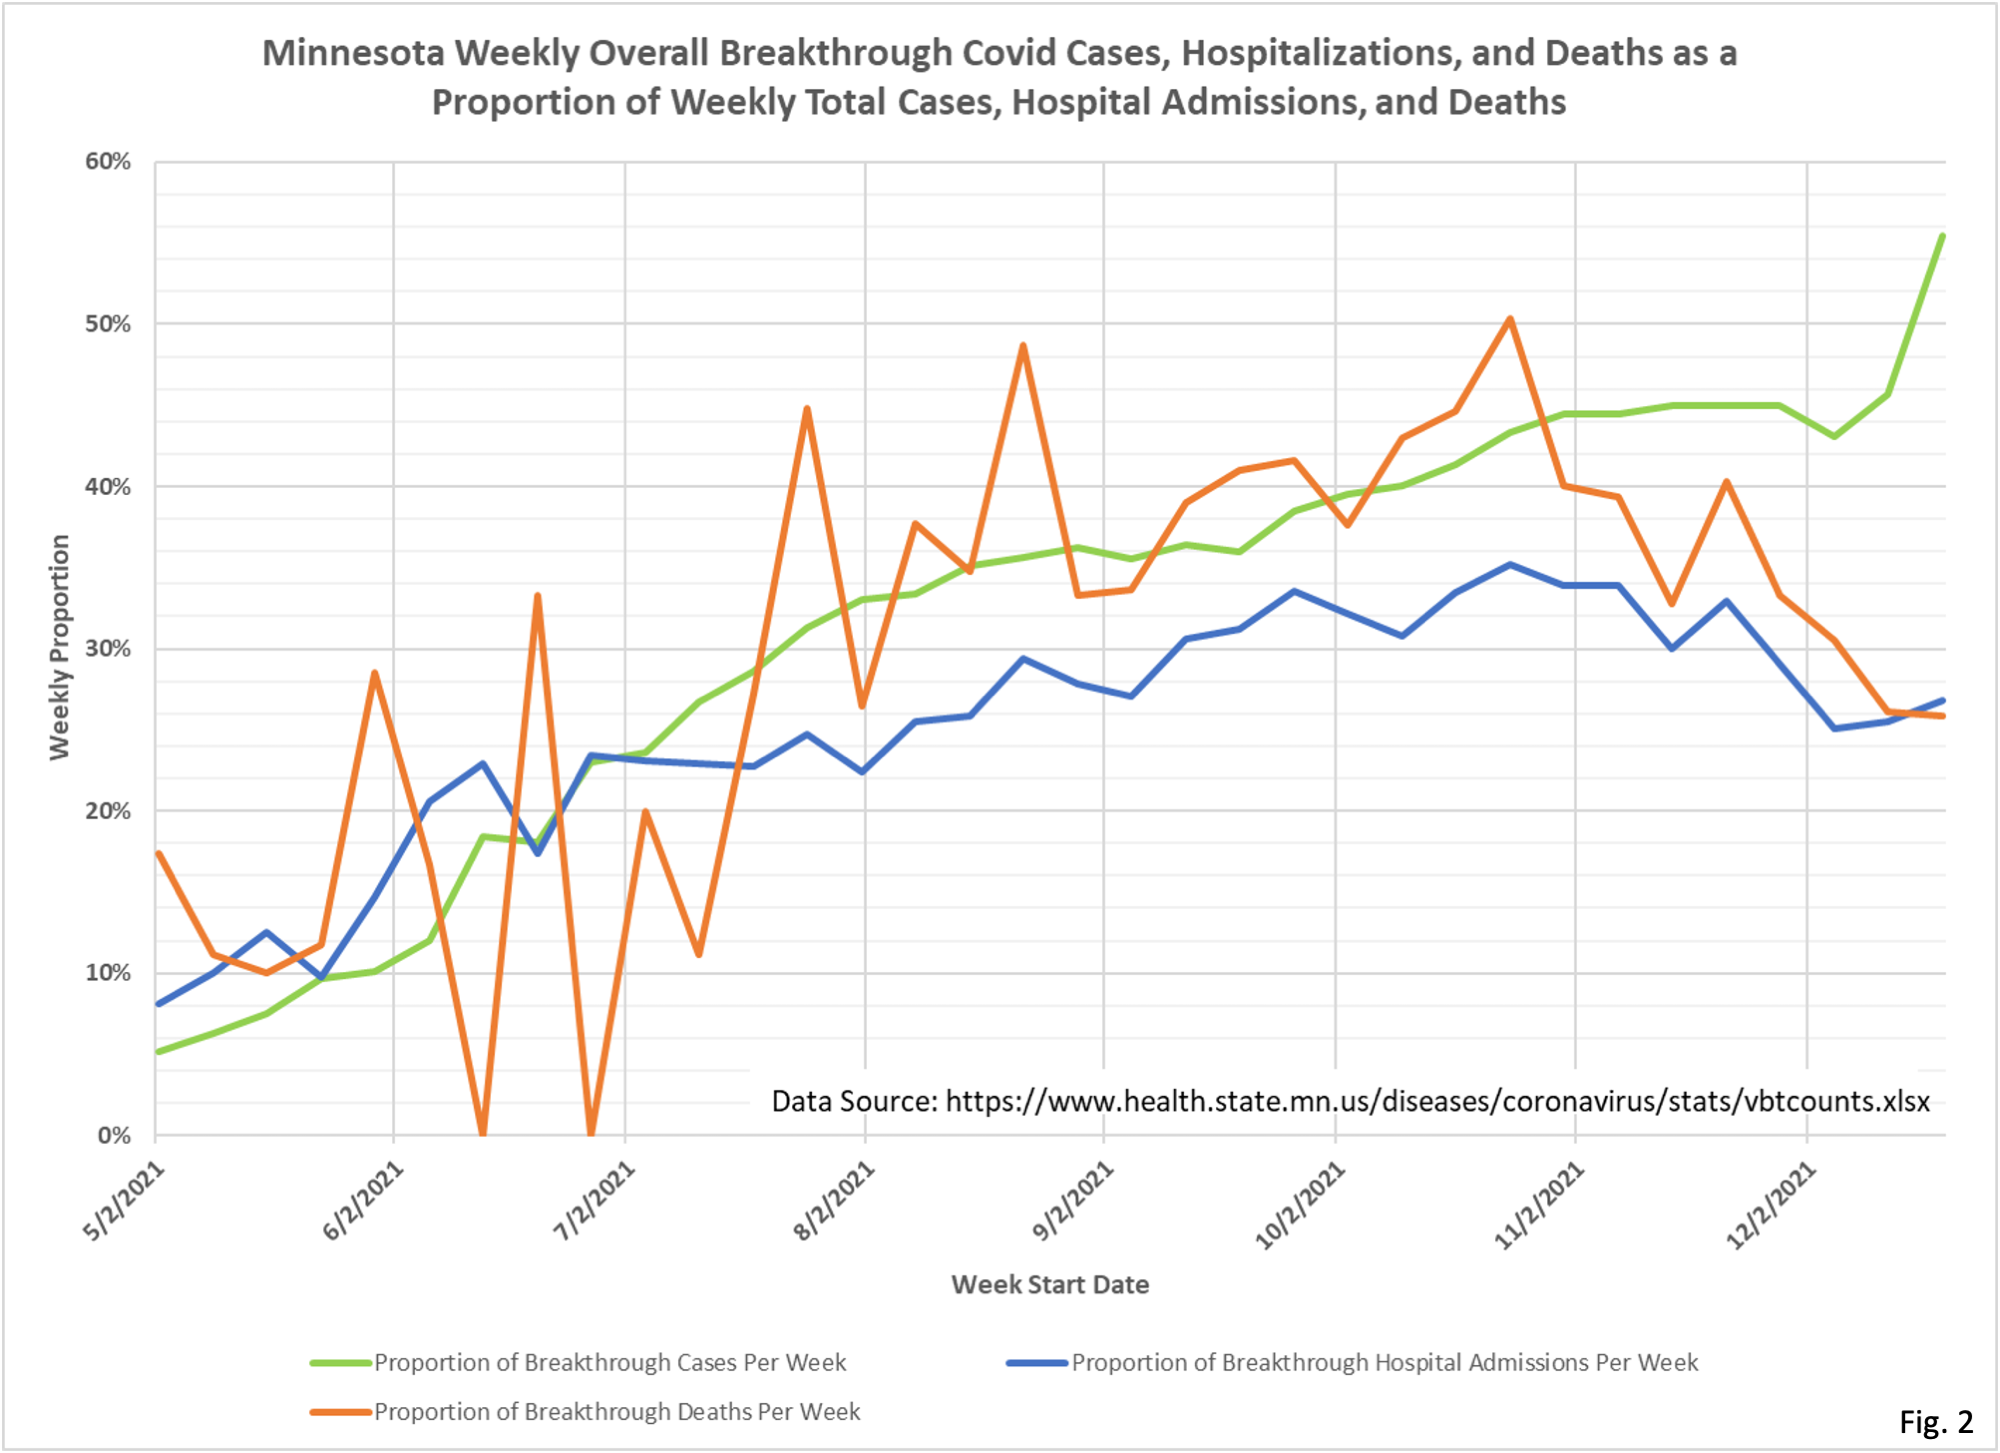
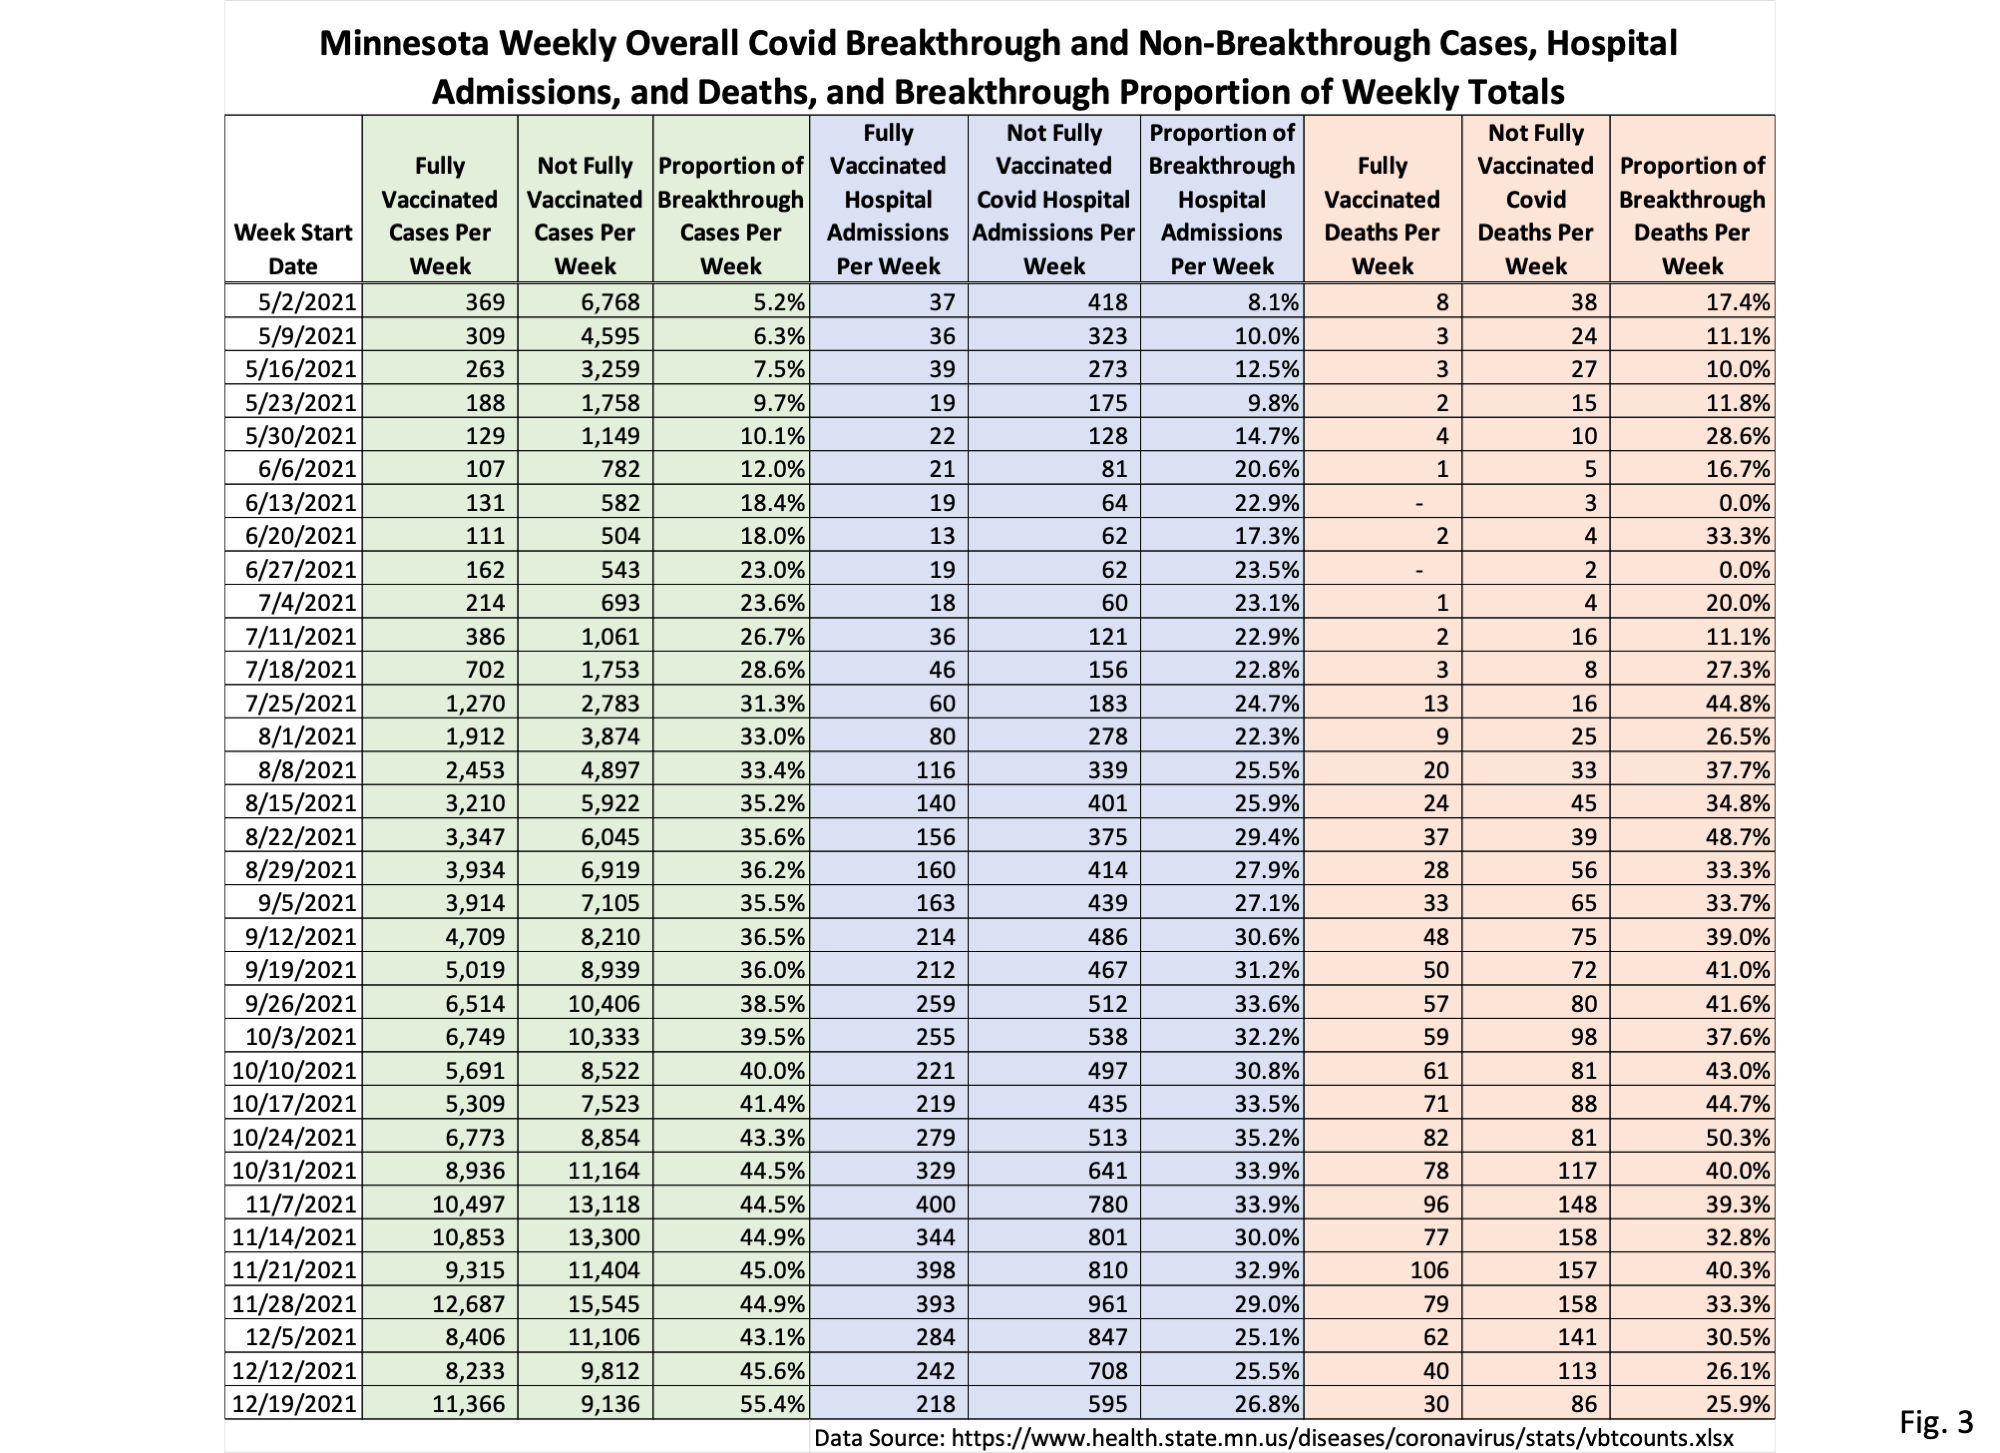
- The data source for Fig. 2 and Fig. 3 is the data file https://www.health.state.mn.us/diseases/coronavirus/stats/vbtcounts.xlsx found on MDH web page https://www.health.state.mn.us/diseases/coronavirus/stats/vbt.html. The data provided in the data file vbtcounts.xlsx is used without modification, other than to sum the weekly events and compute the breakthrough proportion. Vbtcounts.xlsx provides breakthrough and non-breakthrough cases, hospital admissions, and deaths for each week listed.
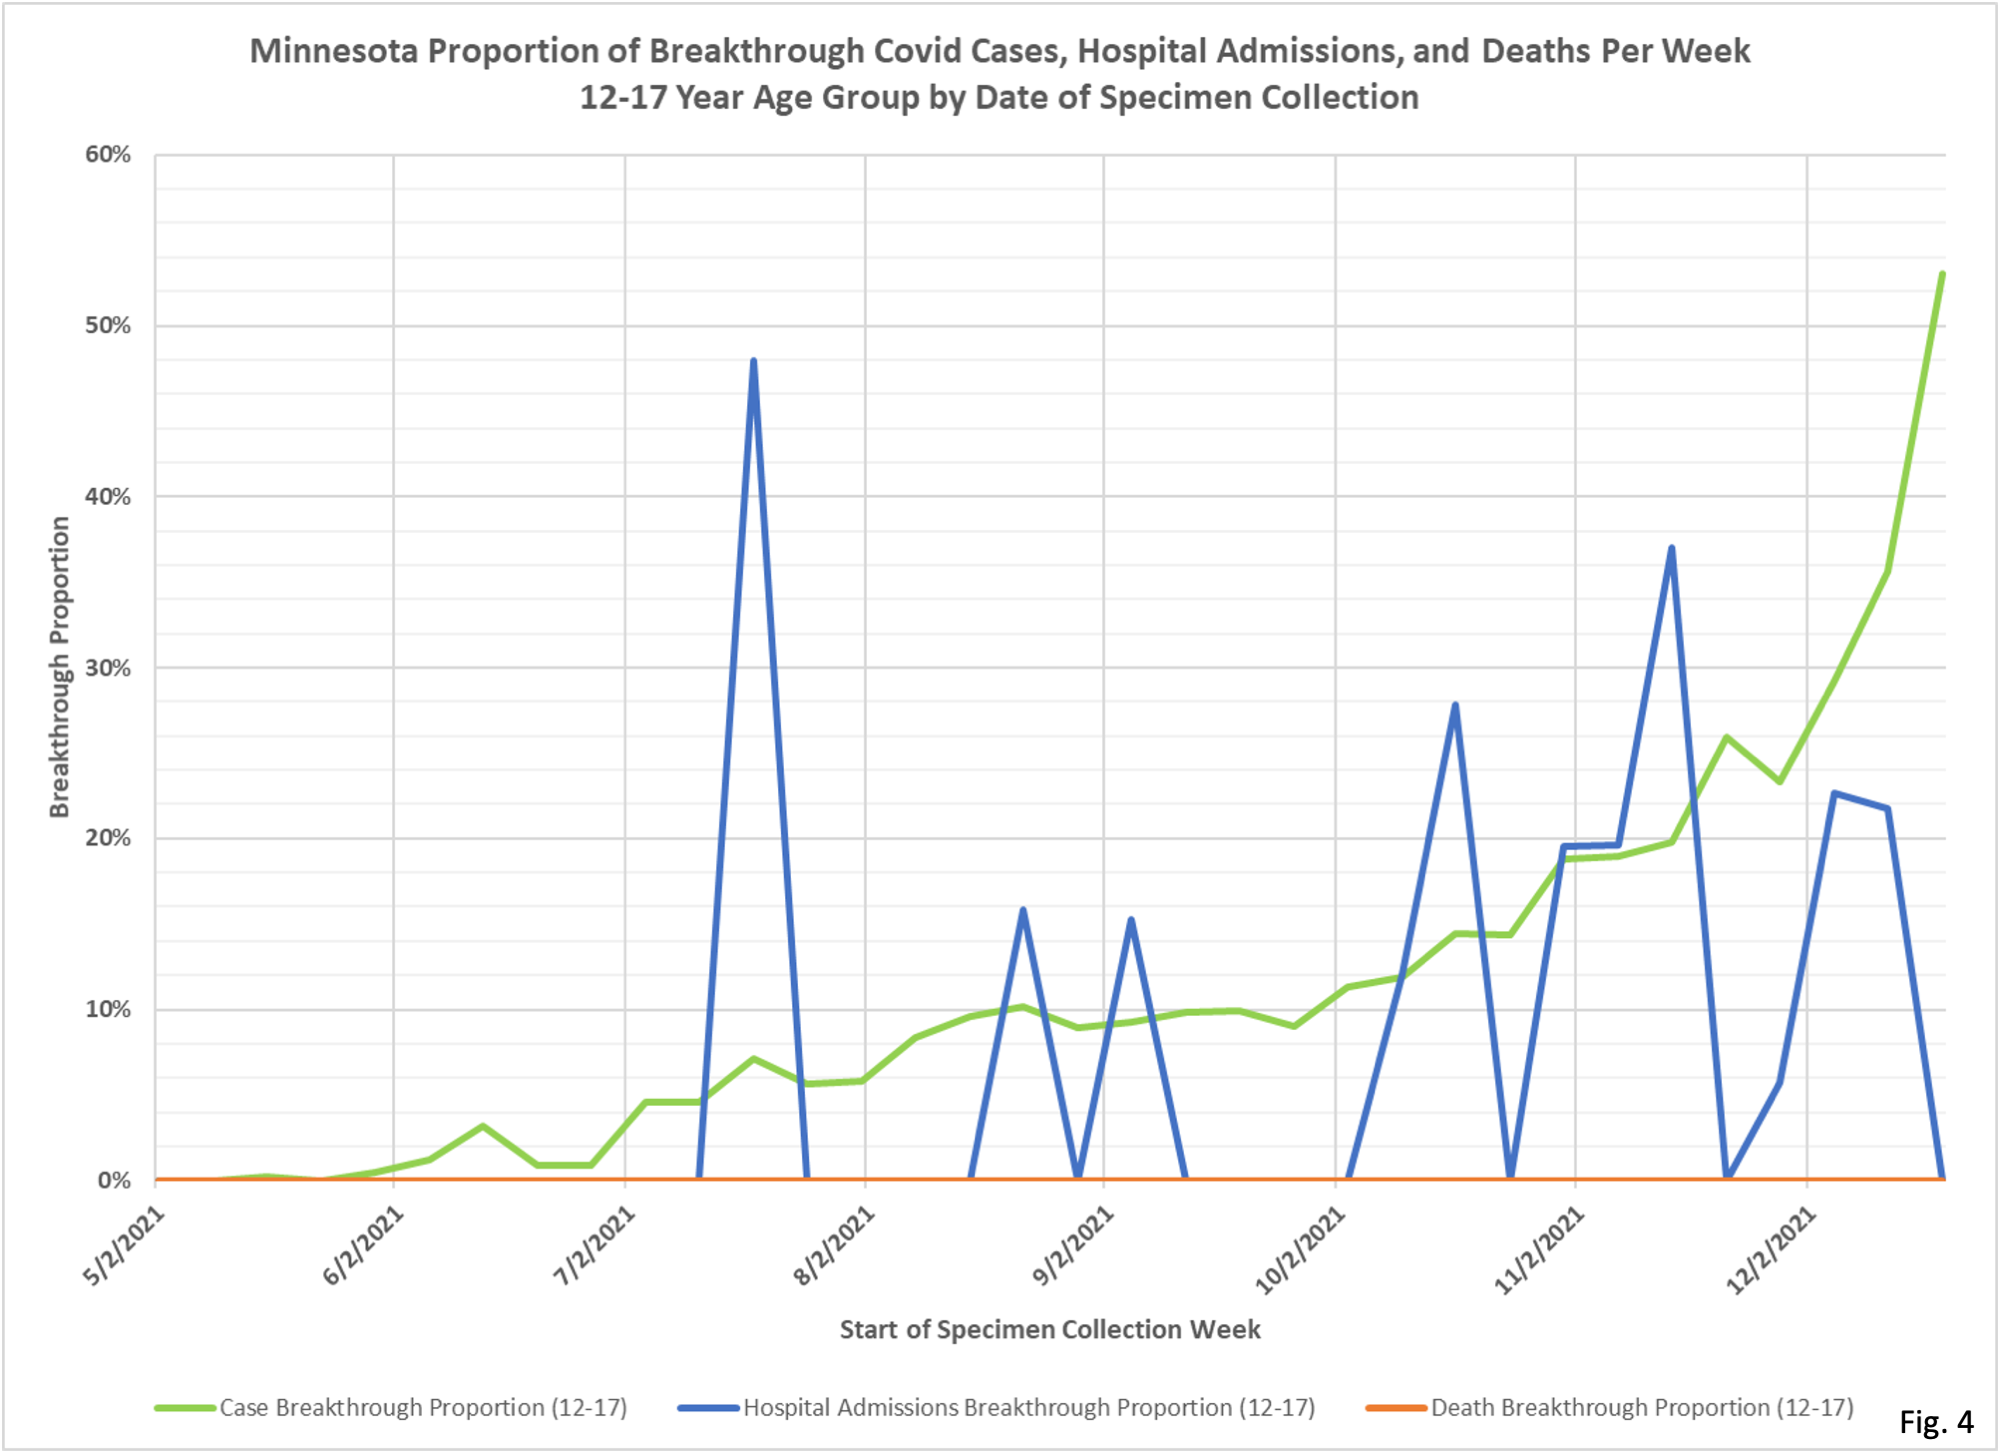
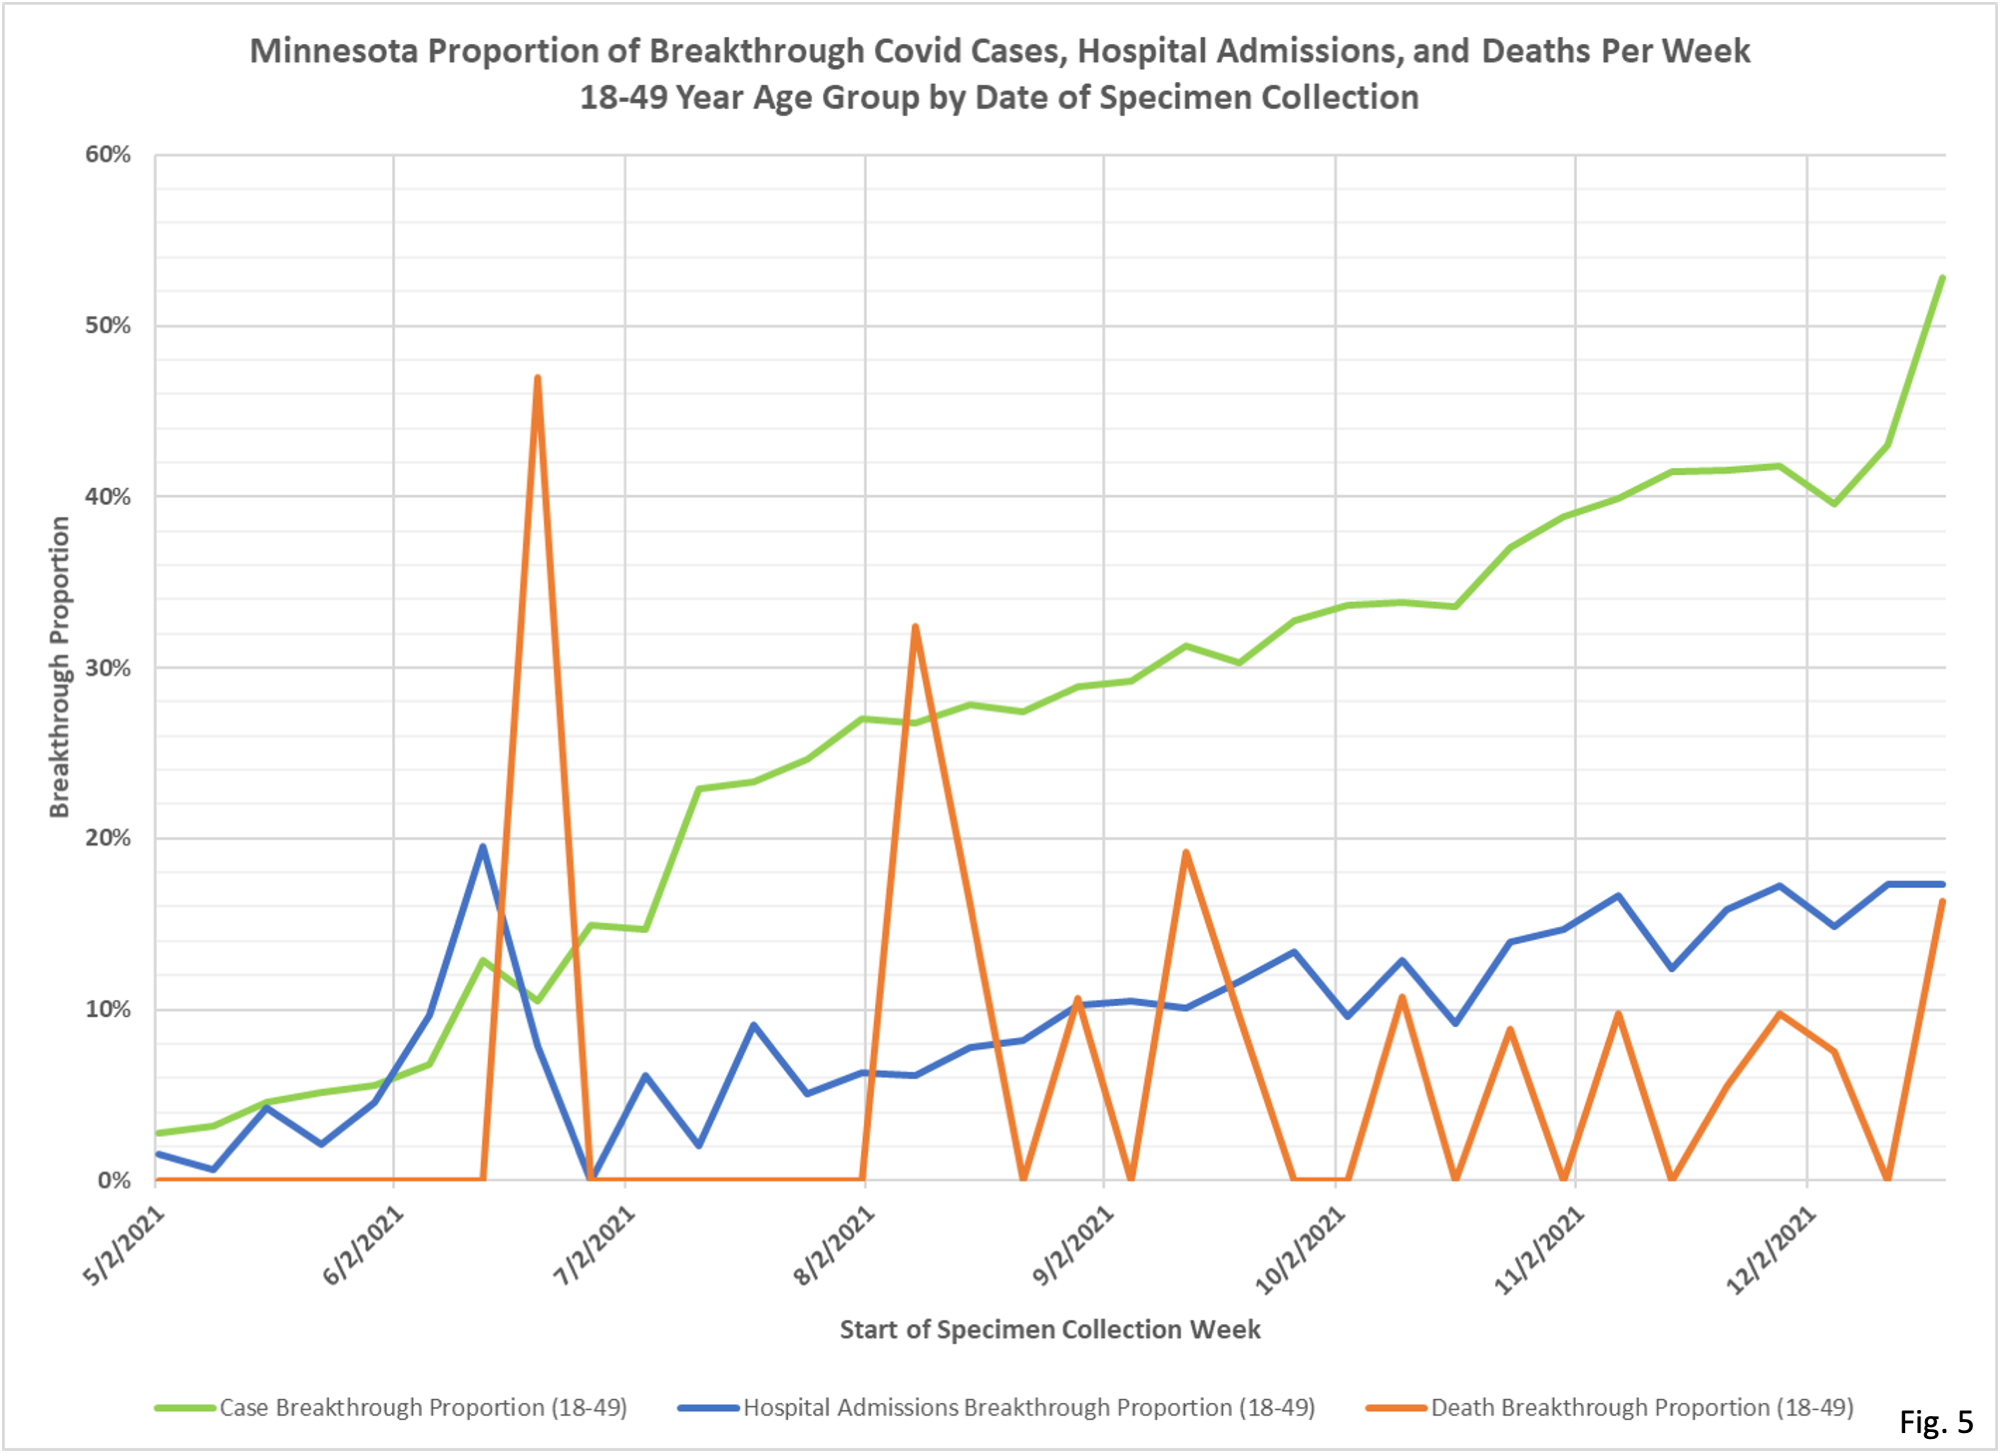
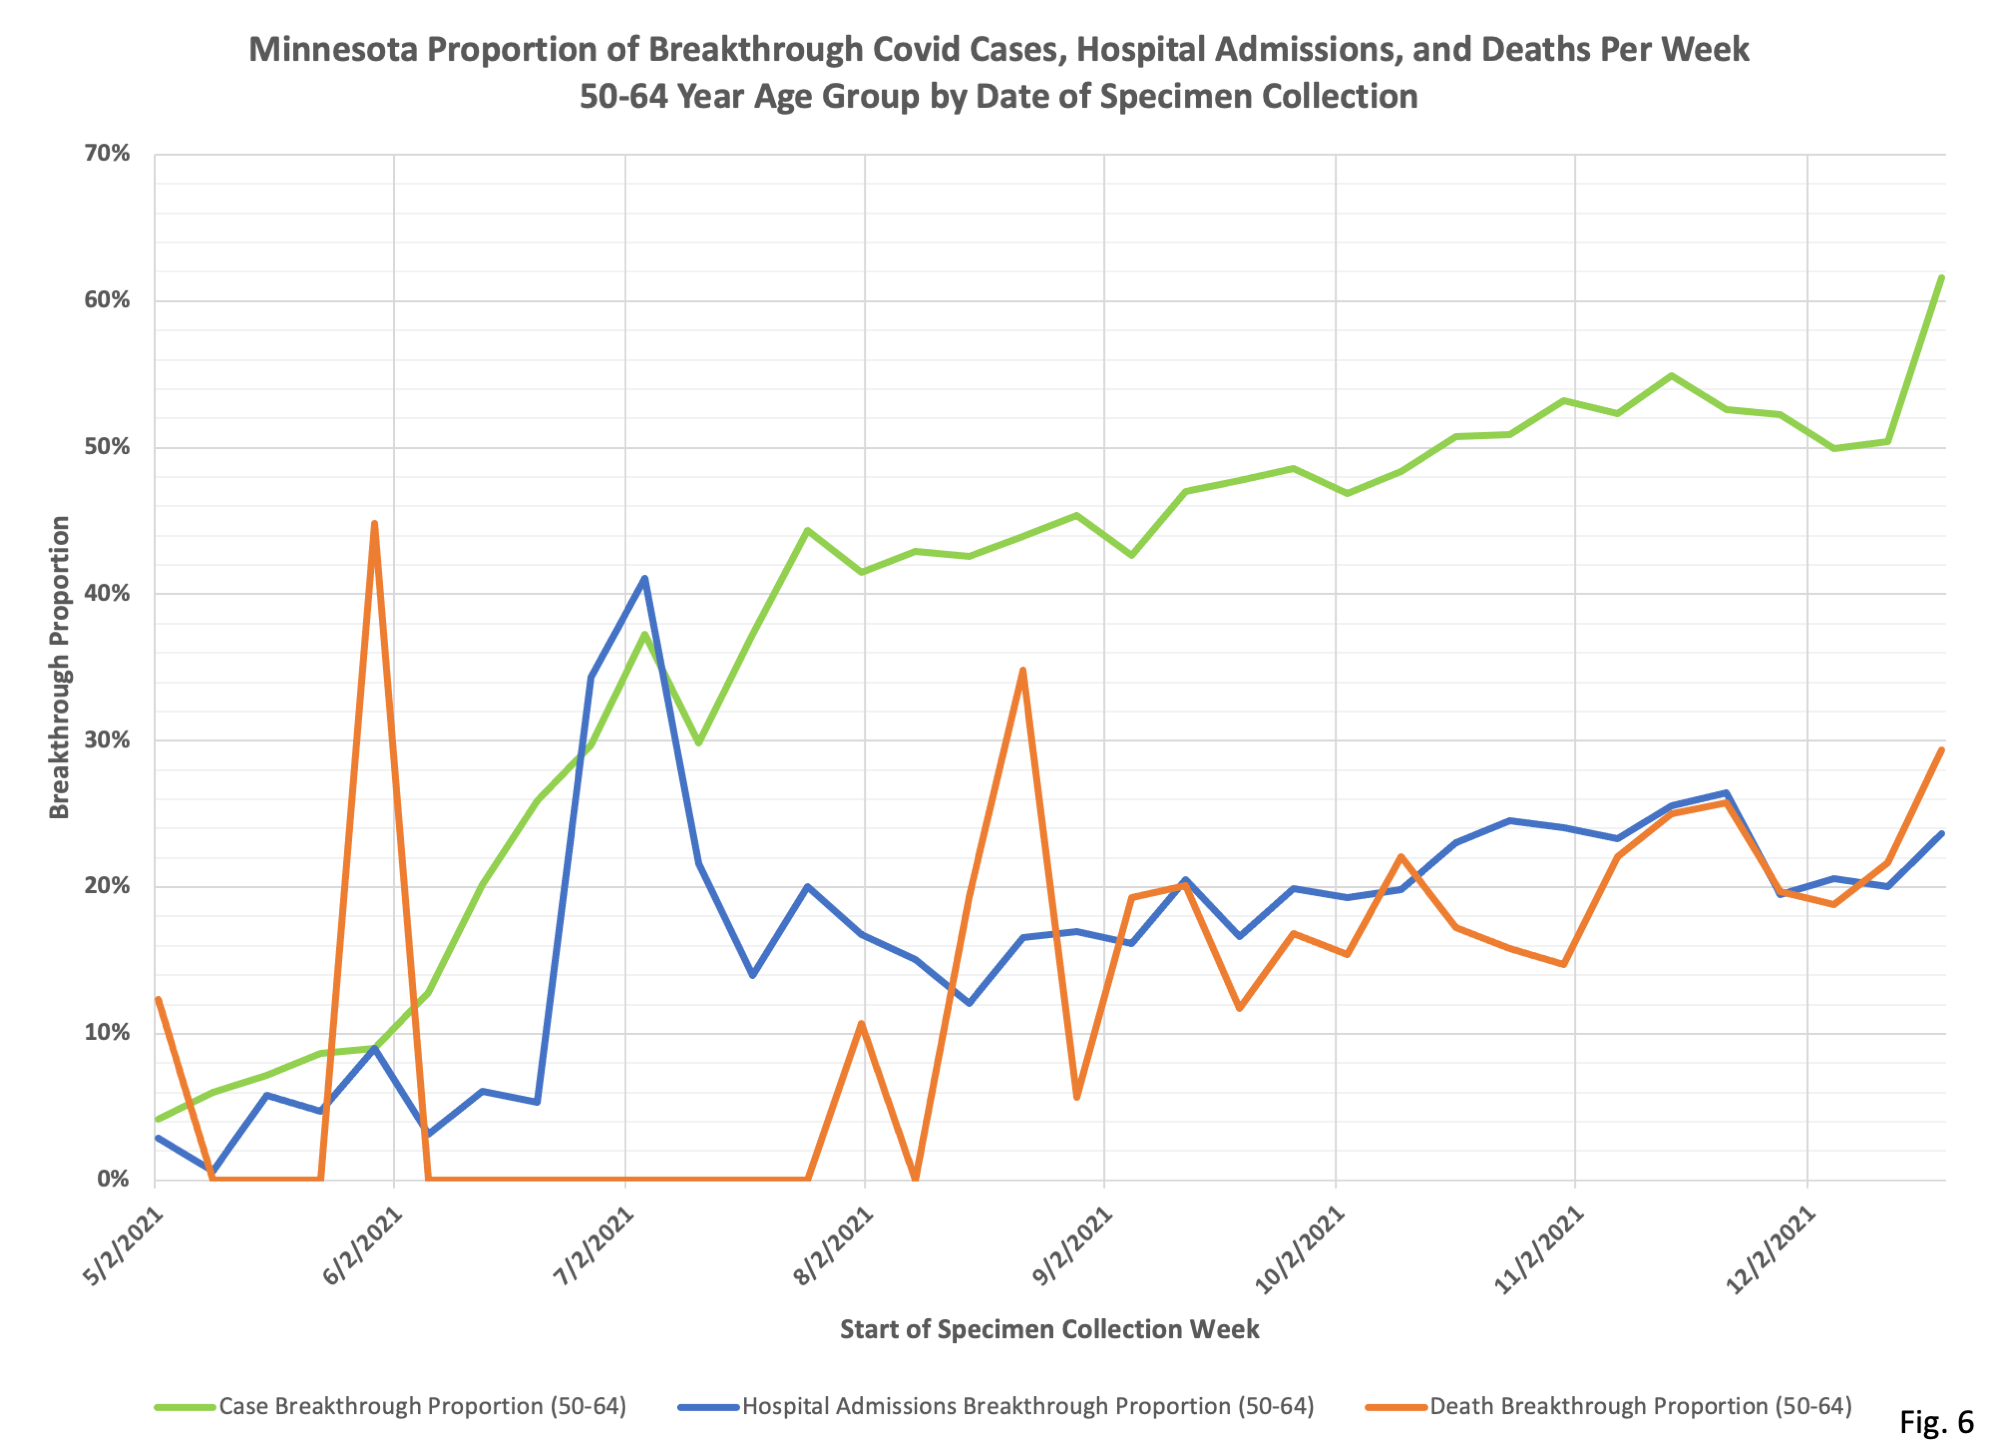
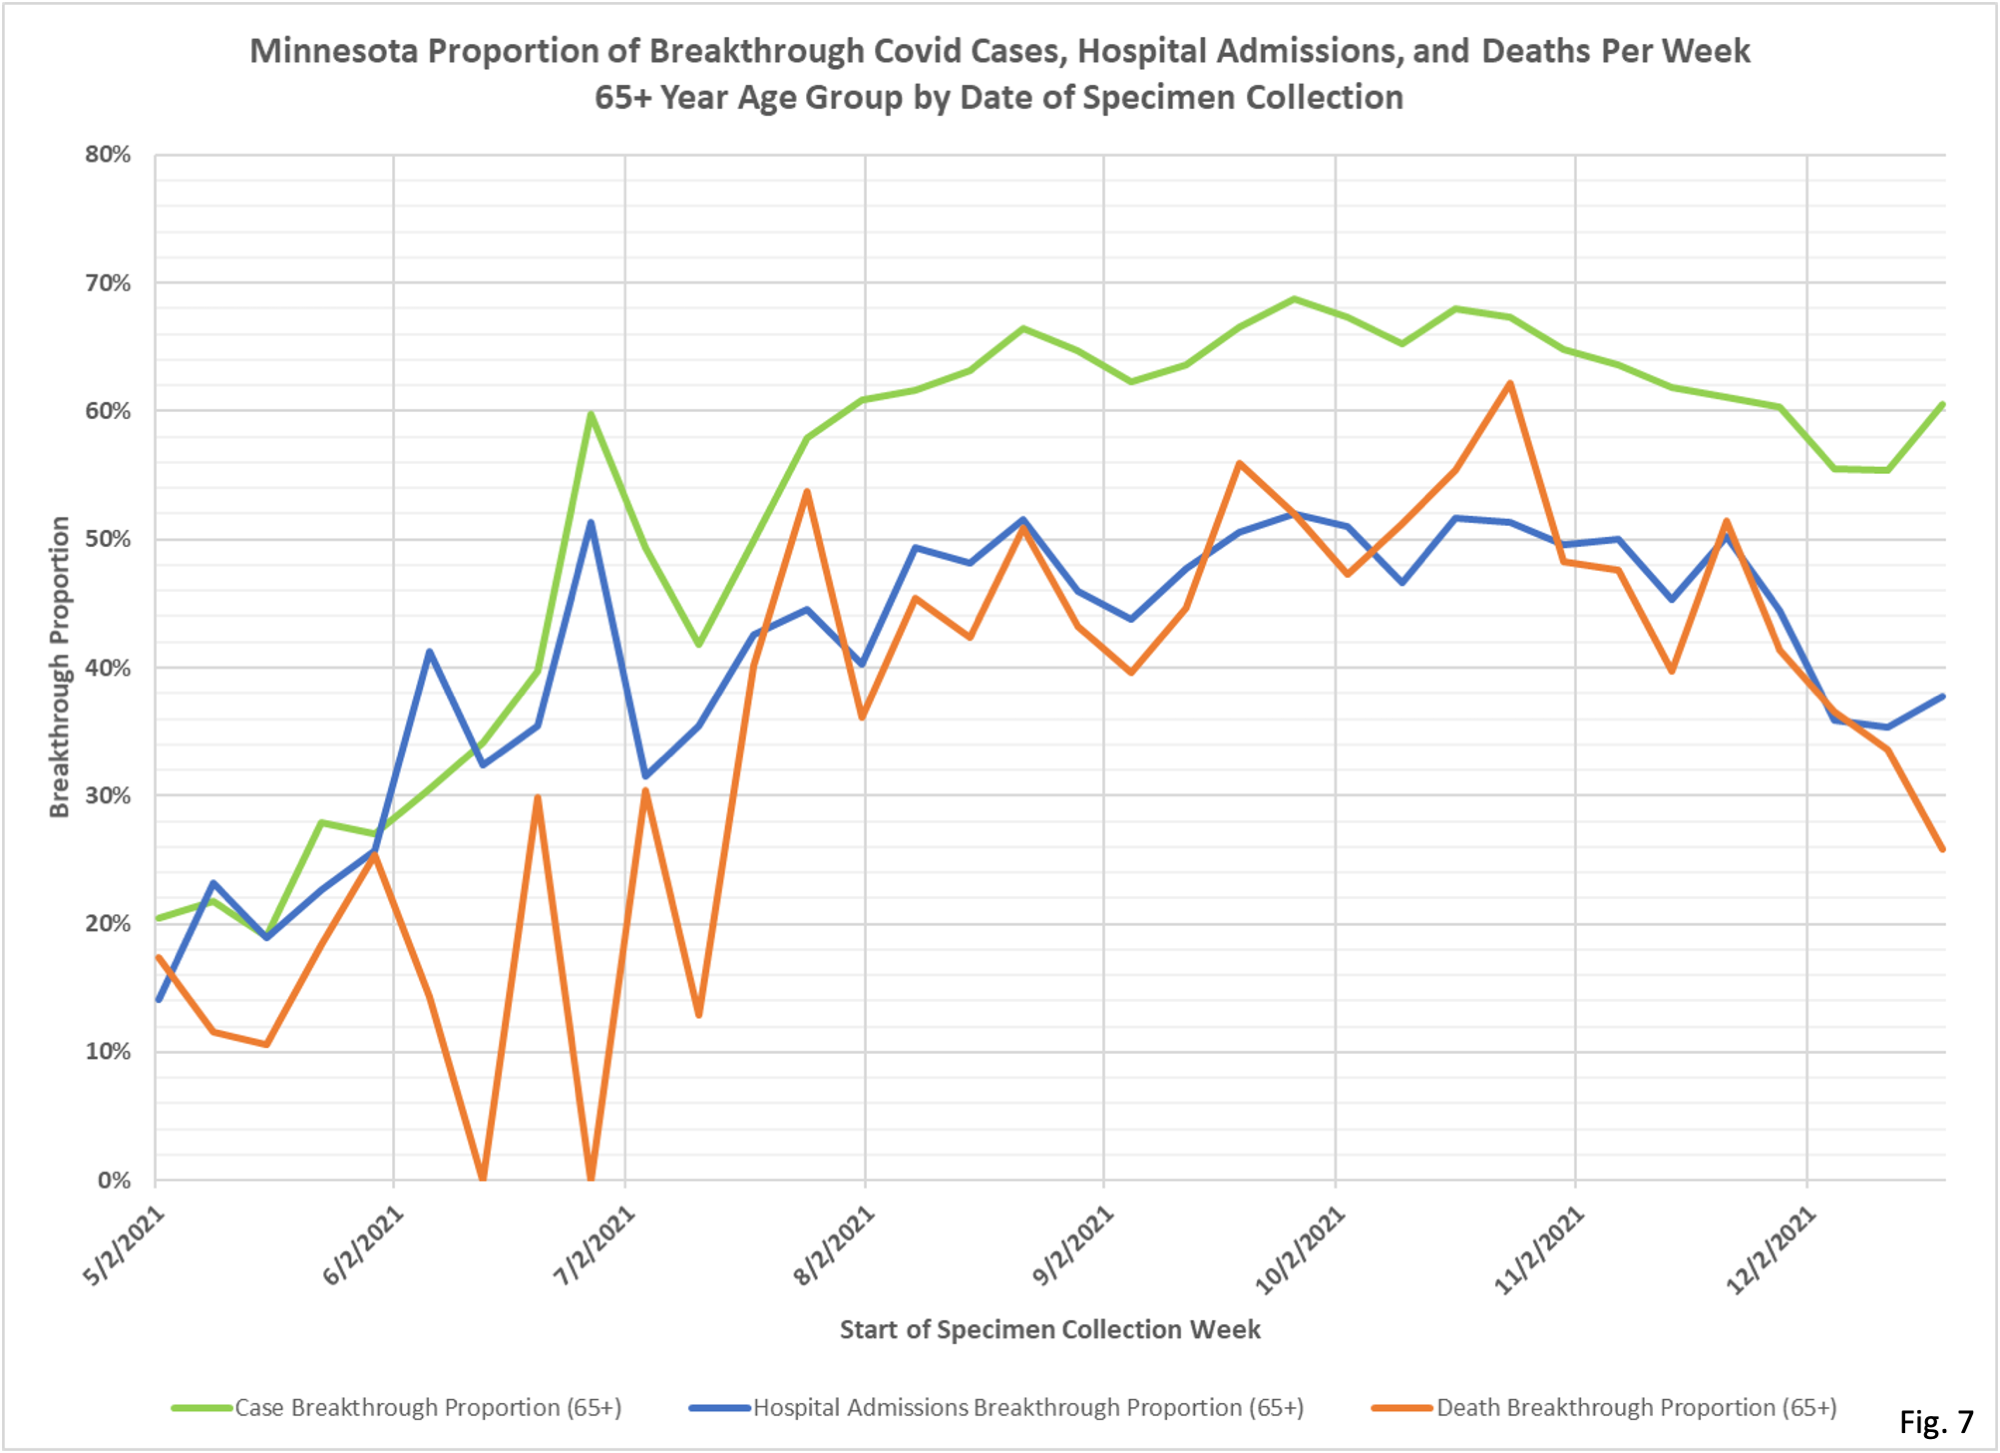
- The data source for the breakthrough proportions by age group (Fig. 4 through Fig. 7) is the data file vbtcirates.xlsx, found on the Minnesota Department of Health (MDH) web page: https://www.health.state.mn.us/diseases/coronavirus/stats/vbtcirates.xlsx . This data file gives the rates per 100k of cases, hospitalizations, and deaths in full vaccinated and not fully vaccinated people, broken out by age group.
- The rates per 100k in vbtcirates.xlsx are converted into cases, hospitalizations, and deaths by multiplying by the appropriate population. The number of vaccinated people by age group can found on the Vaccine Data page, https://mn.gov/covid19/vaccine/data/index.jsp , in the data file People Vaccinated by Age. The unvaccinated population is found by taking the US Census American Community Survey 5-Year Estimate (Data Table S0101, https://data.census.gov/cedsci/table) and subtracting the vaccinated population. The breakthrough proportion is then found by dividing the breakthrough events by the total of the breakthrough and non-breakthrough weekly events.
- MDH defines a breakthrough event as a Covid case, hospital admission, or death that occurs 14 or more days after completing the vaccination shots (not including boosters). (And just so it is clear, that means they put partly vaxed and unknown status in the unvaxed.)
- Fig 1: New breakthrough cases announced on 1/24/2022 total 36,954, a new record for breakthrough cases for the second week in a row.. The newly reported breakthrough hospitalizations of 681 are also a new record for the second week in a row.
- Fig. 2 and Fig. 3, Overall Breakthrough Proportions: Breakthrough cases surged to the highest level seen, at 55.4% for the week starting 12/19/2021. This would have been the period of time where the Omicron variant was becoming prevalent in Minnesota. The proportion of breakthrough hospitalizations only rose slightly to 26.8% of all hospitalizations, while breakthrough deaths fell to 25.9%, the lowest proportion seen since July, 2021.
- Fig. 4 through Fig. 7: Breakthrough Proportions by Age Group: The breakthrough proportion of cases by age has surged higher, with all groups having a breakthrough proportion above 50% for the week of 12/19/2021.

I am curious about the accuracy of the # of deaths of the unvaxed vs the number of deaths of the vaxed.
During the Nov/Dec/Jan/ 2020/2021 time frame (effectively all pre vax ), the MN death rate was ranged from 1.0-1.3 daily deaths per 100k.
About 85% of the deaths are in the age group 65+ which has a vax rate of about 85%-90%.
The current ratio of deaths between the vaxed vs unvaxed is approx 1/3 vs 2/3
Based on those numbers, the death rate for the unvaxed is currently running around 1.5 to 2.0 per 100k. (possibly as high as 2.5 per 100K)
The point of my question is that current death rate is significantly higher than would be expected which gives me the impression that a lot of deaths are misclassifed as being unvaxed.
another way of stating – is the pool of unvaxed seems to small to have such a high death count attributed to the unvaxed population
Thoughts?
Good Morning Kevin
This would mirror my small subset of clients all being infected after vaccination, “partial” vaccination (Which is now 3 shots?) and yet the stupidity carries on. The over 60 crowd is still coming in with all variety of mask nonsense upon their lips. “Could you put a mask on?” As they take theirs off. “Could you wear a mask, I’m heading out of town and want to be careful.” Never even considering that in the same instance in which THEY want THEIR hair done, so do all the people before them and after them who are…if you really think about it, potential vectors. It boggles the mind. No one thinks to themselves, “Now if I really don’t want to be infected, perhaps I should just stay home?” Nope. I’m certain that as this all evolves, person A is going to double down on the belief that their personal health resides with person B and that if only person B was more responsible, person A wouldn’t get sick….
The mask has helped to create MONSTERS in our beloved country and I am so so so tired of it.
More ‘shot’ treachery.
l was at a Park Nicollett Clinic to see a doctor.
He wanted me to get the booster and said they have it and can do it right now.
EXCEPT.
In order to get the booster they required the Passport card and since I didn’t have it with me they refused to give me the booster.
The following day I was at the Mayo in Rochester to see a doctor.
I ask about getting the booster and they wouldn’t do it.
They required the patient to get an appointment for a special location.
In Fig. 3 “Not Fully Vaccinated Covid Deaths Per Week” , do we know the definition of Not Fully Vaccinated? Does this mean a person with 2 shots or 2 shots and a booster? Also guessing person WITH Covid vs FROM Covid isn’t filtered into those Not Fully Vaxxed Death #s either?
It is supposedly the full original regimen, not boosters. But unvaxed includes partly vaxed and unknown status and that is potentially a lot of people and cases