Based on a file Dave is getting from DOH, we continue to look closely at relative case rates of hospitalization and death among the vaxed and the unvaxed. A few preliminary comments. These are case rates, if you have a confirmed infection, how likely are you to be hospitalized or die. The rates obviously can be seriously impacted by a number of things, like whether or not there are more undetected cases in the vaxed or unvaxed and whether rates of prior infection are different in the two groups. So these rates may overstate or understate relative case rates. It is pretty clear that if you are older, you want to be vaxed if you get infected. Dave’s notes:
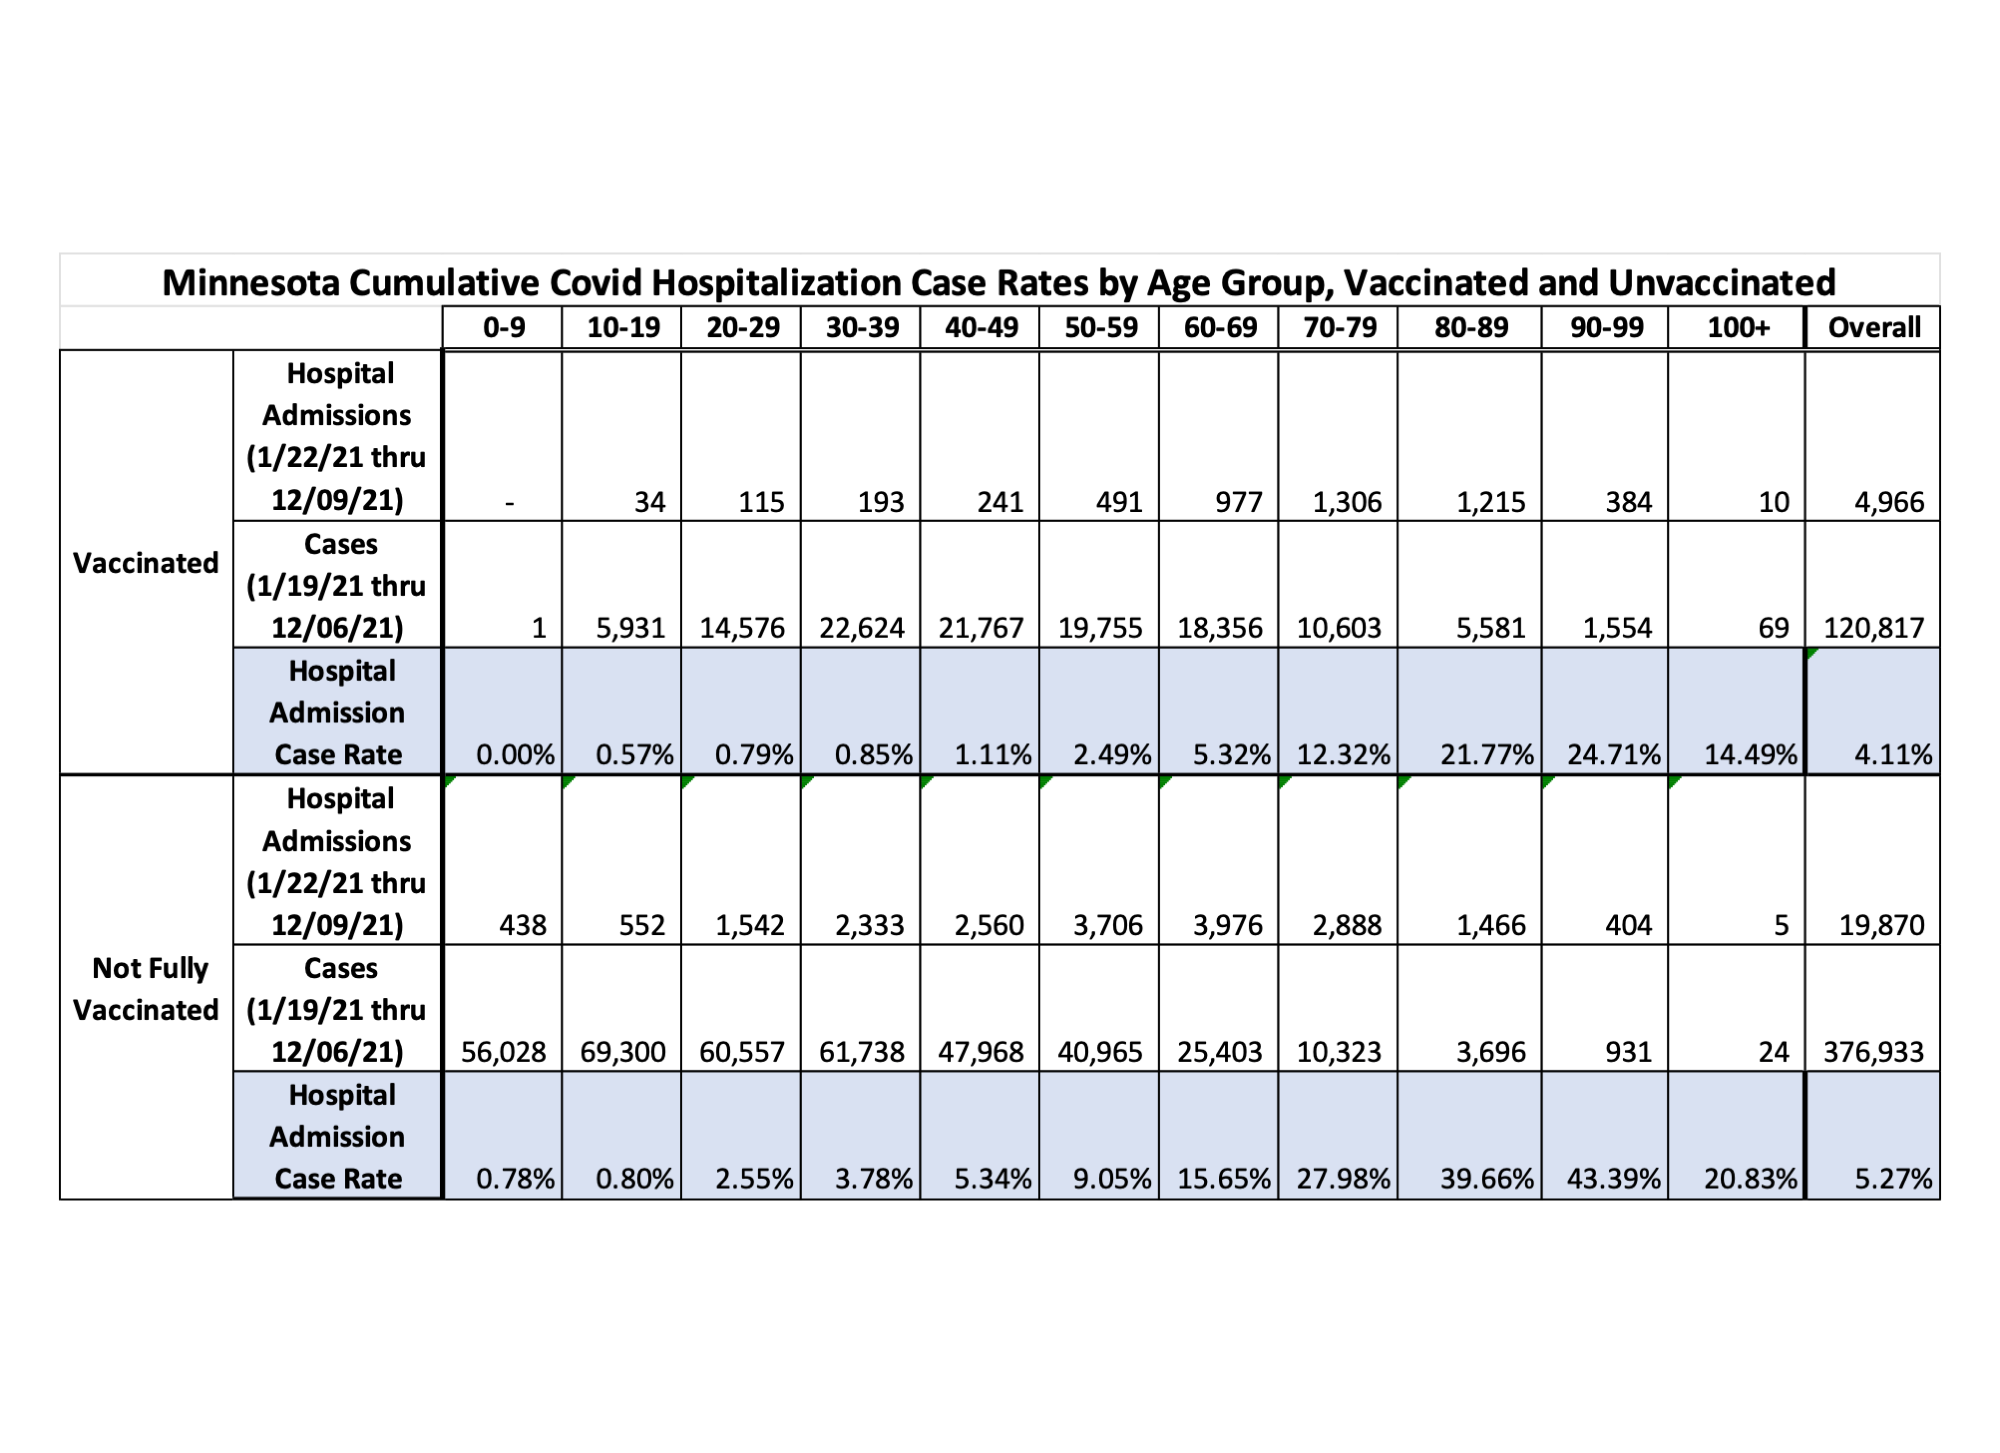
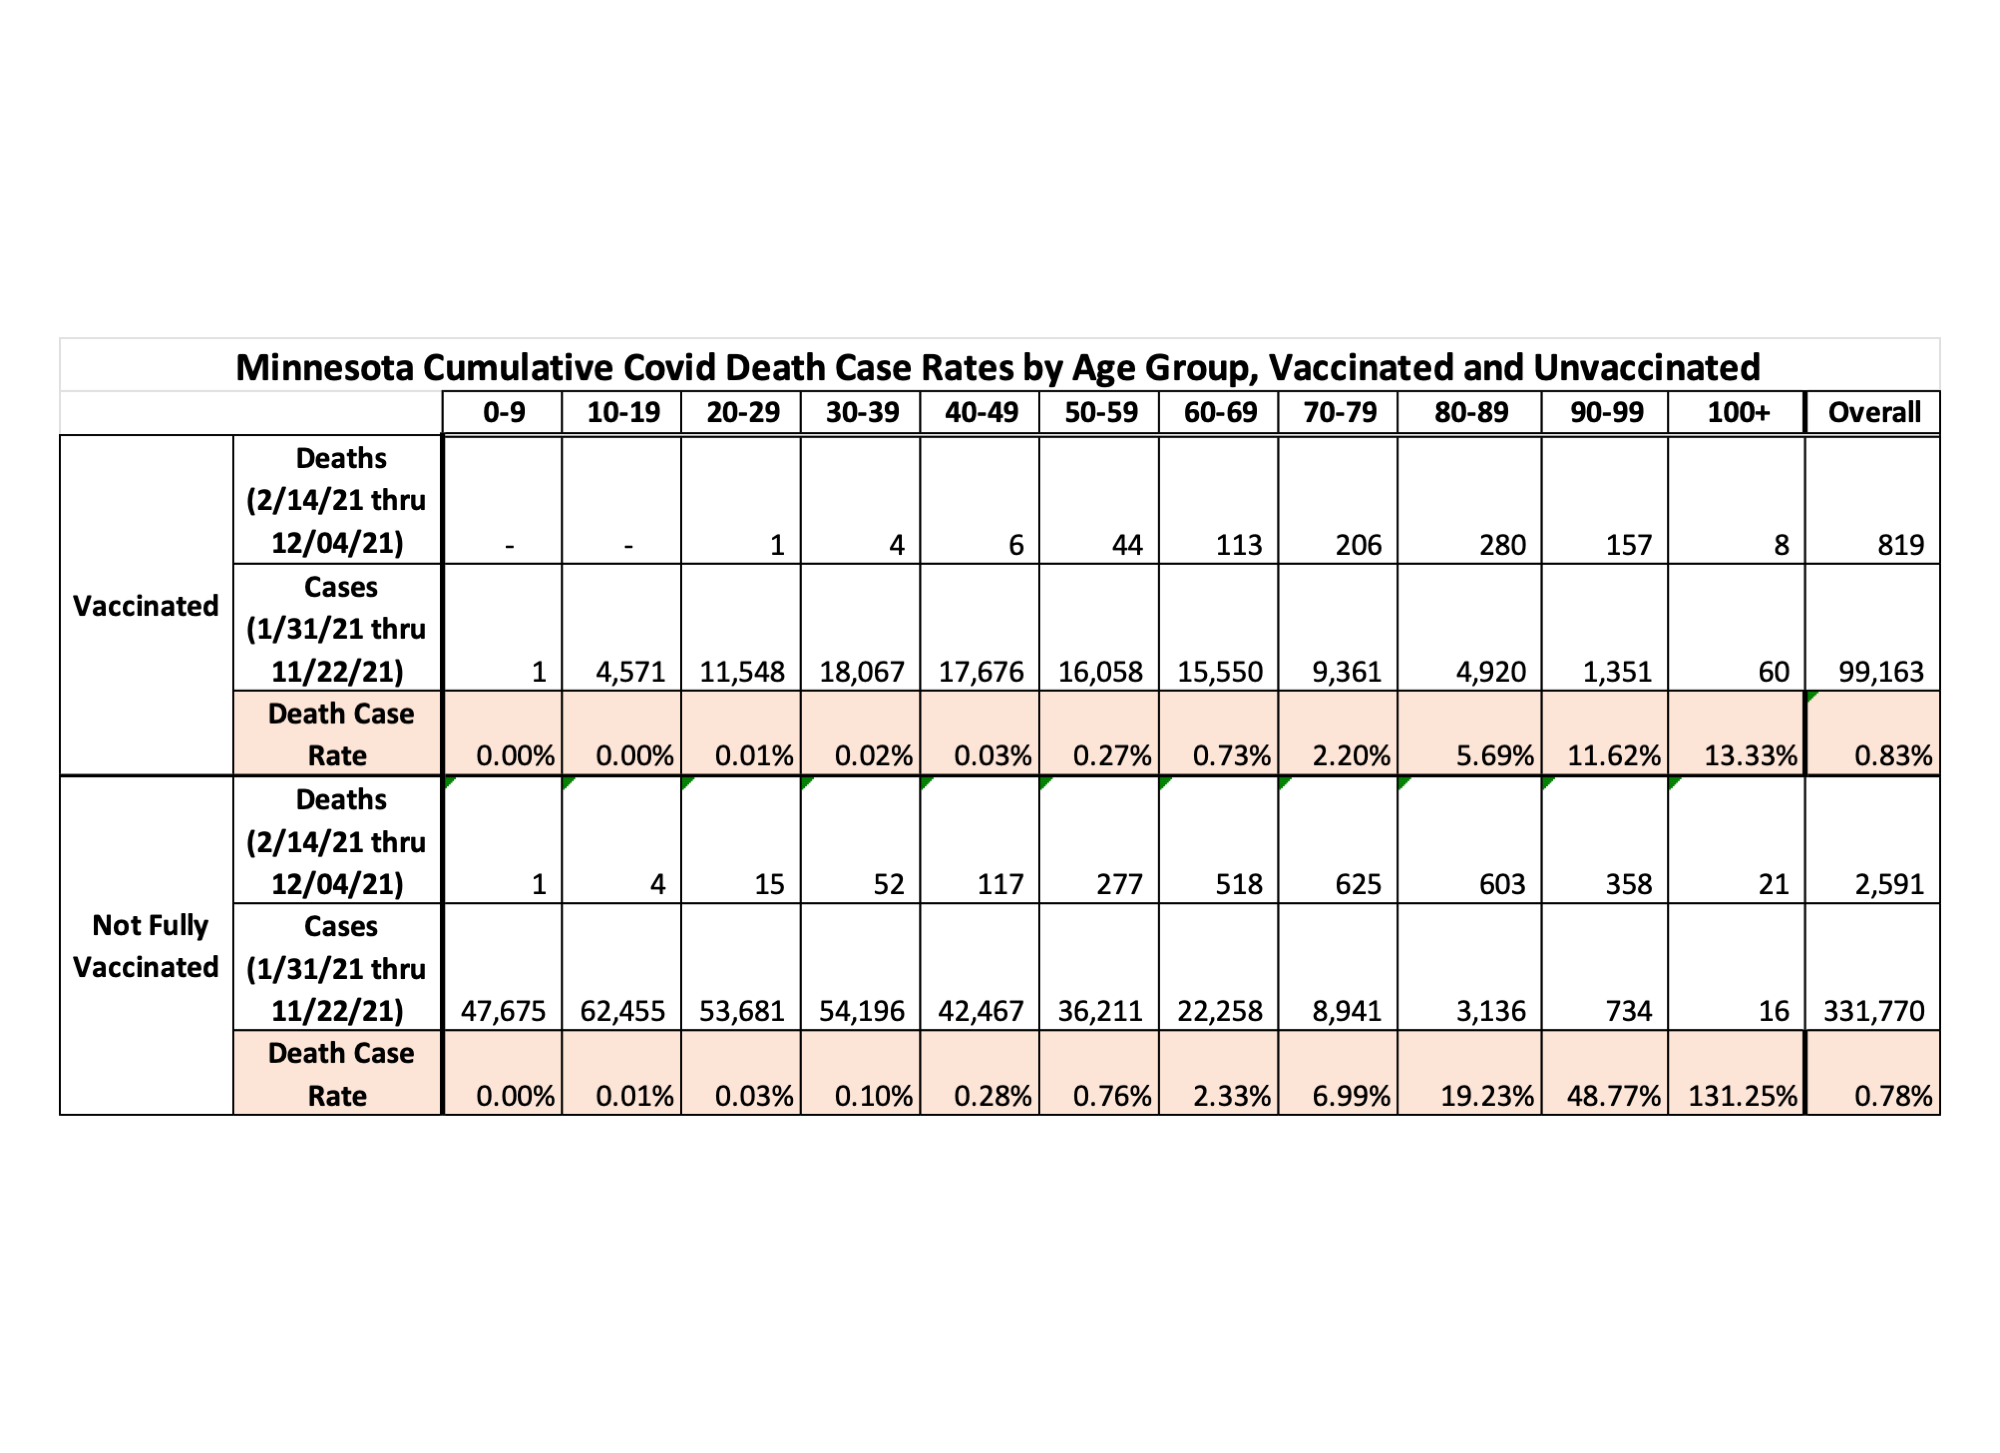
- The table and charts below display the Covid hospital admissions case rates, and Covid death case rates, for Minnesota sorted by 10-year age groups. The case rates are simply the percentage of those who test positive for Covid and go on to be admitted to a hospital or to die. These are cumulative rates over the course of the pandemic, over the time period for specimen collection dates of cases from 1/22/2021 to 12/09/2021 for hospital admissions, and from 1/31/2021 to 11/22/2021 for deaths. These date ranges were selected in order to cover the time period during which there were breakthrough events reported, and during which there is a reasonable likelihood that admissions or deaths would be reported, as described more fully below. Choosing different time periods for the analysis would generate different results of the analysis.
- These tables and charts are an update of the data tables for this data last published on 12/06/2021 here: https://healthy-skeptic.com/
2021/12/09/vax-unvaxed-case- rates-december-6/. - On 10/28/2021 we had requested that the Minnesota Department of Health (MDH) provide us, under the Minnesota Data Practices Act (https://www.health.state.mn.
us/data/datapractices/index. html), information regarding Minnesota’s breakthrough Covid cases (breakthrough cases being defined as someone who tests positive for Covid 14 or more days after completing their vaccination series). Specifically, for each breakthrough case, we asked that MDH provide us the date of specimen collection, the date of hospital admission, the date of death, and the age of each individual. This Data Practices Act request (ID No. 21-211) was separate from a much more comprehensive request submitted some weeks ago, and we hoped that perhaps a simple, more focused request might be acted upon. On Wednesday, Nov. 10, 2021 MDH provided an Excel spreadsheet containing information about 57,023 breakthroughs cases. The data provided was the date of specimen collection, the age of the individual, and Yes/No flags for whether the case was hospitalized or had died. We were not given the date of hospitalization or death, and we followed up with a request for these dates as well. - On 1/14/2022 MDH provided an updated version of the same data file originally provided on 11/10/2021, in response to a request for updated information. This new data file contains the specimen collection date, age, and yes/no flags for hospitalization and death for 162.830 breakthrough Covid cases, identical to the data provided in the original data file. As of 1/10/2022, MDH’s Vaccine Breakthrough Report web page https://www.health.state.mn.
us/diseases/coronavirus/stats/ vbt.html reports a total of 162,831 cumulative breakthrough cases, one breakthrough case more than contained in the provided data file. In the provided data file the last row of data is a hospitalization Yes/No flag without an age, date, or death Yes/No flag. - In the new breakthrough data provided by MDH, the earliest breakthrough case is 1/20/2021, and the most recent is 1/02/2022.
- Other than the extending the analysis time period there are no major changes to the analysis, compared to the prior version of this table published on 12/09/2021.
- Because MDH did not provide the dates of hospital admission and death, only yes/no flags, we do not know the exact timing when these events occurred. We have assumed that hospitalization occurs 3 days on average after the specimen collection date of a positive case, and that death occurs on average 14 days after specimen collection date of a positive case. Using assumed time lags rather than actual dates should have minimal impact on the accuracy of the analysis, since we are calculating cumulative totals over the entire time period being analyzed.
- Since the data file provided contains breakthrough cases, hospital admissions, and deaths by age group over a time period, we then need to compare this data to the overall cases, hospitalizations, and deaths by age group over the same time period. The Minnesota Weekly Report (https://www.health.state.mn.
us/diseases/coronavirus/stats/ index.html) provides weekly totals for hospital admissions and deaths by age group. However, this data is based on the date of report, and not when the hospital admission or death actually occurred. For this reason, in order to match actual date of events, we assume that there is a 1 week lag between actual date of hospitalization and appearance in the Minnesota Weekly Report. In addition, we assume there is a 2 week lag between date of death and appearance in the Minnesota Weekly Report. These lags are consistent to the lags that found for data being published on the Minnesota Situation Update web page (https://www.health.state.mn. us/diseases/coronavirus/ situation.html). Because the actual lag between actual hospital admission and death, and publication in the Minnesota Weekly Report, is unknown the total hospital admissions and deaths, and therefore the unvaccinated hospital admissions and deaths, may be different than the totals appearing in the table below. Since the only age group data we have for hospital admissions and deaths is based on date of report we have no way around this source of error currently. - The Not Fully Vaccinated Hospital Admission Case Rate is calculated as the number of non-breakthrough hospital admissions divided by the number of non-breakthrough cases, resulting in the percentage of non-breakthrough cases that are hospitalized. Non-breakthrough hospital admissions are found by taking the total hospital admissions (computed by taking differences between successive cumulative totals from the Minnesota Weekly Report https://www.health.state.mn.
us/diseases/coronavirus/stats/ index.html ) minus the breakthrough hospital admissions computed for the time period. We have determined in other analysis that there is an average lag of 1 week between hospitalization and reporting in the MDH data files and reports. Non-breakthrough cases are found by computing the total cases by age group from the data file wagscd.csv published on https://www.health.state.mn. us/diseases/coronavirus/stats/ index.html#wagscd1 and subtracting the breakthrough cases described above. - The death case rates are found by a similar process to that used to find the hospital case rates, but using a 2 week assumed lag from date of death to reporting in the Minnesota Weekly Report.
- Potential sources of error: It is likely that there are people who may have contracted a mild enough Covid infection that they did not seek medical attention or get tested, causing an undercount of the true number of breakthrough infections. We know that there are likely to be breakthrough cases that have not been identified by MDH, because the vaccination occurred out of state, by the VA, or by a Native American medical facility. In response to a query to MDH on 9/23/2021 we were informed that MDH has access to vaccination records of Minnesotans vaccinated in Iowa, Wisconsin, and North Dakota if they gave the provided a Minnesota address. MDH does not have access to vaccination records in any other state. MDH does not have access to Veterans Administration vaccination records, and only partial or limited access to Tribal health organizations vaccination records. We are unsure how complete the data matching process is for MDH even for the vaccination records in their possession. We suspect, for example, that on 11/08/2021 that MDH reported additional breakthrough cases as early as 5/02/2021, by examination of the breakthrough case, hospital admission, and death rates associated with the charts and tables on the Vaccine Breakthrough Report web page https://www.health.state.mn.
us/diseases/coronavirus/ situation.html#vbt2 It is reasonable to assume that in the future additional older breakthrough cases will be identified and published. The time period used for the analysis may not have complete breakthrough case reporting. MDH publishes no data on the ages of those given booster shots over time. We are only given the cumulative number of booster shots administered each week day on the Vaccine Data web page (https://mn.gov/covid19/ vaccine/data/index.jsp). We therefore cannot take the effects of booster shots into account in this analysis. - By comparing the Vaccinated and Not Fully Vaccinated Case Rates for each age group we can judge the relative risk between vaccinated and unvaccinated people in each age group, and the relative risks between age groups.
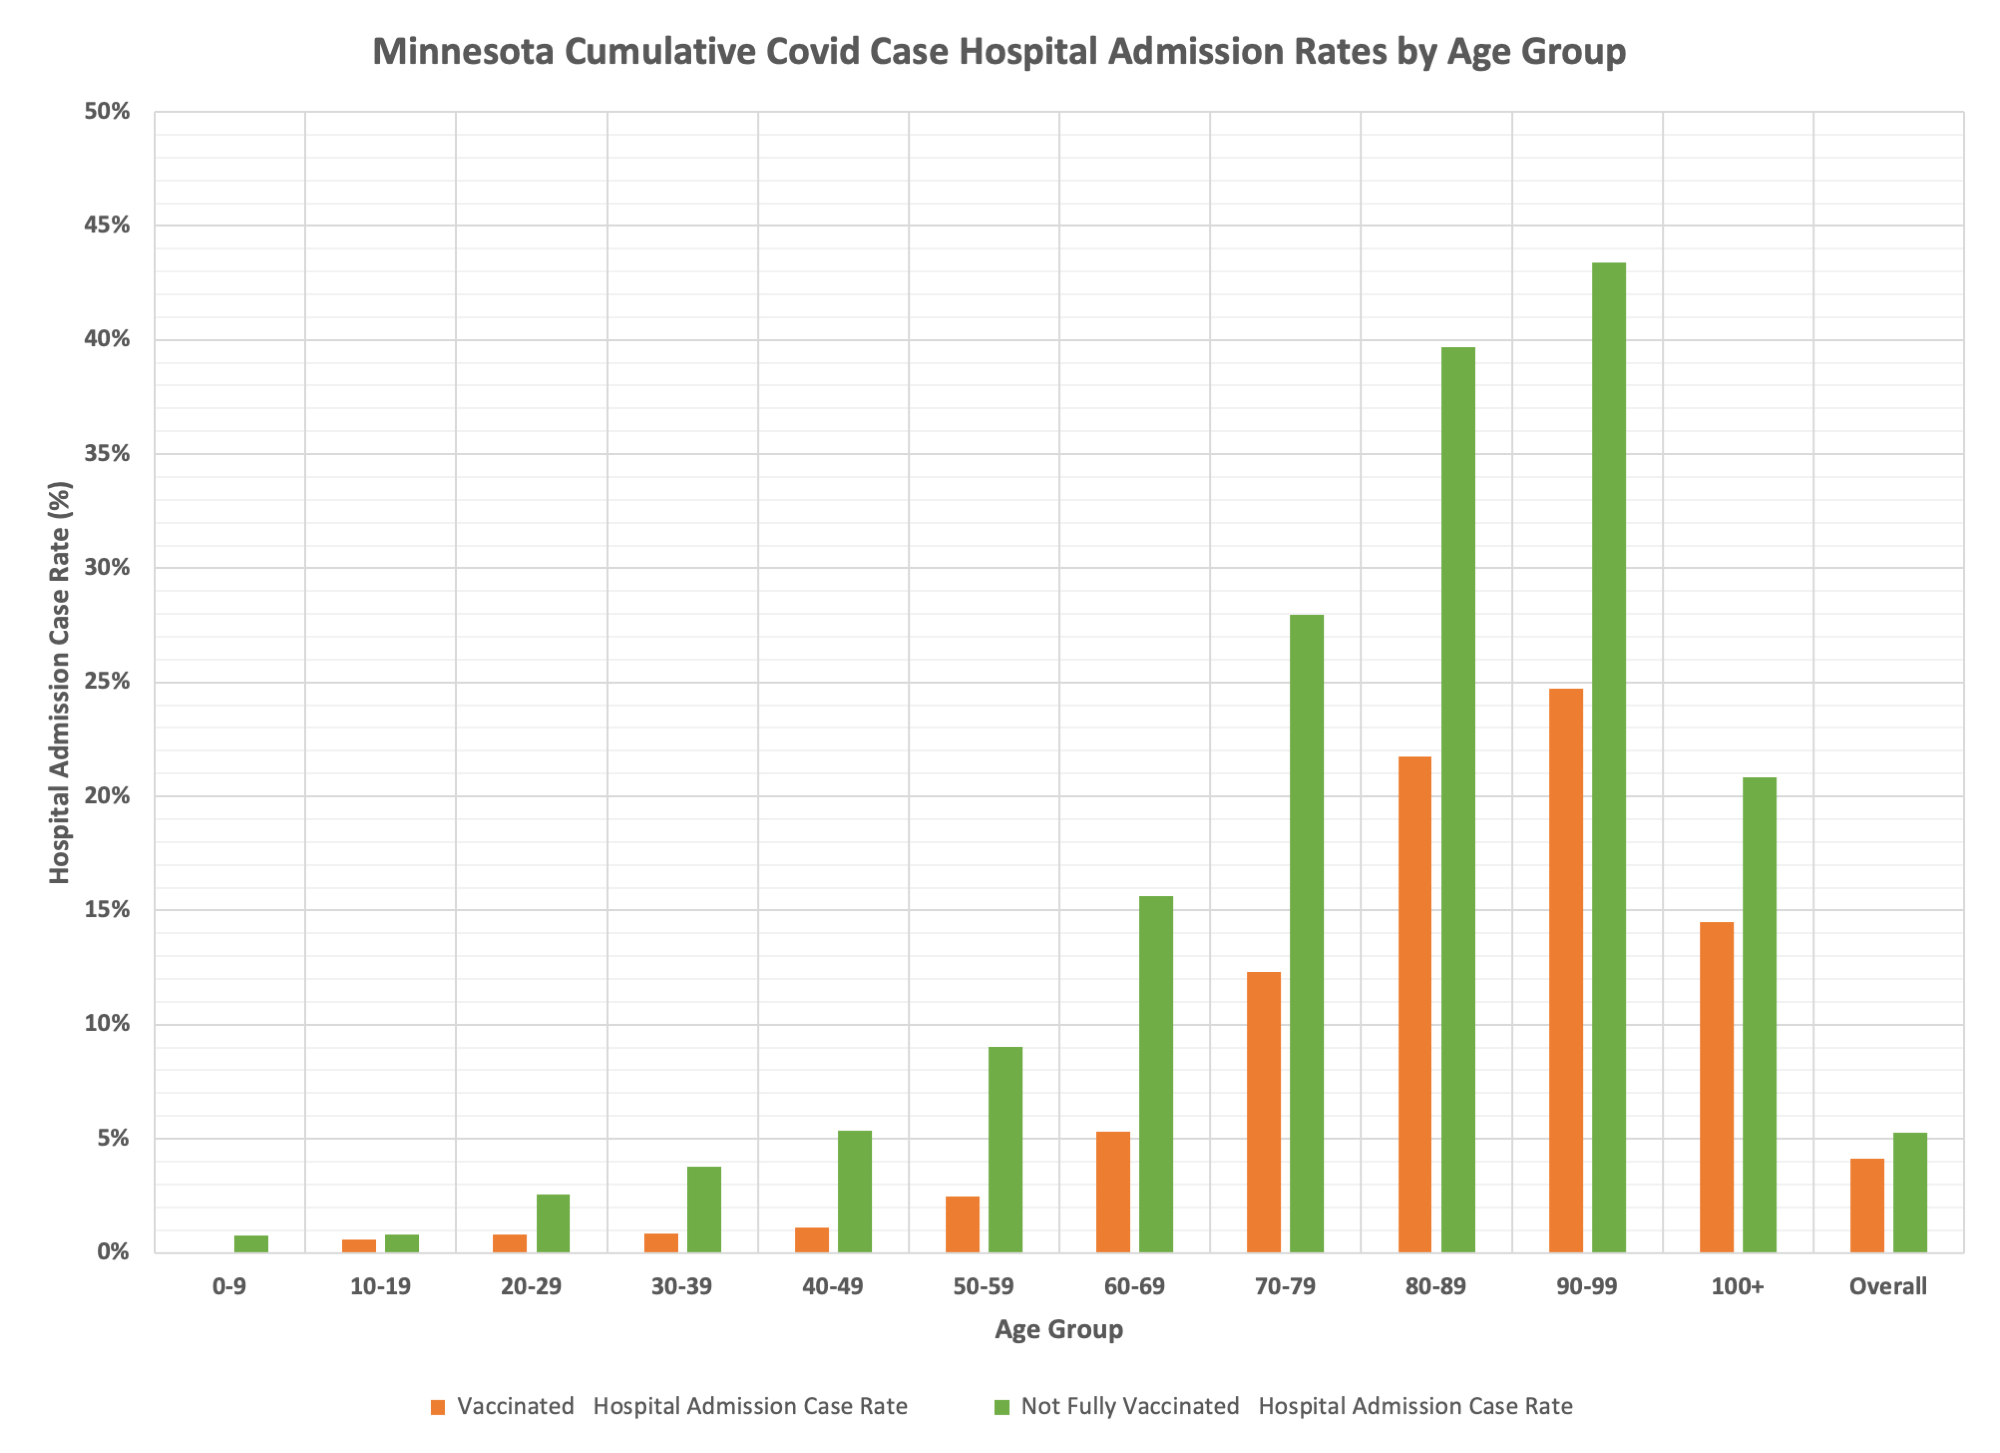
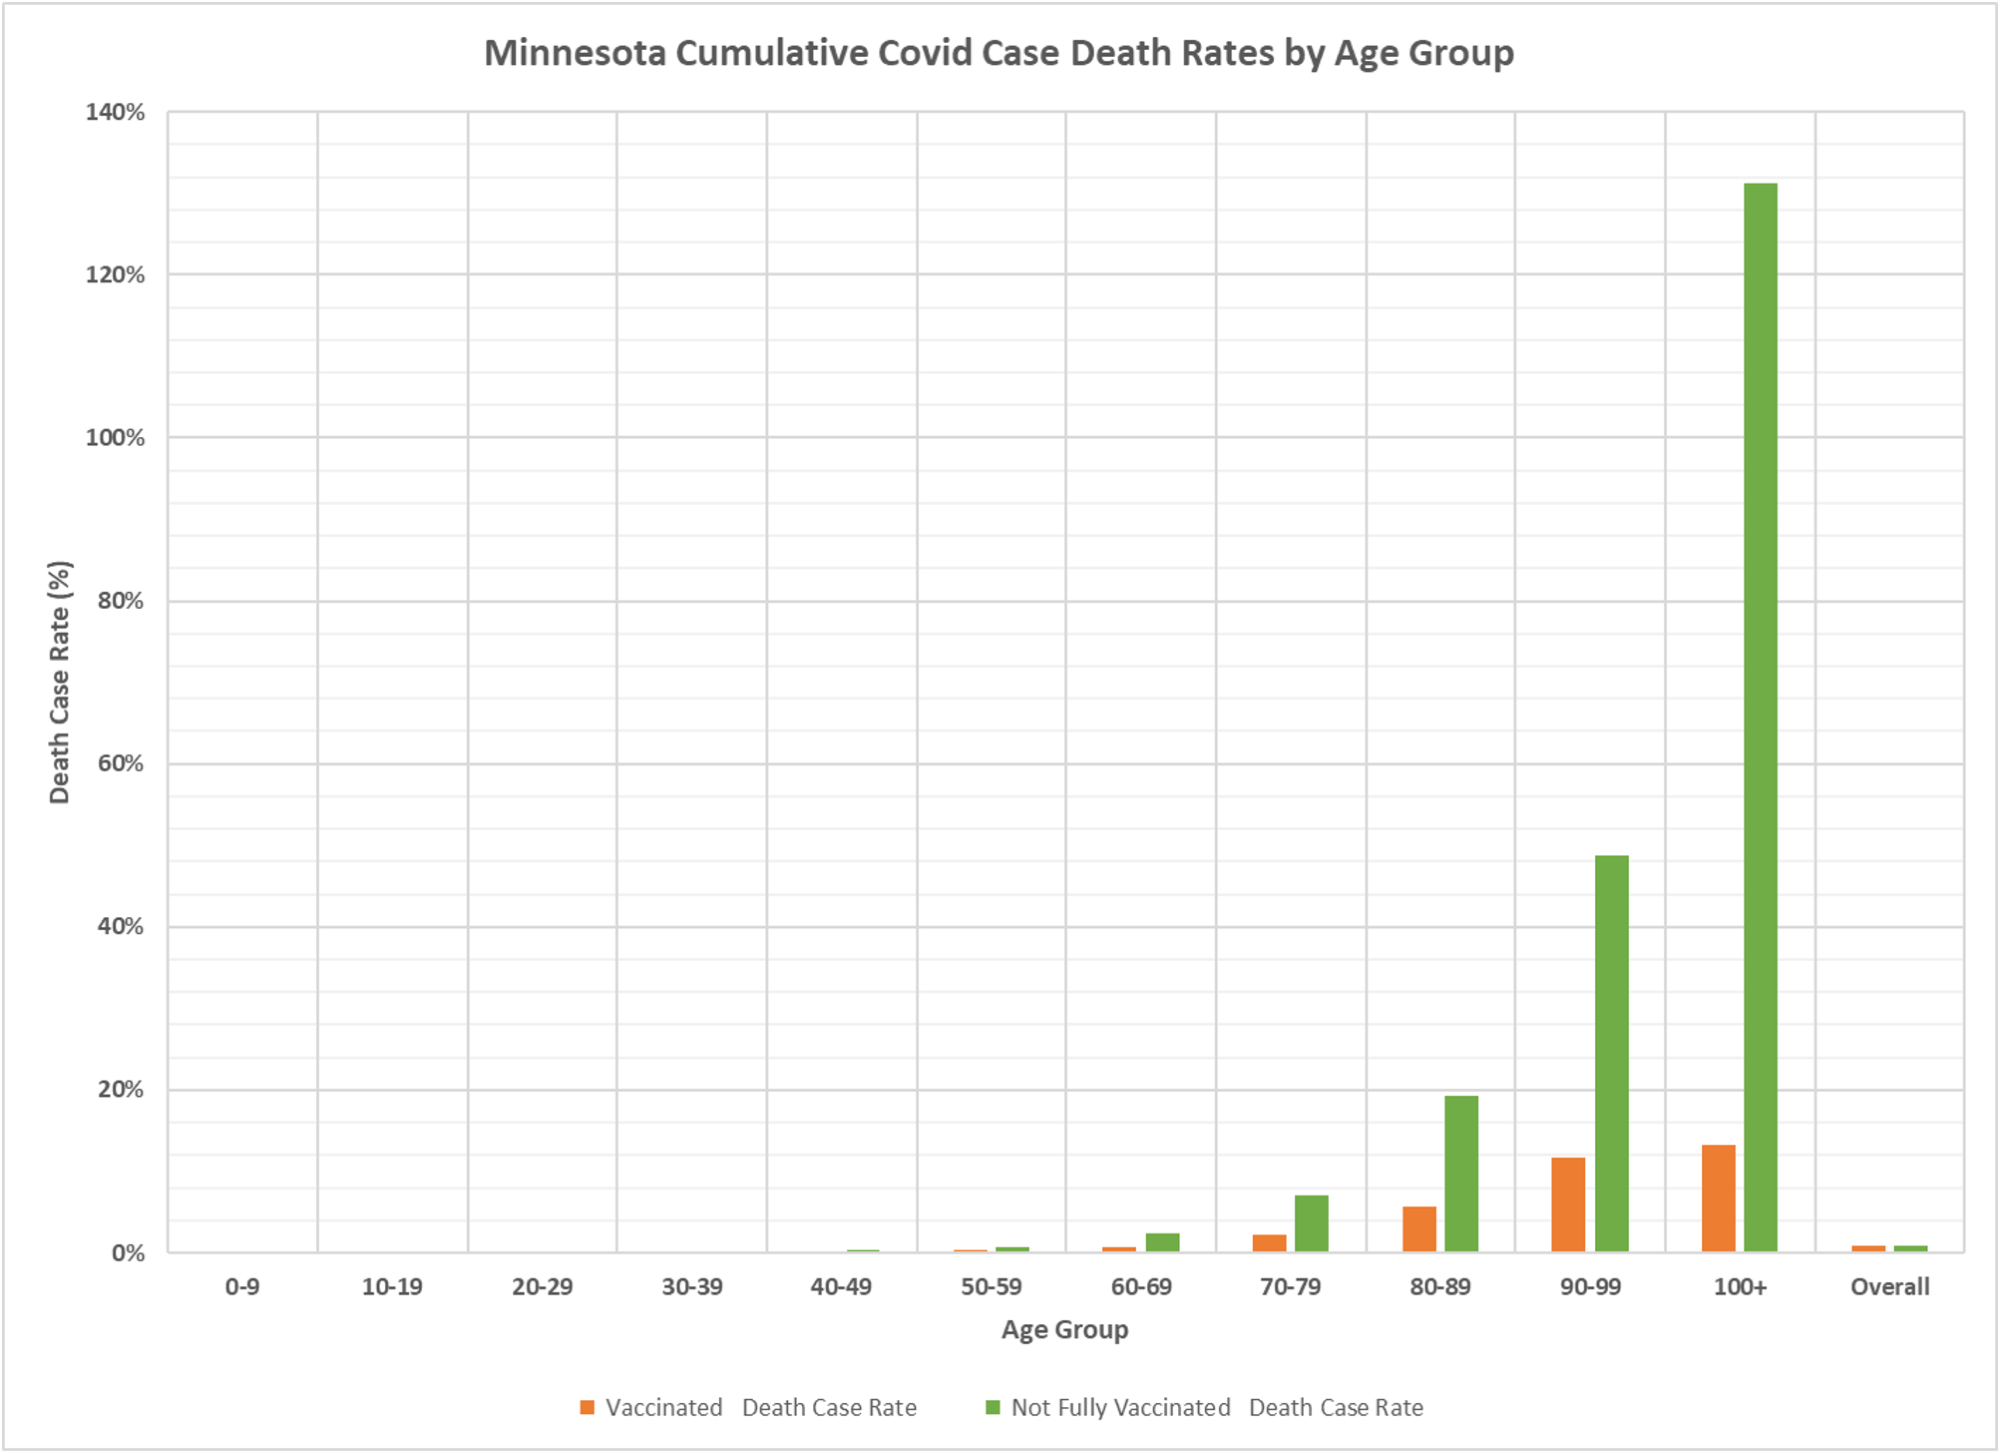
- We can see, not surprisingly, that the older age groups are at greater risk of hospitalization and death, whether vaccinated or not, and the non-vaccinated are at higher risk of hospitalization and death than the vaccinated, once testing positive for Covid.
- The Not Fully Vaccinated death case rate for the 100+ age group is 131.25%. There were 21 deaths and only 16 cases among the Not Full Vaccinated population in the 100+ age group. This illustrates the potential errors that are occurring by being forced to assume the lag from date of specimen collection to death, and then from death to publication in the Minnesota Weekly Report.
- The overall hospital admission case rate for the vaccinated is 4.11% and for the not fully vaccinated is 5.27%. This means that in general the vaccinated are less likely to be admitted to a hospital than the unvaccinated. The ratio of the rates, 4.11%/5.27% = .738, means that the vaccinated are 73.8% as likely to be admitted to a hospital, when averaging over the entire population over the entire time period analyzed. However, when looking at individual age groups, we can see a greater effect of vaccination.
- The death case rates are the percent of positive cases who go on to die. We can see that the unvaccinated have much higher case rates than the vaccinated for all of the age groups that are 20 years old and older. However, because we included the under 20 age groups in the overall average, of overall death case rate for the unvaccinated is lower than for the vaccinated, 0.78% vs. 0.83%.

Can’t we persuade the MDH to plot CONVALESCENT , VEXXED, and UNVEXXED ?
I wish!!!
I’m sure MDH doesn’t provide the data, but based on what I’ve seen elsewhere, could be very interesting to break out “recently got a shot” from the “not fully vaccinated… to get a true “unvaccinated” cohort.
yeah, I don’t think it is accurate to lump the partly vaxed and the unknown vax status in with the unvaxed.
Ummm…this seems to strongly contradict the claim that the vaccinated are 10x to 14x less likely to be hospitalized. Am I missing something?
no, but these are case rates–if you are infected, what is the risk that you will be hosp. or die. A per capita rate is different and would capture different infection risk as well. I increasingly also believe that a huge number of vaxed infections aren’t reported in the numbers which means the case rates are lower, and while the case rate of hosps would stay the same since those are all detected, but the per capita vax infection rate would be higher.
It would be interesting to see a 2021 month to month data series on percentage of Minn. population vaccinated/unvaccinated. And to see that plotted against the shifting percentage of hospitalized vacc’d and unvacced. Separating out the last 60 days might also be of interest, as that has been mostly Omicron.
Kinda tired of hearing the claim that 10x to 14x of those hospitalized are unvaccinated (a misleading “stat” created by including early months were few were vaccinated).
we have that chart pretty regularly and will get it out again. it is true that the per capita rate of vaxed hosp is very much lower than the per capita rate of unvaxed hosp.
Very interesting analysis. I appreciate the effort. I haven’t seen this kind of analysis and disaggregation of data anywhere else. Kudos.
Regarding the observation that case rates are higher for unvaccinated versus vaccinated, do you data sets have any means of disaggregating individuals by region? I wonder if looking at lump sums of data across the whole state might miss the story and lead to wrong conclusions. As you well know, data is good not for telling us what “the story” is but for testing our hypotheses of “the story”. We iteratively fine tune our guesses by using data to rule out guesses until we hone on something approximating “the story”.
Pontification aside, per your data we higher rates in unvaccinated. This may not definitely suggest the vaccine helps against the spread. For example, if in 2020, when the virus emerged on the scene in force, the primary portion of the population impacted was the urban environment, perhaps the virus already made its way through the cities. Then, coincidentally, those same populations are more inclined towards getting vaccinated, so their safety from the virus has less to do with the vaccine and more to do with the virus already running its course. On the other hand, the rural populations may be seeing a delayed spread of the virus. These populations tend to be less vaccinated. So the cases/hospitalizations/deaths of unvaccinated may be a mere symptom of geographical dispersion and delayed viral spread.
I’m not an epidemiologist, just someone who analyzes data regularly and knows that rarely does the true story emerge from the highest level of analysis. That is only the starting place for further questions. Constantly I see the popular narrative rely on this first level analysis without asking any further questions.
I don’t think we have the Minnesota regions by age. As I have noted a few times, there are all kinds of factors which might affect relative rates of infection, including prior infections, health status, etc. so yes, there could be significant hidden confounders, but I think it is directionally accurate.
Once again I ask the question below. (Based on overall hospitalizations)
With covid vaccines being very effective against death and hospitalization, why don’t the charts reflect a 50% to 75% reduction in deaths and hospitalization from 2021? In MN we have a 50% plus vaccination rate, plus nearly 2 years of natural immunity, and a large loss of the most vulnerable in 2020. One would think that deaths from covid would be limited to a very small subset of individuals who remain unvaxinated with multiple comorbidities. Yet it appears that deaths are trending only slightly lower than last year when very few were vaccinated
more overall cases, Delta may be more serious than previous variants. I always look at the case rates and they have been very consistent for a long time, til Omicron, which does appear to be a little less deadly, but early to tell for sure.