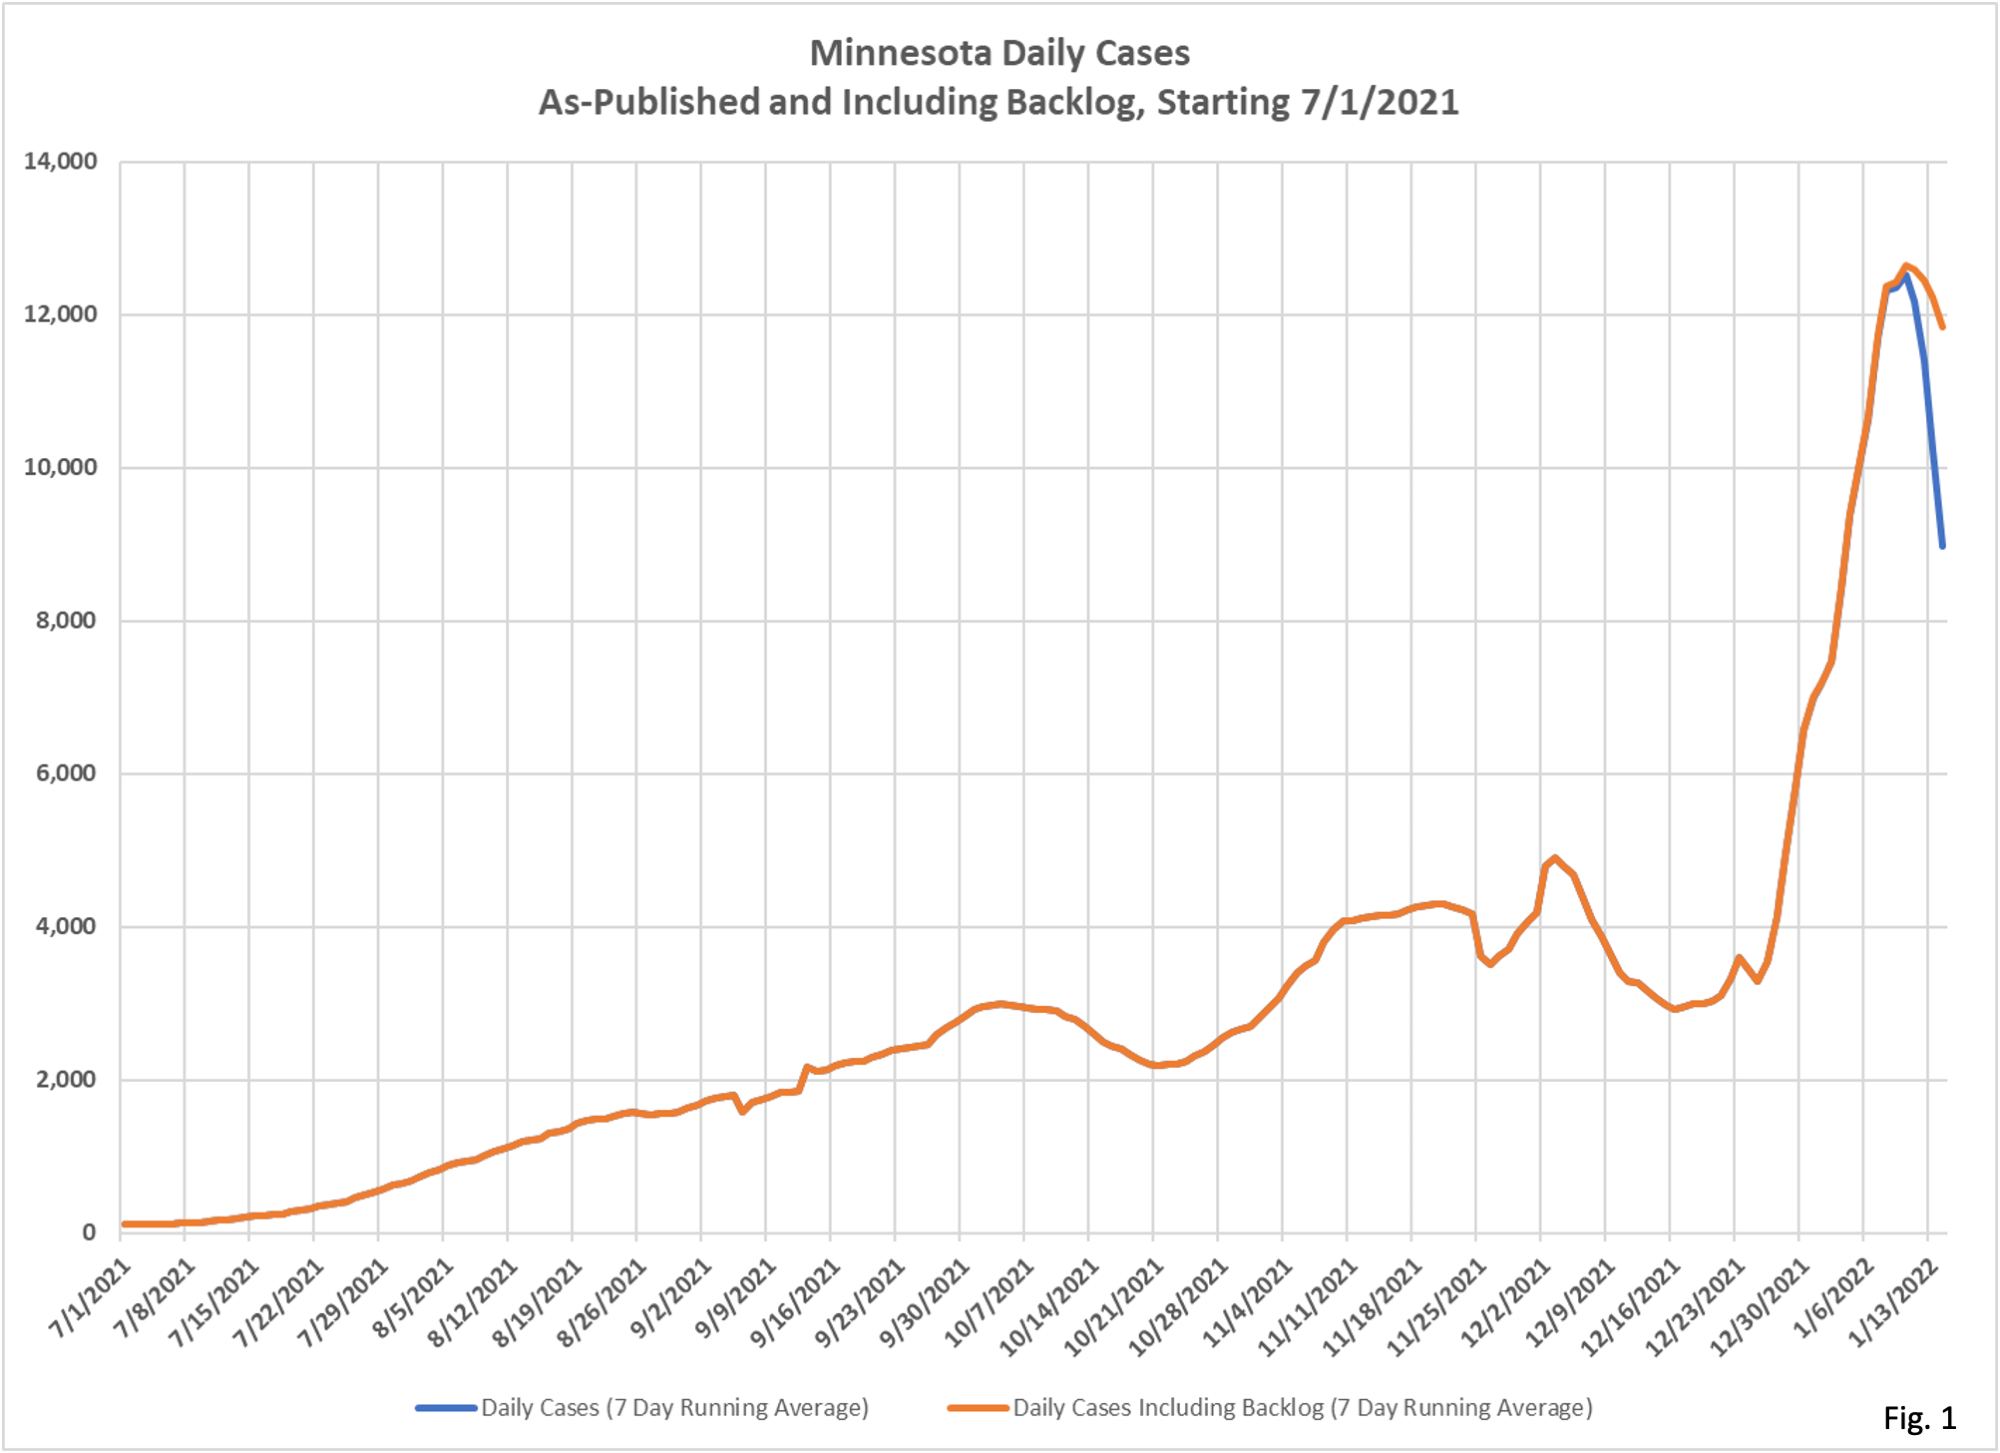
Minnesota is having a lot of trouble keeping up with testing and cases over the last few weeks. So Dave Dixon took a look at trends in those backlogs. You see the period spikes which are caused generally by data dumps. You will also see, barring further data issues, that the peak of this wave appears to be in the January 10 area.
Dave’s notes:
- On 1/21/2022 the Minnesota Department of Health (MDH) added some new notes and data on the MDH Situation Update for COVID-19 web page (https://www.health.state.mn.
us/diseases/coronavirus/ situation.html), about the backlog of Covid tests and cases that they had yet to report. MDH stated that between 12/30/2021 and 1/20/2022 they had processed 166,465 reported cases and had an estimated backlog of 46.006 reports awaiting review. This backlog, once processed, and if accurate, will increase the already high reported level cases by 27% over the 3 week period at the peak of the Omicron wave of cases in Minnesota. - To illustrate the backlog we have plotted the 7 day average daily cases, both with and without the backlog of cases. Fig. 1 show the current long wave of cases, starting 7/1/2021, and Fig. 2 shows the Omicron surge in cases starting 12/17/2021. We can see in Fig. 2 that the peak in cases occurred on 1/10/2022, whether the backlog of cases is included on not. The rate of decrease, of course, is much more gradual when the backlog of cases is included.
- MDH’s statement on backlog of cases awaiting review prompted us to take a closer look at MDH’s reporting performance over time. Each weekday MDH publishes the total tests performed and total cases on each date going back to the start of the pandemic. By subtracting one day’s series of reported totals from the next days reported totals we can determine how many tests or cases are added to each date. By analyzing the tests and cases added each day we can calculate the lag from test or case until reporting on the Situation Update web page.
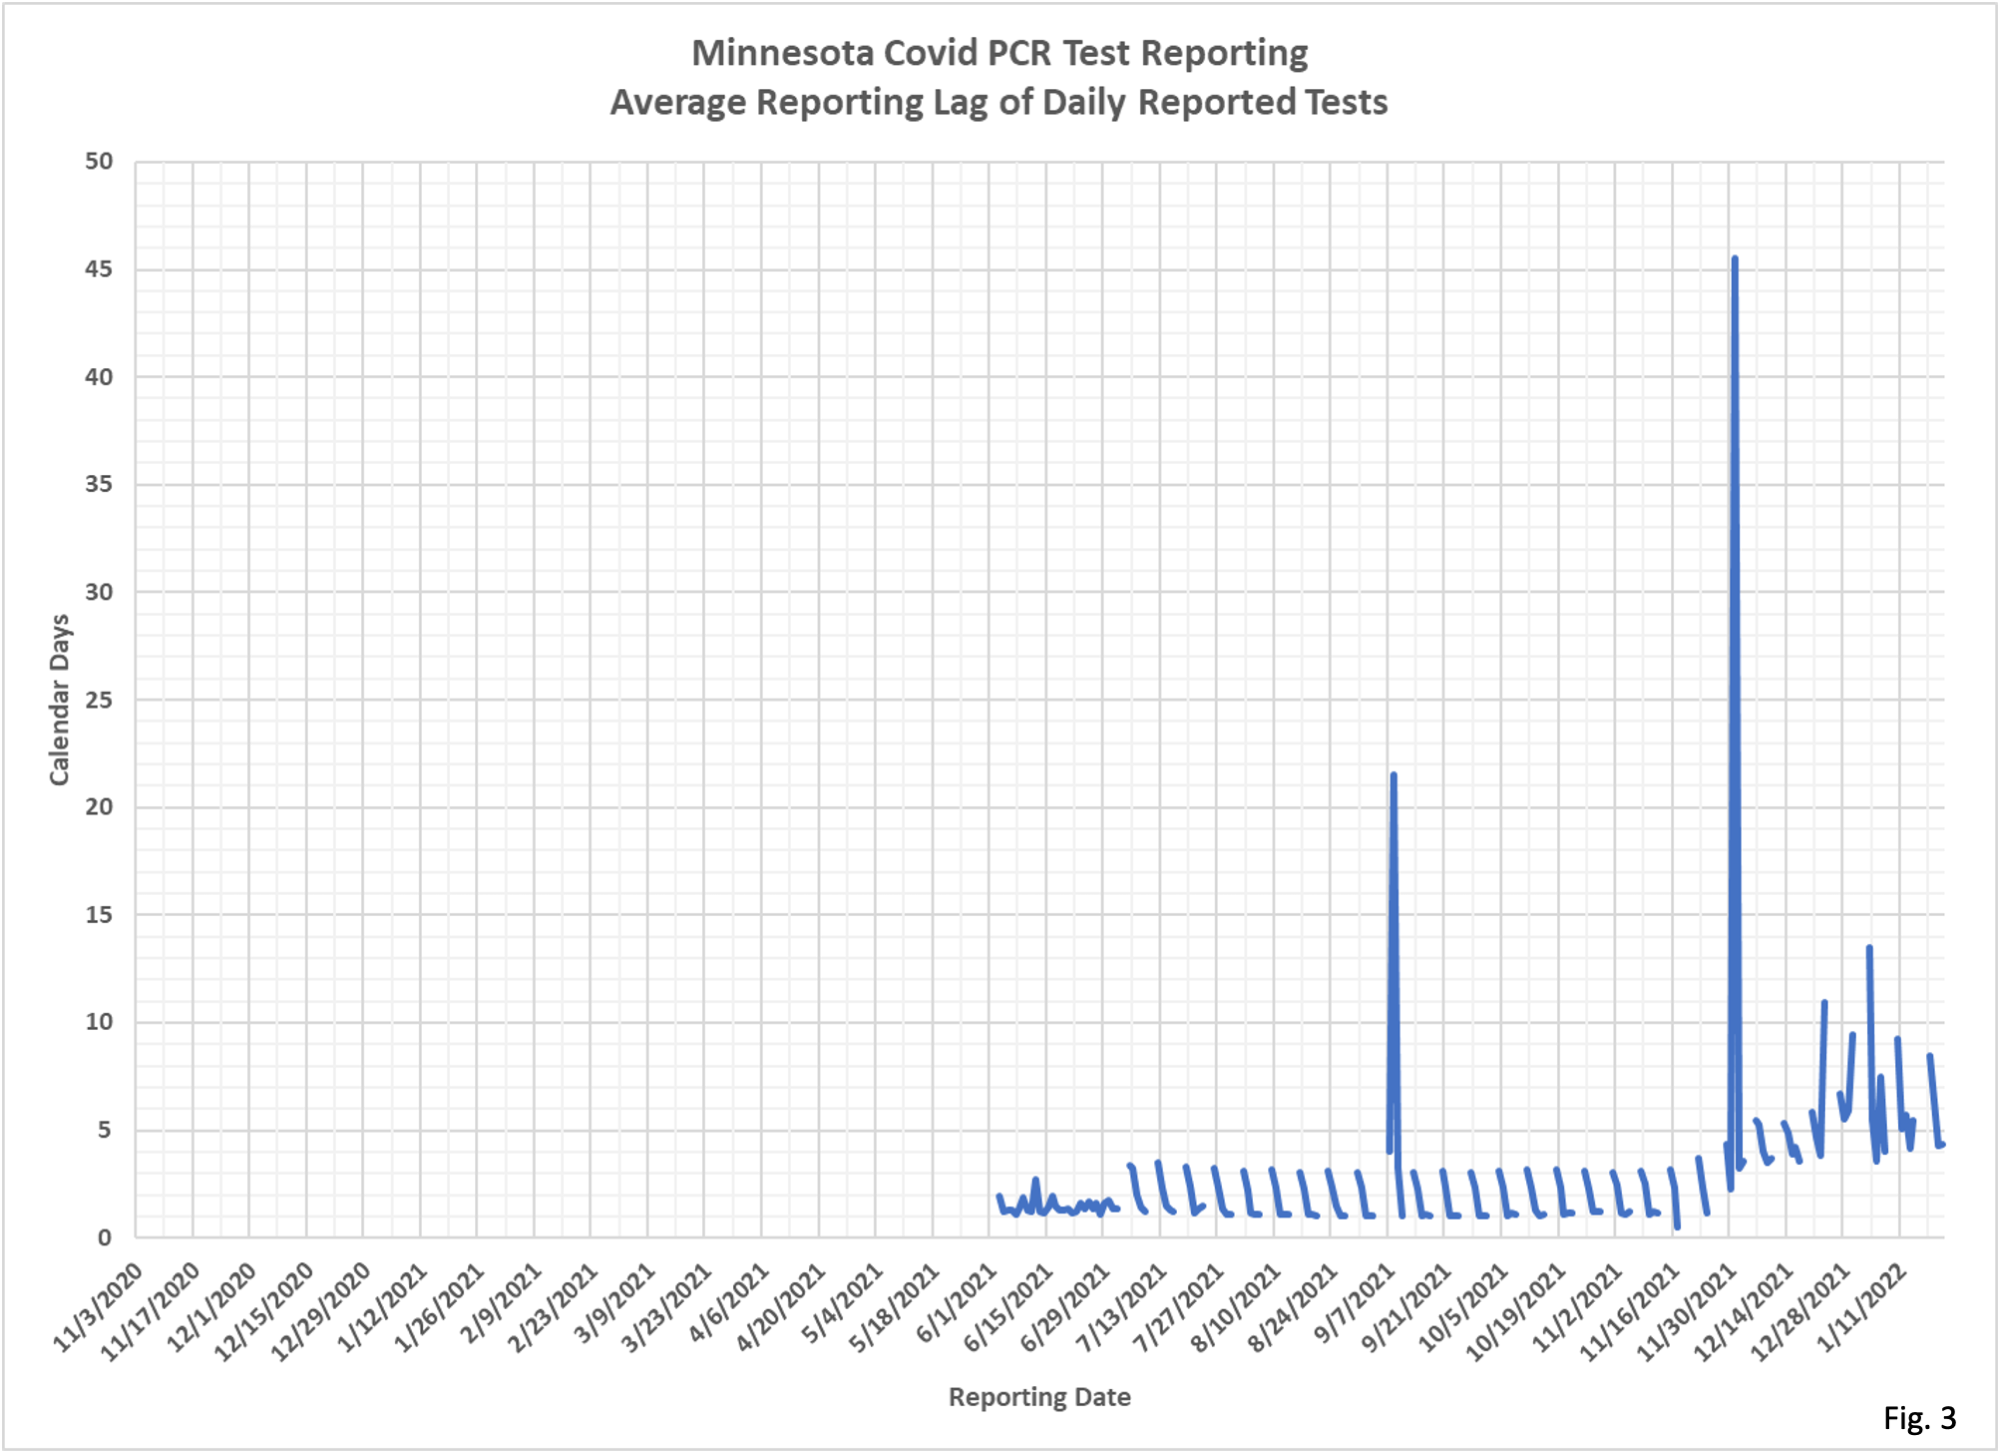
- Fig. 3 displays MDH’s reporting lag for all PCR tests. This chart shows, on any given reporting day, how many days prior the average specimen collection date was. For example, the most recent date plotted is 1/21/2022, where the average reported test had the specimen collected 4.36 days prior to 1/21/2022.
- Several spikes standout in Fig. 3. One large spike on 12/1/2021 is due to a change in reporting by MDH. Starting the 12/1/2021 MDH reports tests by date of specimen collection. Prior to 12/1/2021 MDH reported tests by the date that the testing lab reported the test to MDH. Before 12/1/2021 the reporting lag runs very consistently from 1.1 to 3.1 days, meaning that it took MDH between 1 and 3 days to publish the test after receiving the data from the testing lab. After 12/1/2021 the reporting lag is longer, from 3.6 to 13.5 days from specimen collection date to publication.
- Fig. 3 illustrates one other change in reporting by MDH. Starting 7/1/2021 MDH reported data on weekdays only. Before 7/1/2021 data was reported 7 days a week. Before 7/1/2021 the test reporting lag on Fig. 3 was generally between 1 and 2 days, for the data analyzed for the month of June, 2021.
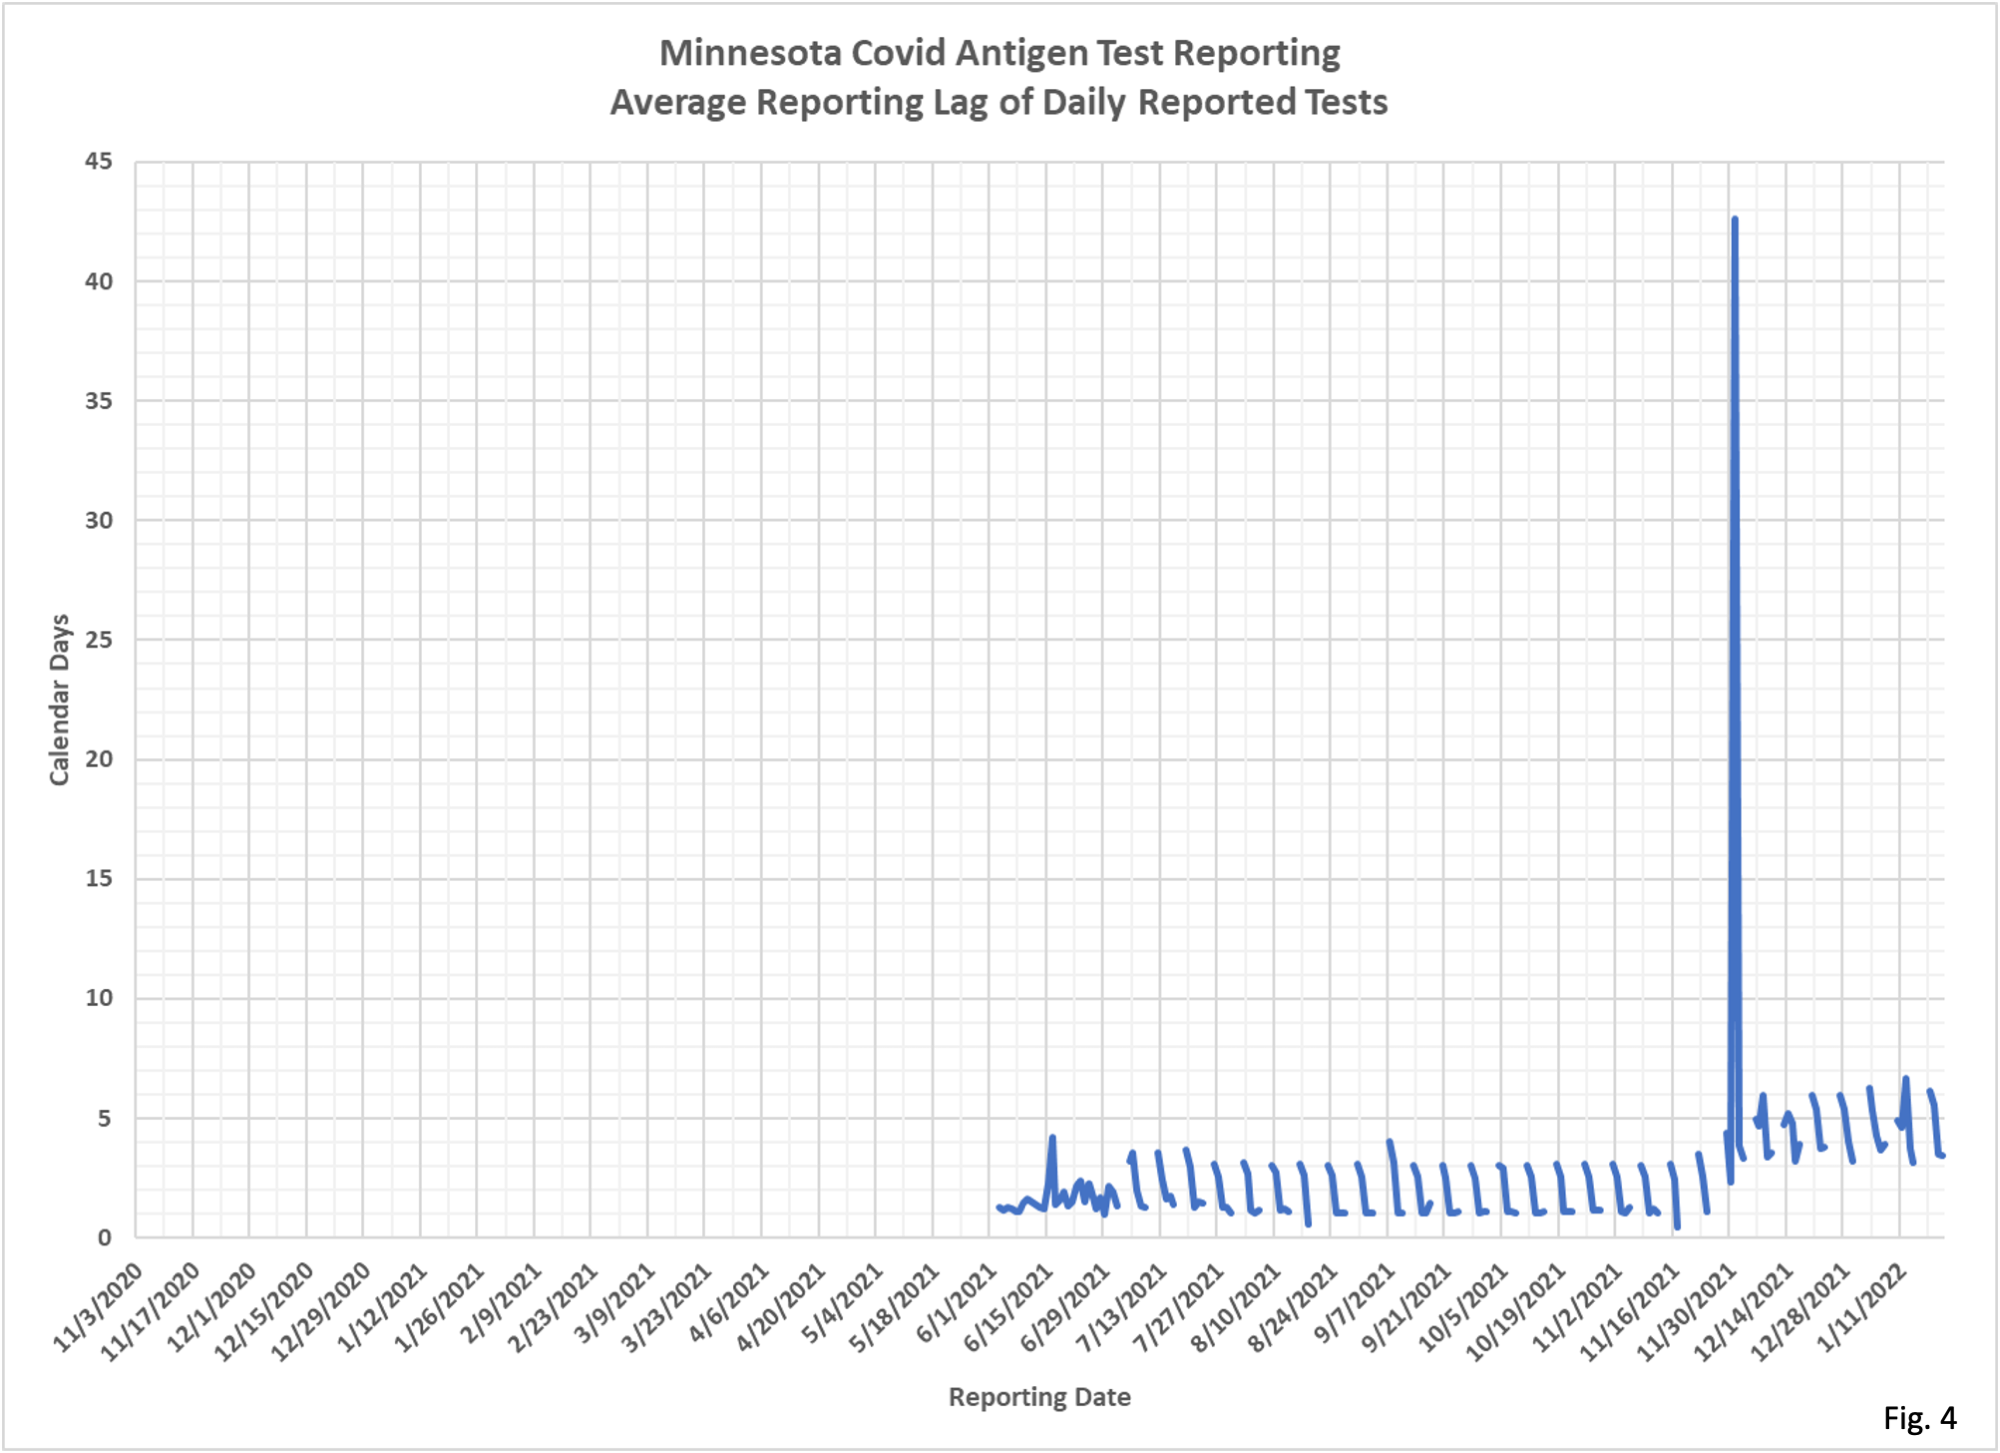
- Antigen test reporting lags shown in Fig. 4 shows similar features to PCR test reporting. There is the same spike on 12/1/2021 because of the change from report-to-MDH date to specimen collection date, and the change from 7-day reporting to weekday reporting on 7/1/2021.
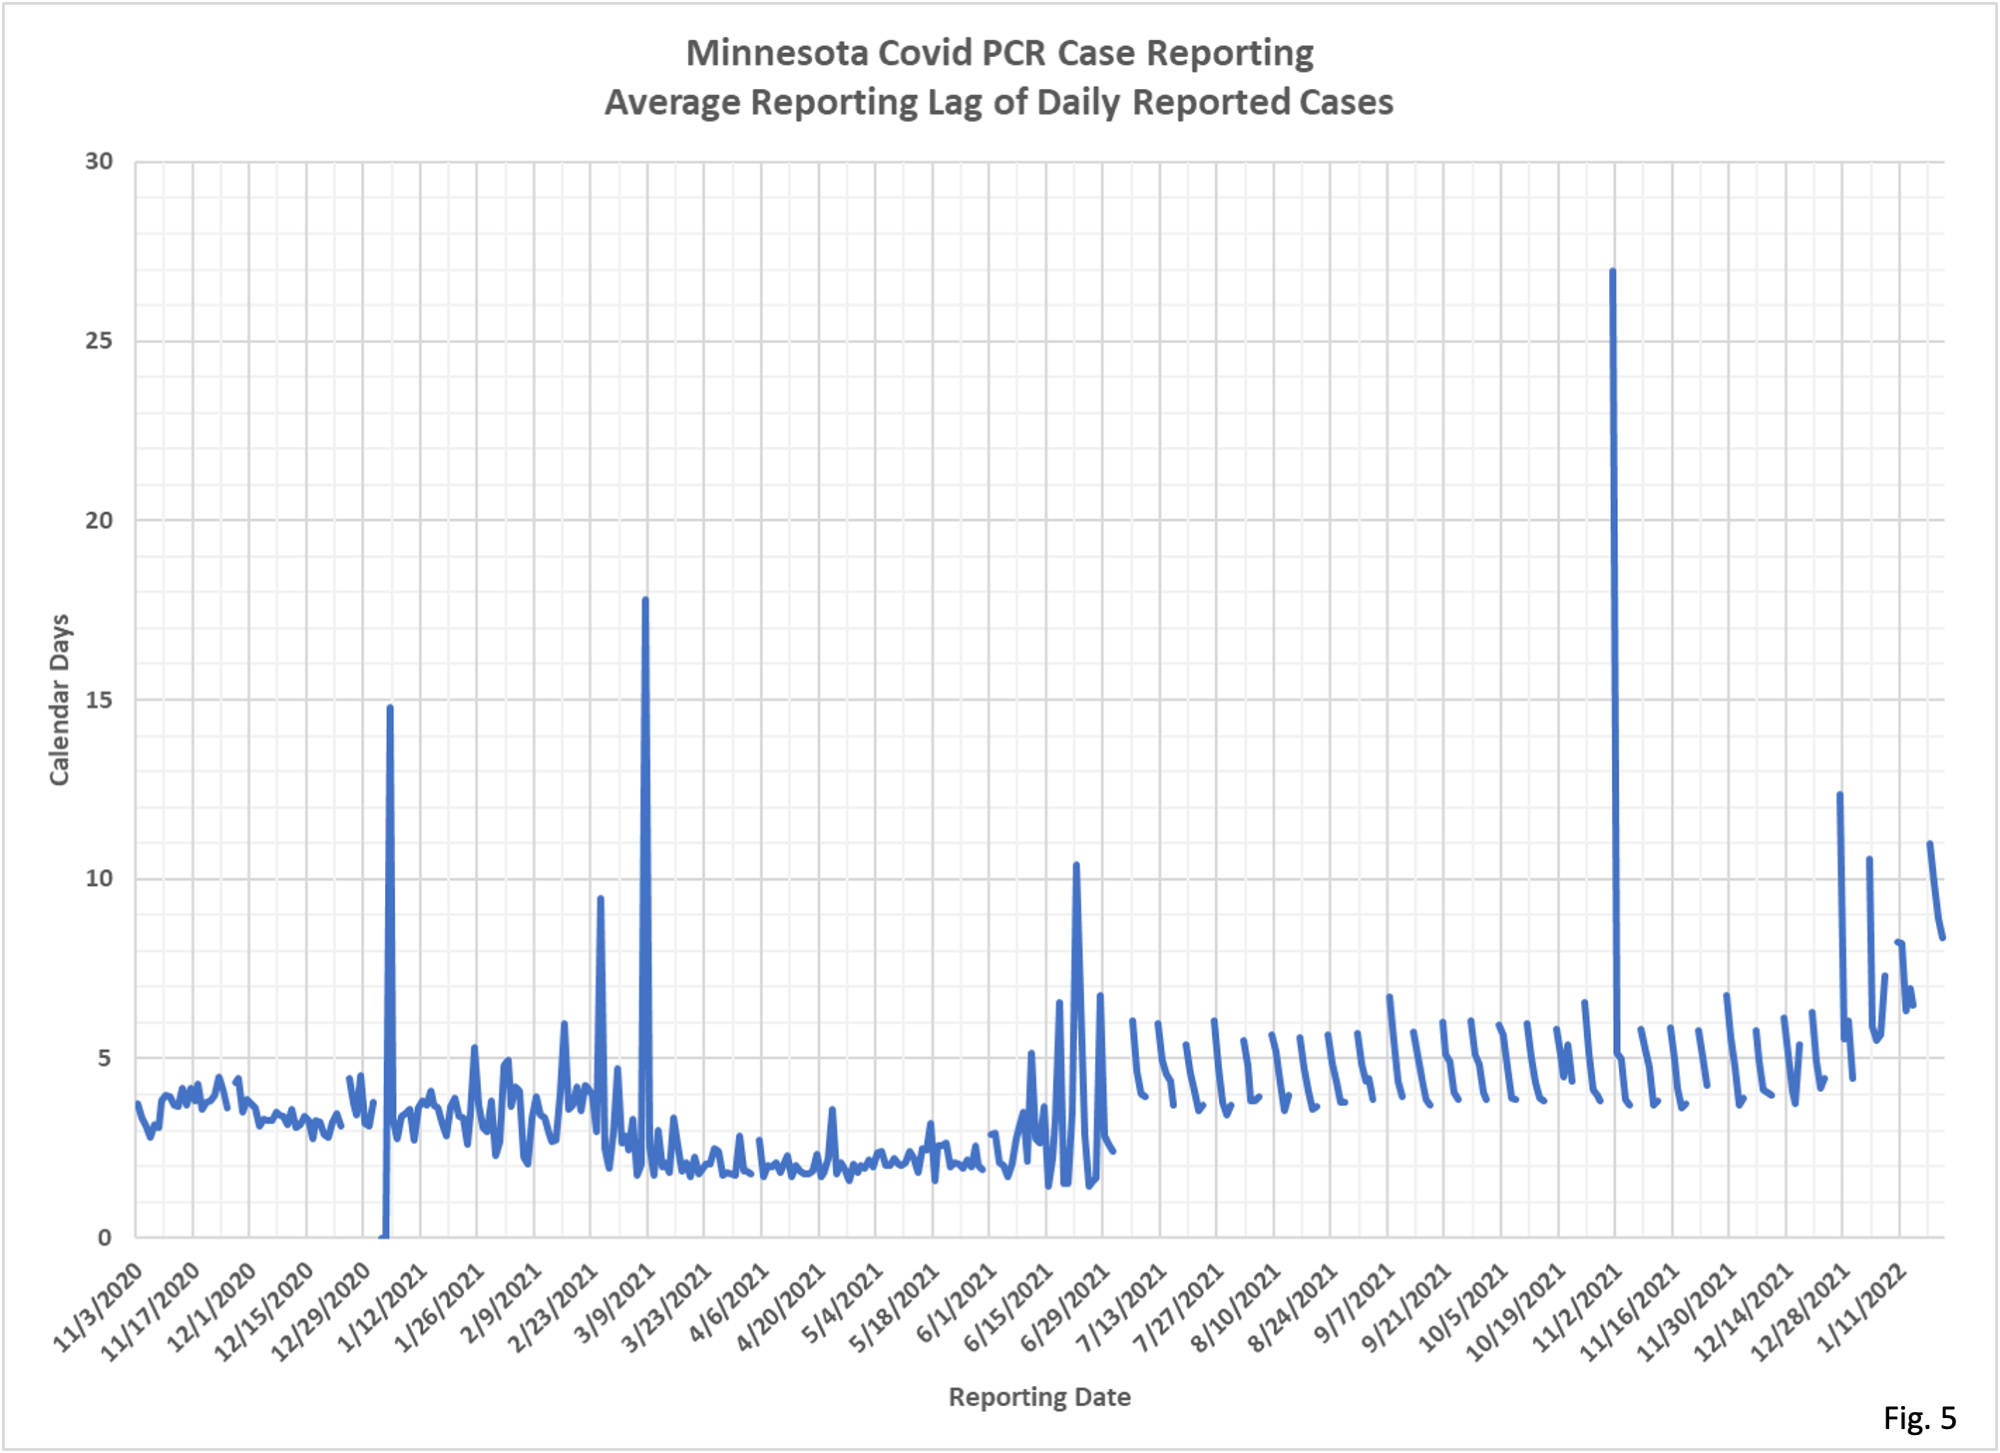
- Just as we computed the tests added per test date, we can calculate the number of PCR positive cases added to the daily totals, and then compute how long it took MDH to add the case to the published totals. Fig. 5 shows the lag in reporting positive PCR cases.
- As with cases, MDH currently publishes cases by specimen collection date. However, unlike testing date which switched to reporting by specimen collection date on 12/1/2021, positive cases have been reported by specimen collection date for the whole range of displayed in Fig. 5. MDH reported new cases 7 days a week prior to 7/1/2021, just as for tests.
- Several peculiarities are apparent in Fig. 5. A spike can be seen on 11/2/2021, which is on a different date from the similar spike seen on the testing lag chart on Fig. 3. The cause of this spike is currently unknown. There are no explanatory notes on the Situation Update page on 11/2/201 to explain it.
- Another peculiarity on Fig 5 is the transition from 7-day per week reporting prior to 7/1/2021 to weekday reporting after 7/1/2021. Although the cases are reported by specimen collection date through this time period the testing lag was typically 2 to 3 days April and May 2021 to 3.5 to 6 days after 7/1/2021. In addition the lags were highly variable in June 2021 leading up to the transition to weekday reporting.
- Another anomaly seen in Fig. 5 is the spike on 3/8/2021. This happens to be the same date when many deaths that had occurred in nursing homes were posted as a data dump, deaths having occurred over a period of many months (at that time deaths were reported by date of report, not date of death). If cases were posted the same day here it should not generate a spike in cases because this reporting is said to be by specimen collection date, not reporting date.
- We can see in Fig. 5 that the reporting lag since 12/1/2021 has increased as testing has increased during the recent surge in cases.
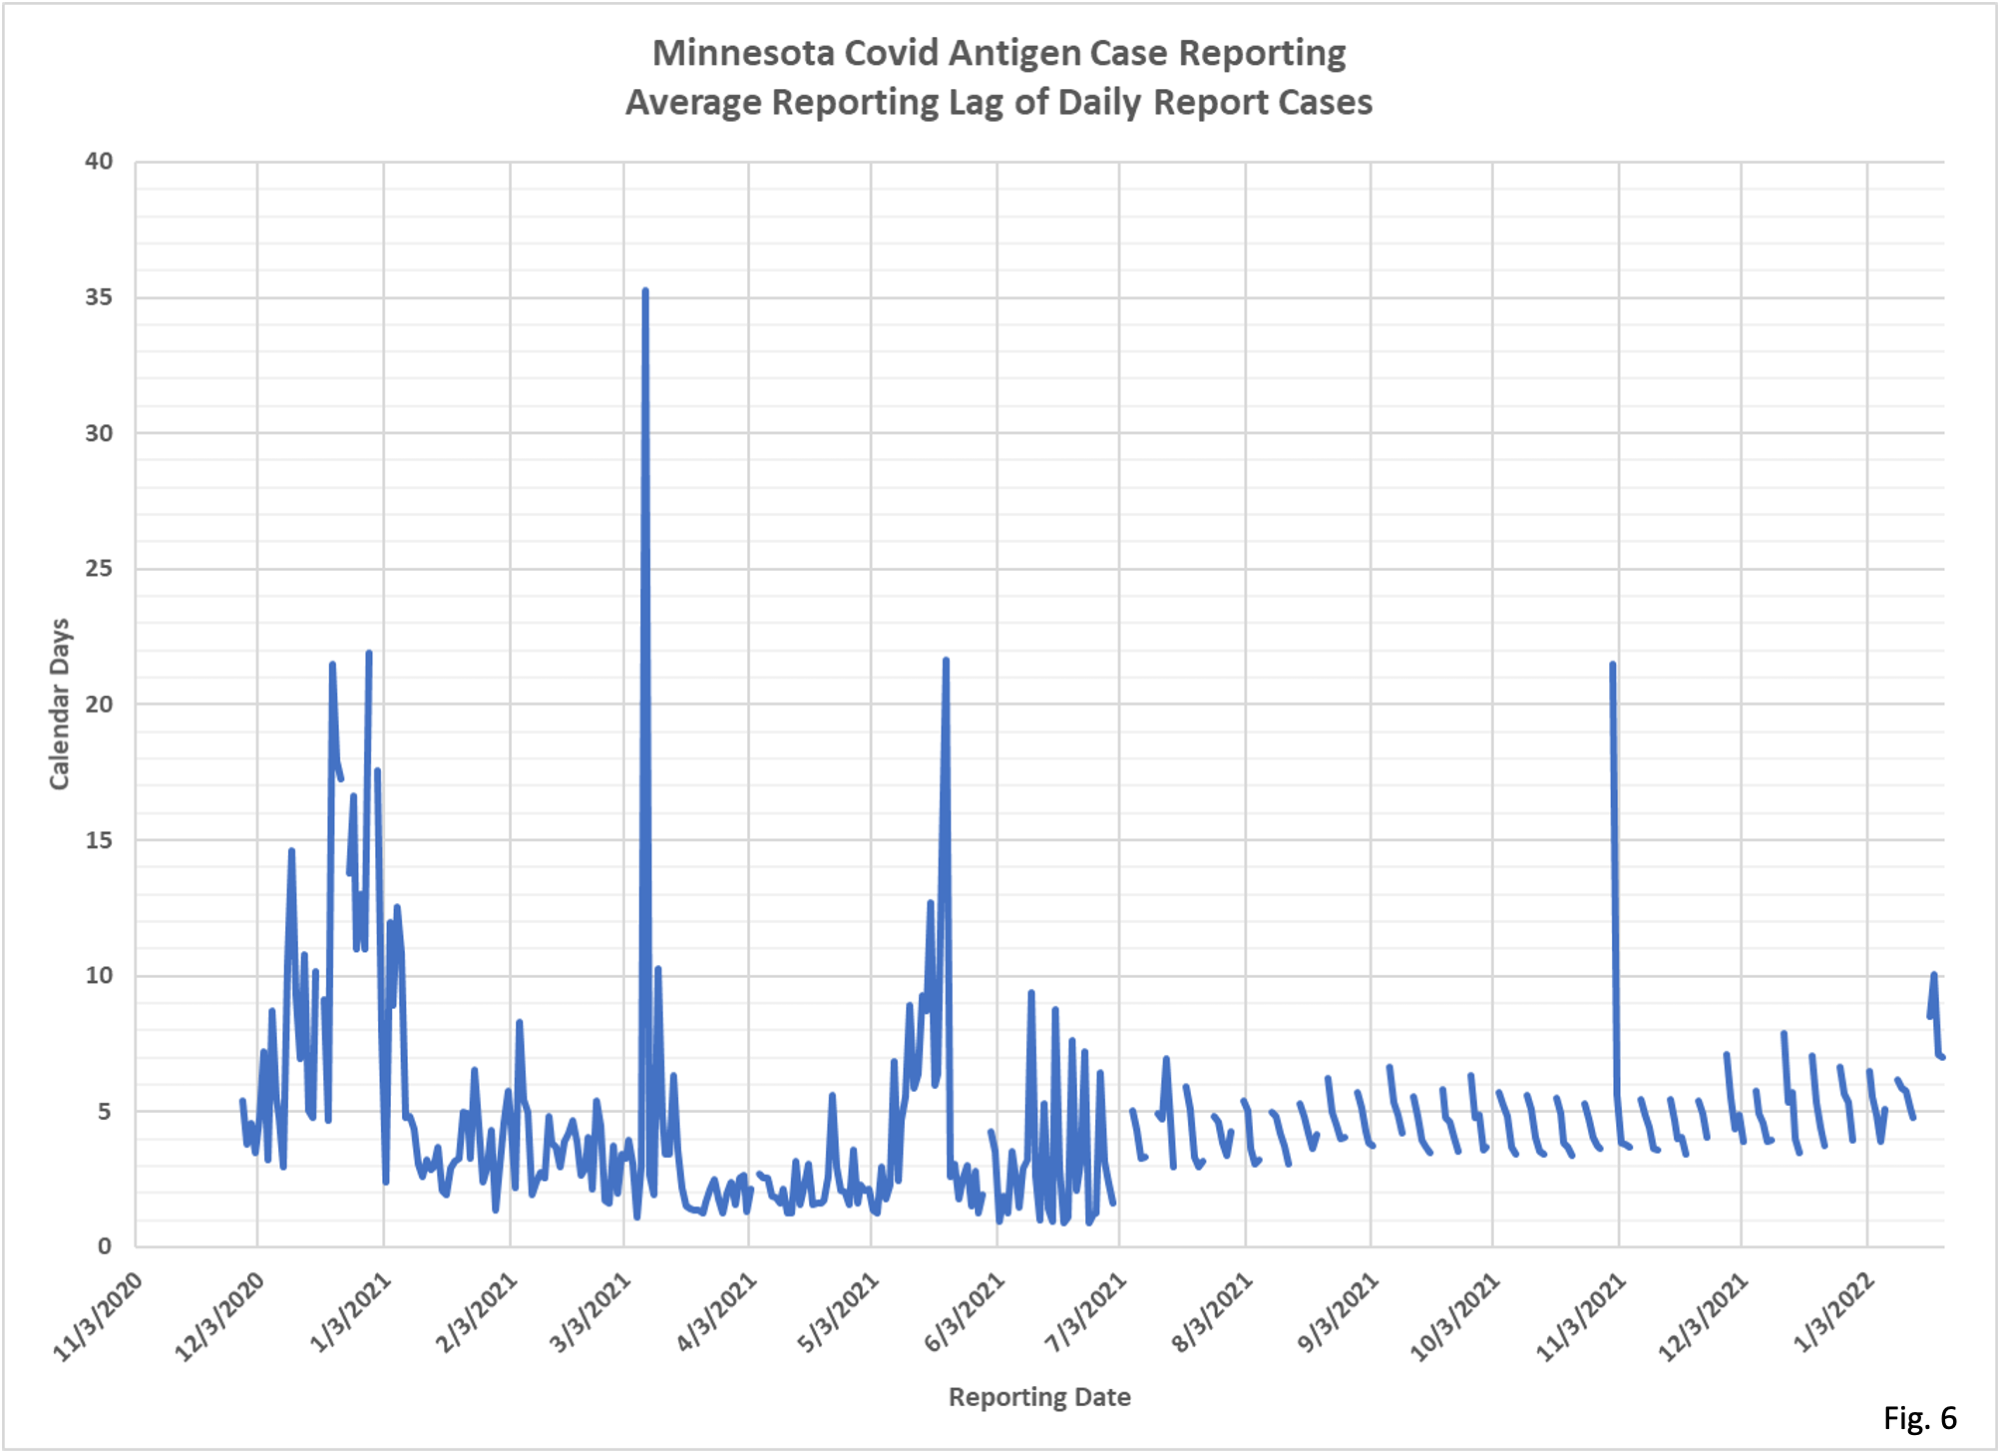
- Antigen case reporting lags are shown in Fig. 6. As for PCR case reporting lags in Fig. 5, we can see a lengthening of lag time in recent weeks, and a spike on 11/2/2021. Other than these 2 anomalies, antigen case reporting lag was really remarkably consistent since the switch to weekday reporting on 7/1/2021
- We can also visually compare the reporting lag for PCR tests in Fig. 3 to the reporting lag for PCR positive cases in Fig. 5. We can see that the reporting lag for tests in Fig. 3 is generally shorter than the reporting lag for positive cases in Fig. 5.