These come from the weekly report, which is basically date of report, but is the only way to see what is happening in different age groups. And one thing you see is lots of testing in younger groups as part of back to school.
Dave’s notes:
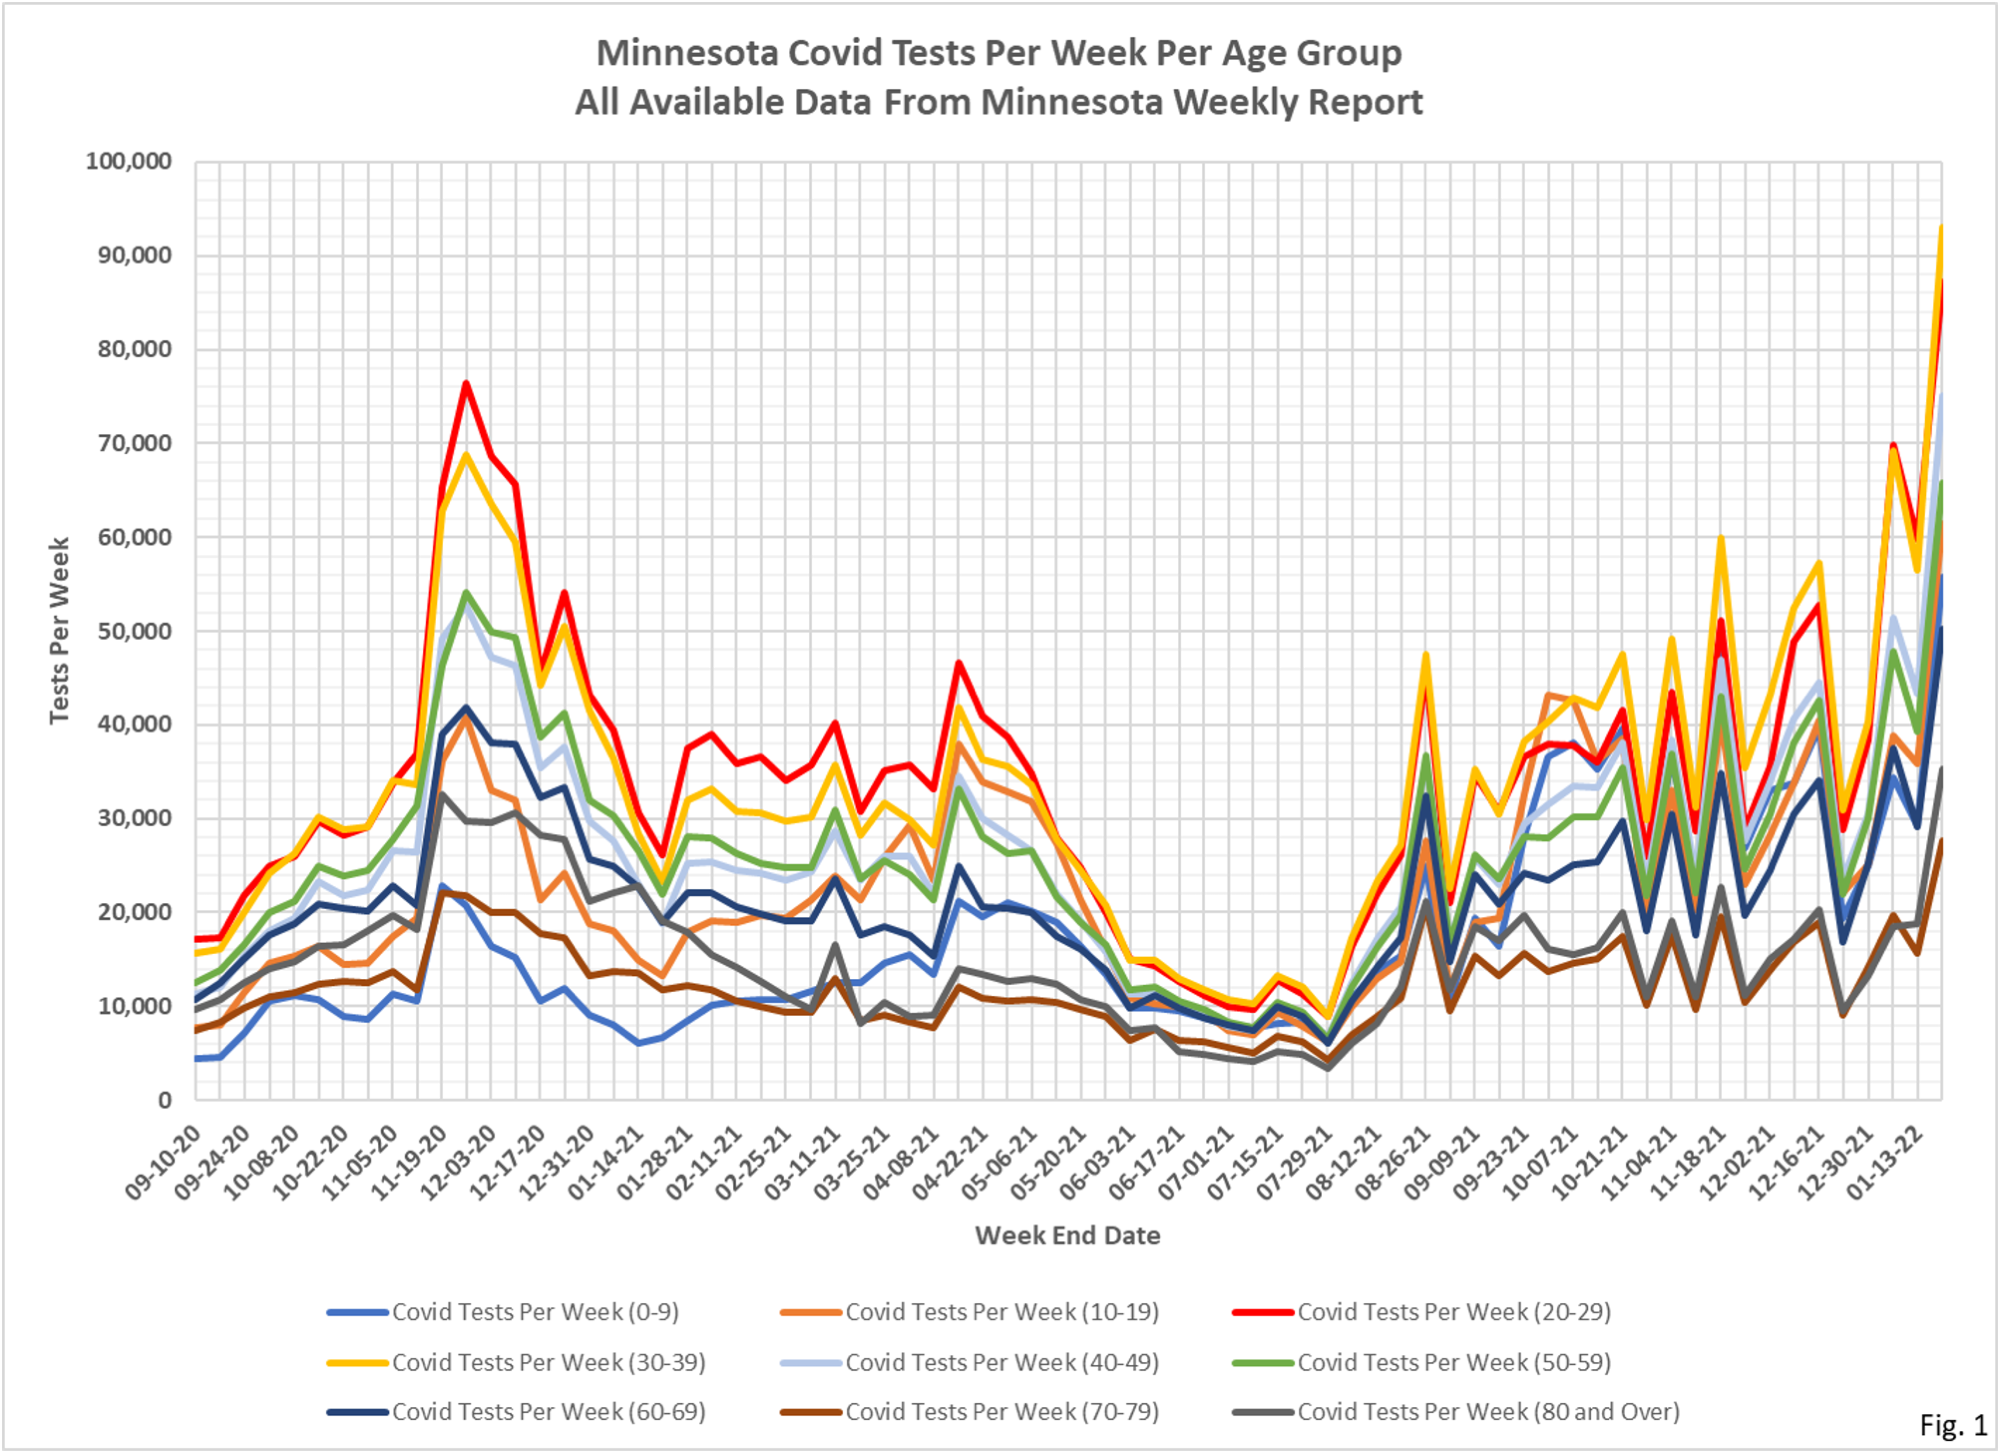
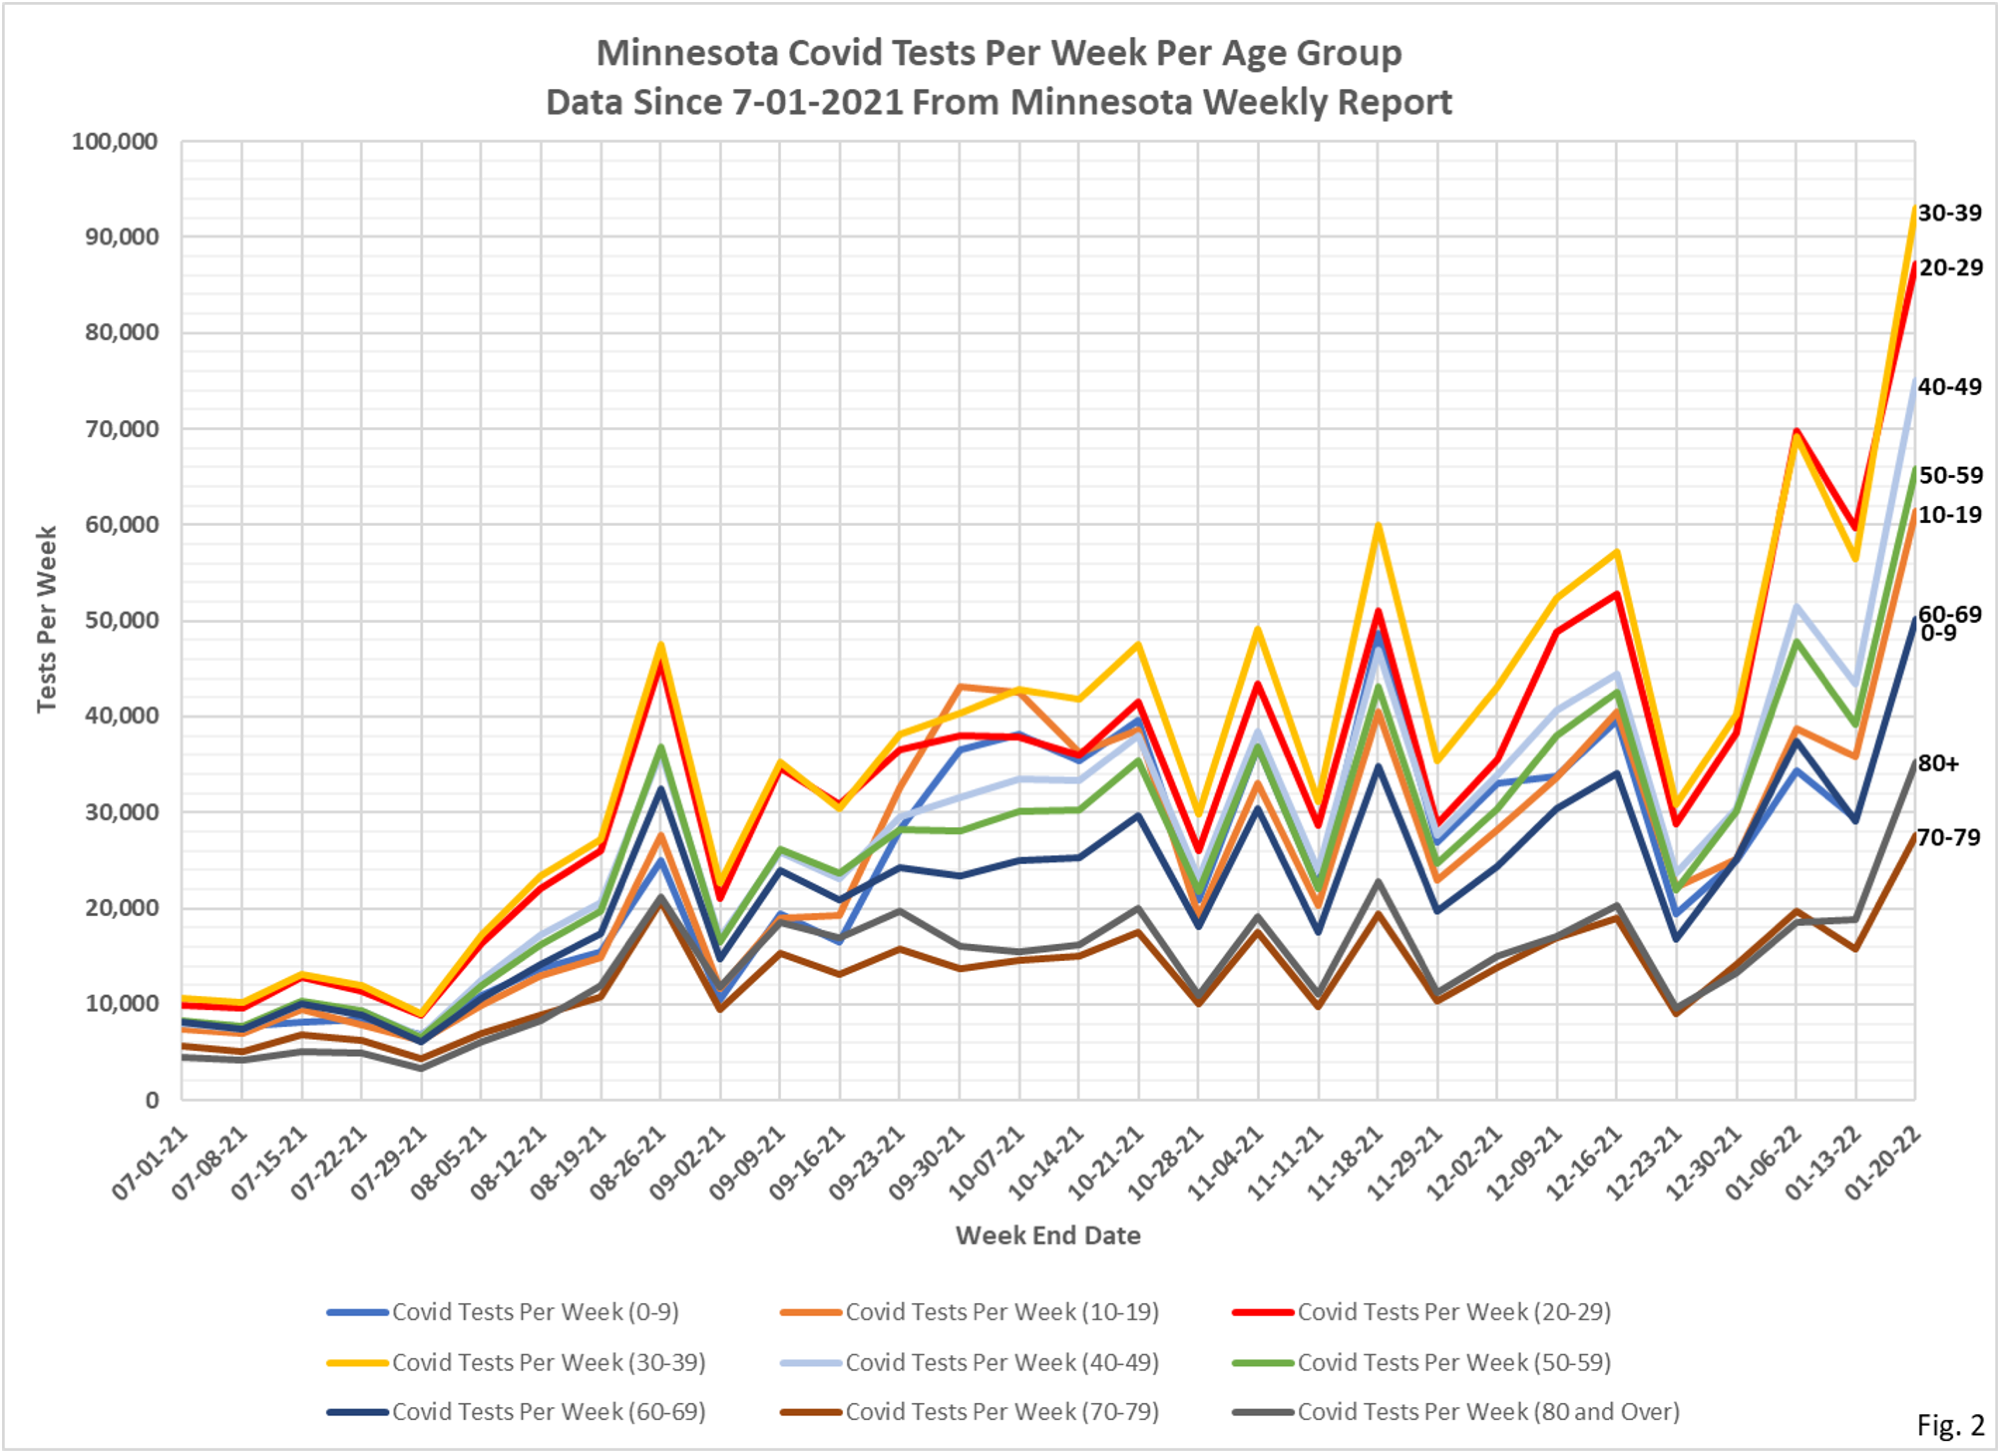
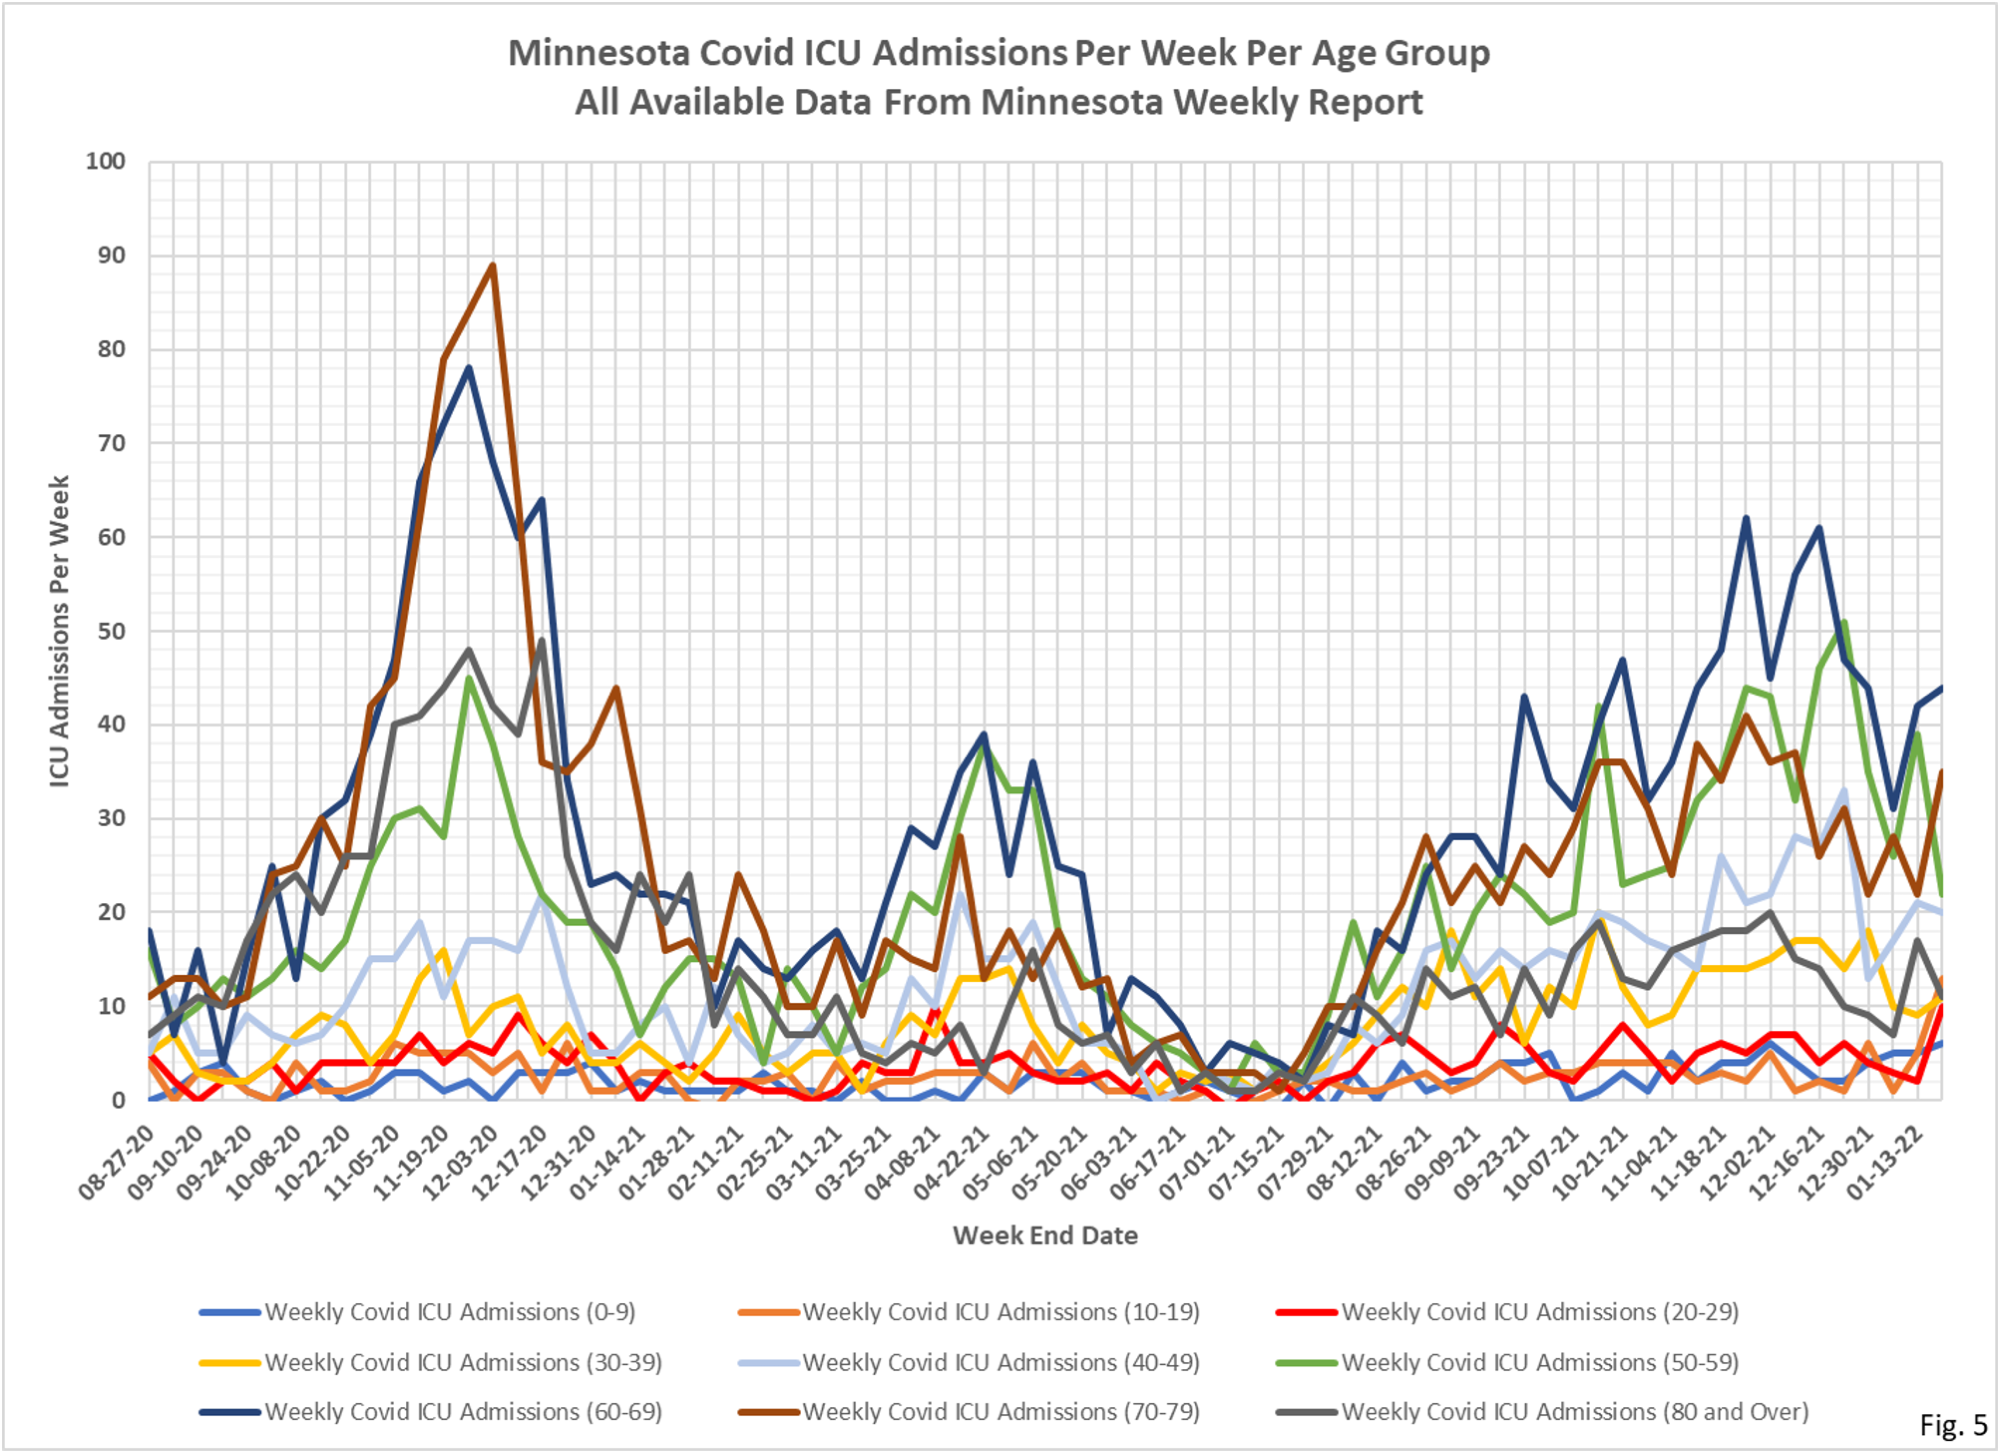
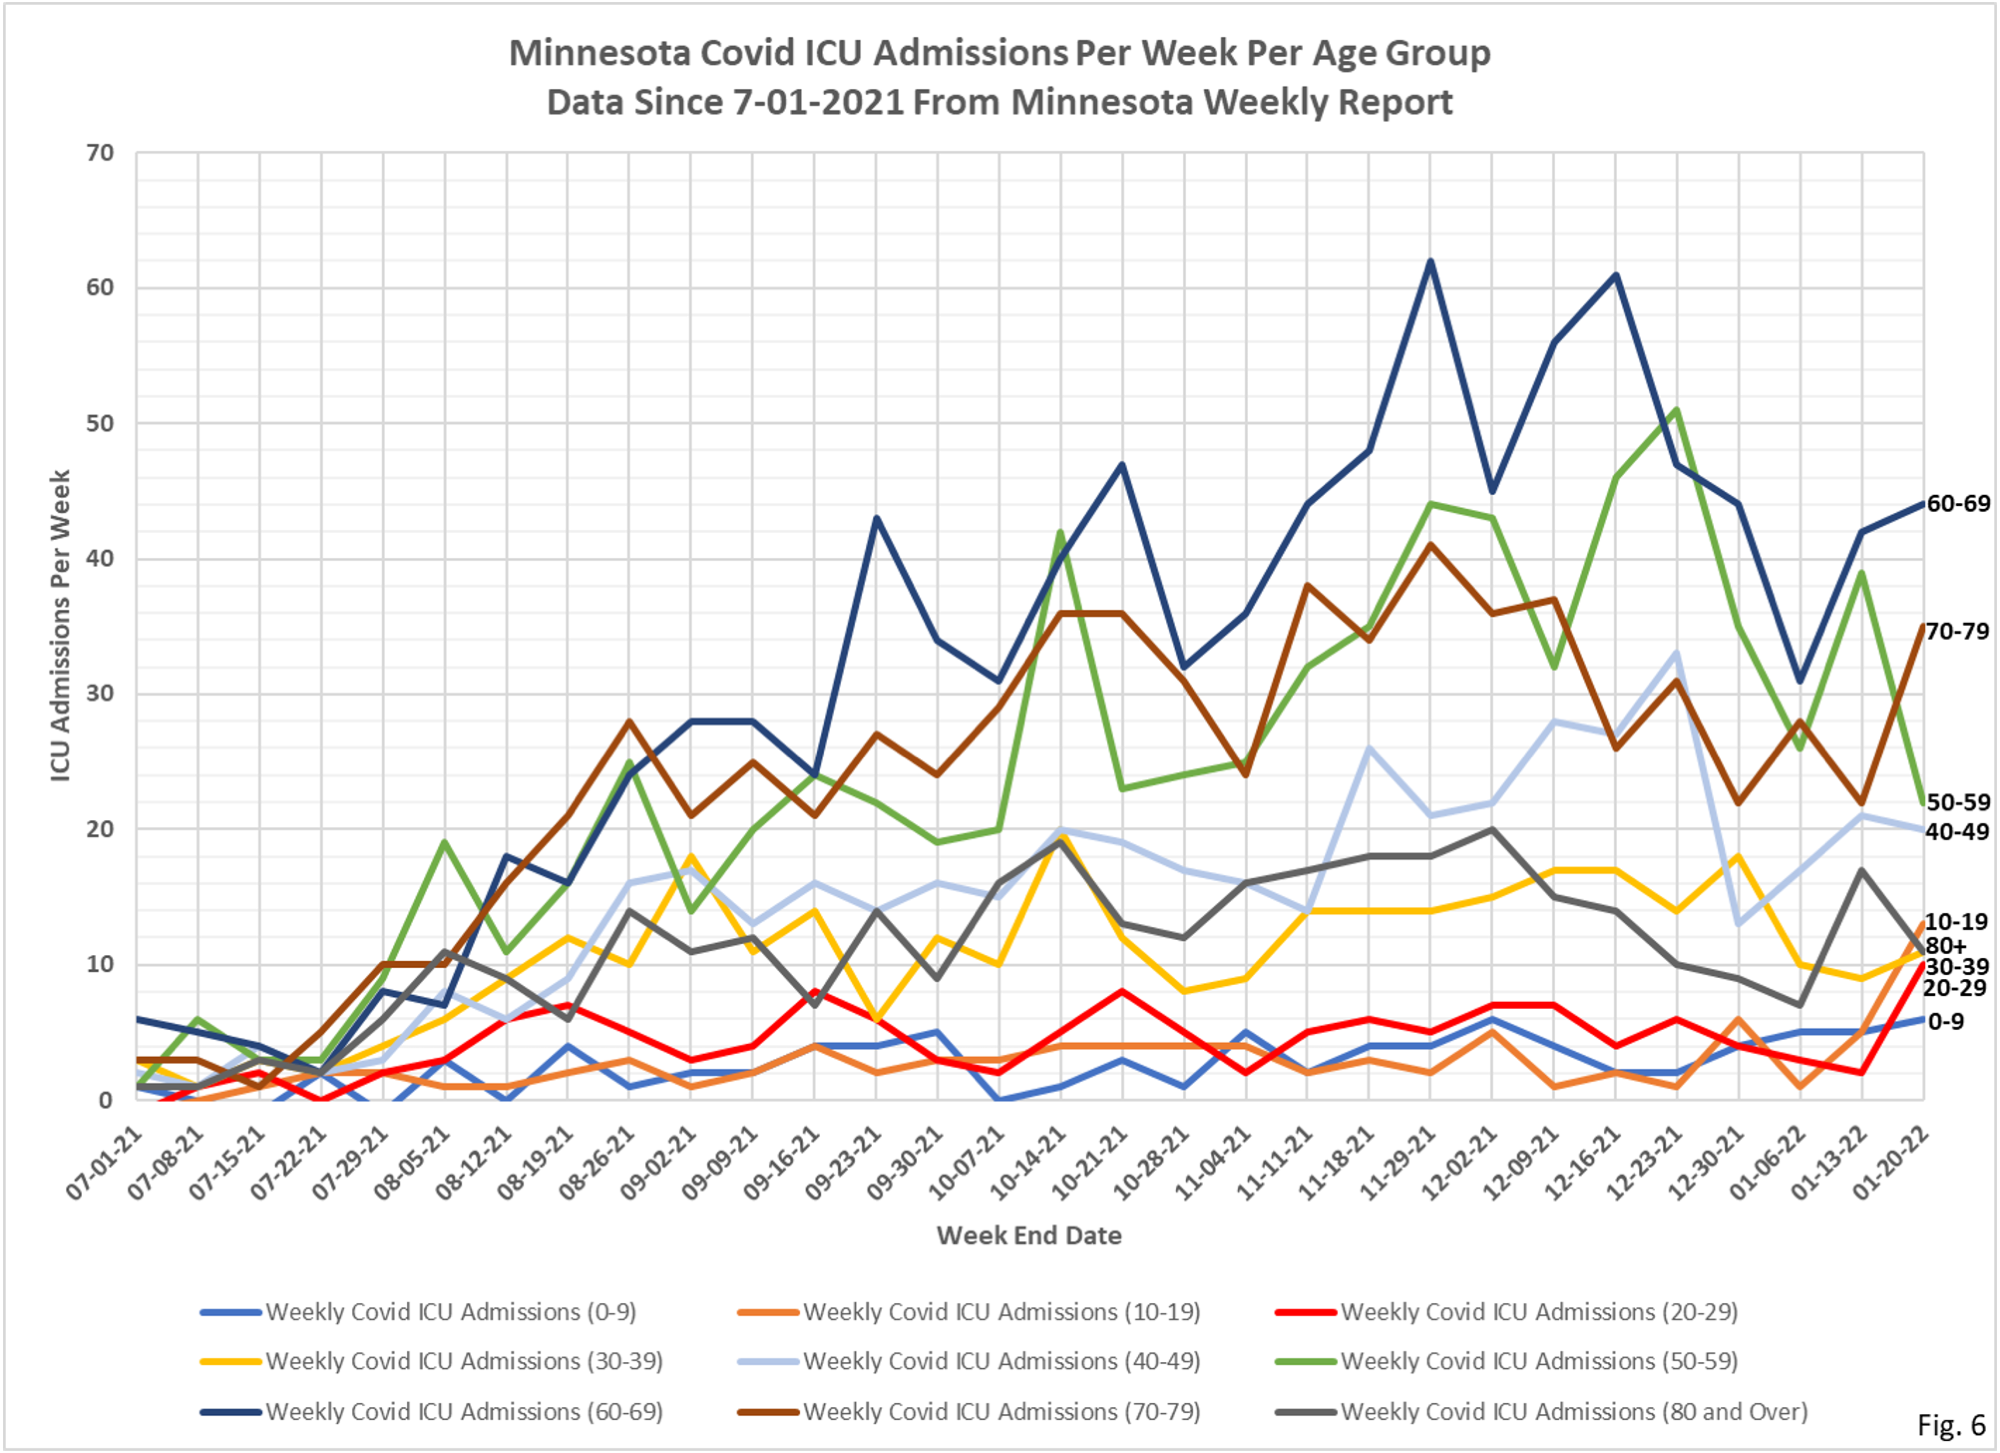
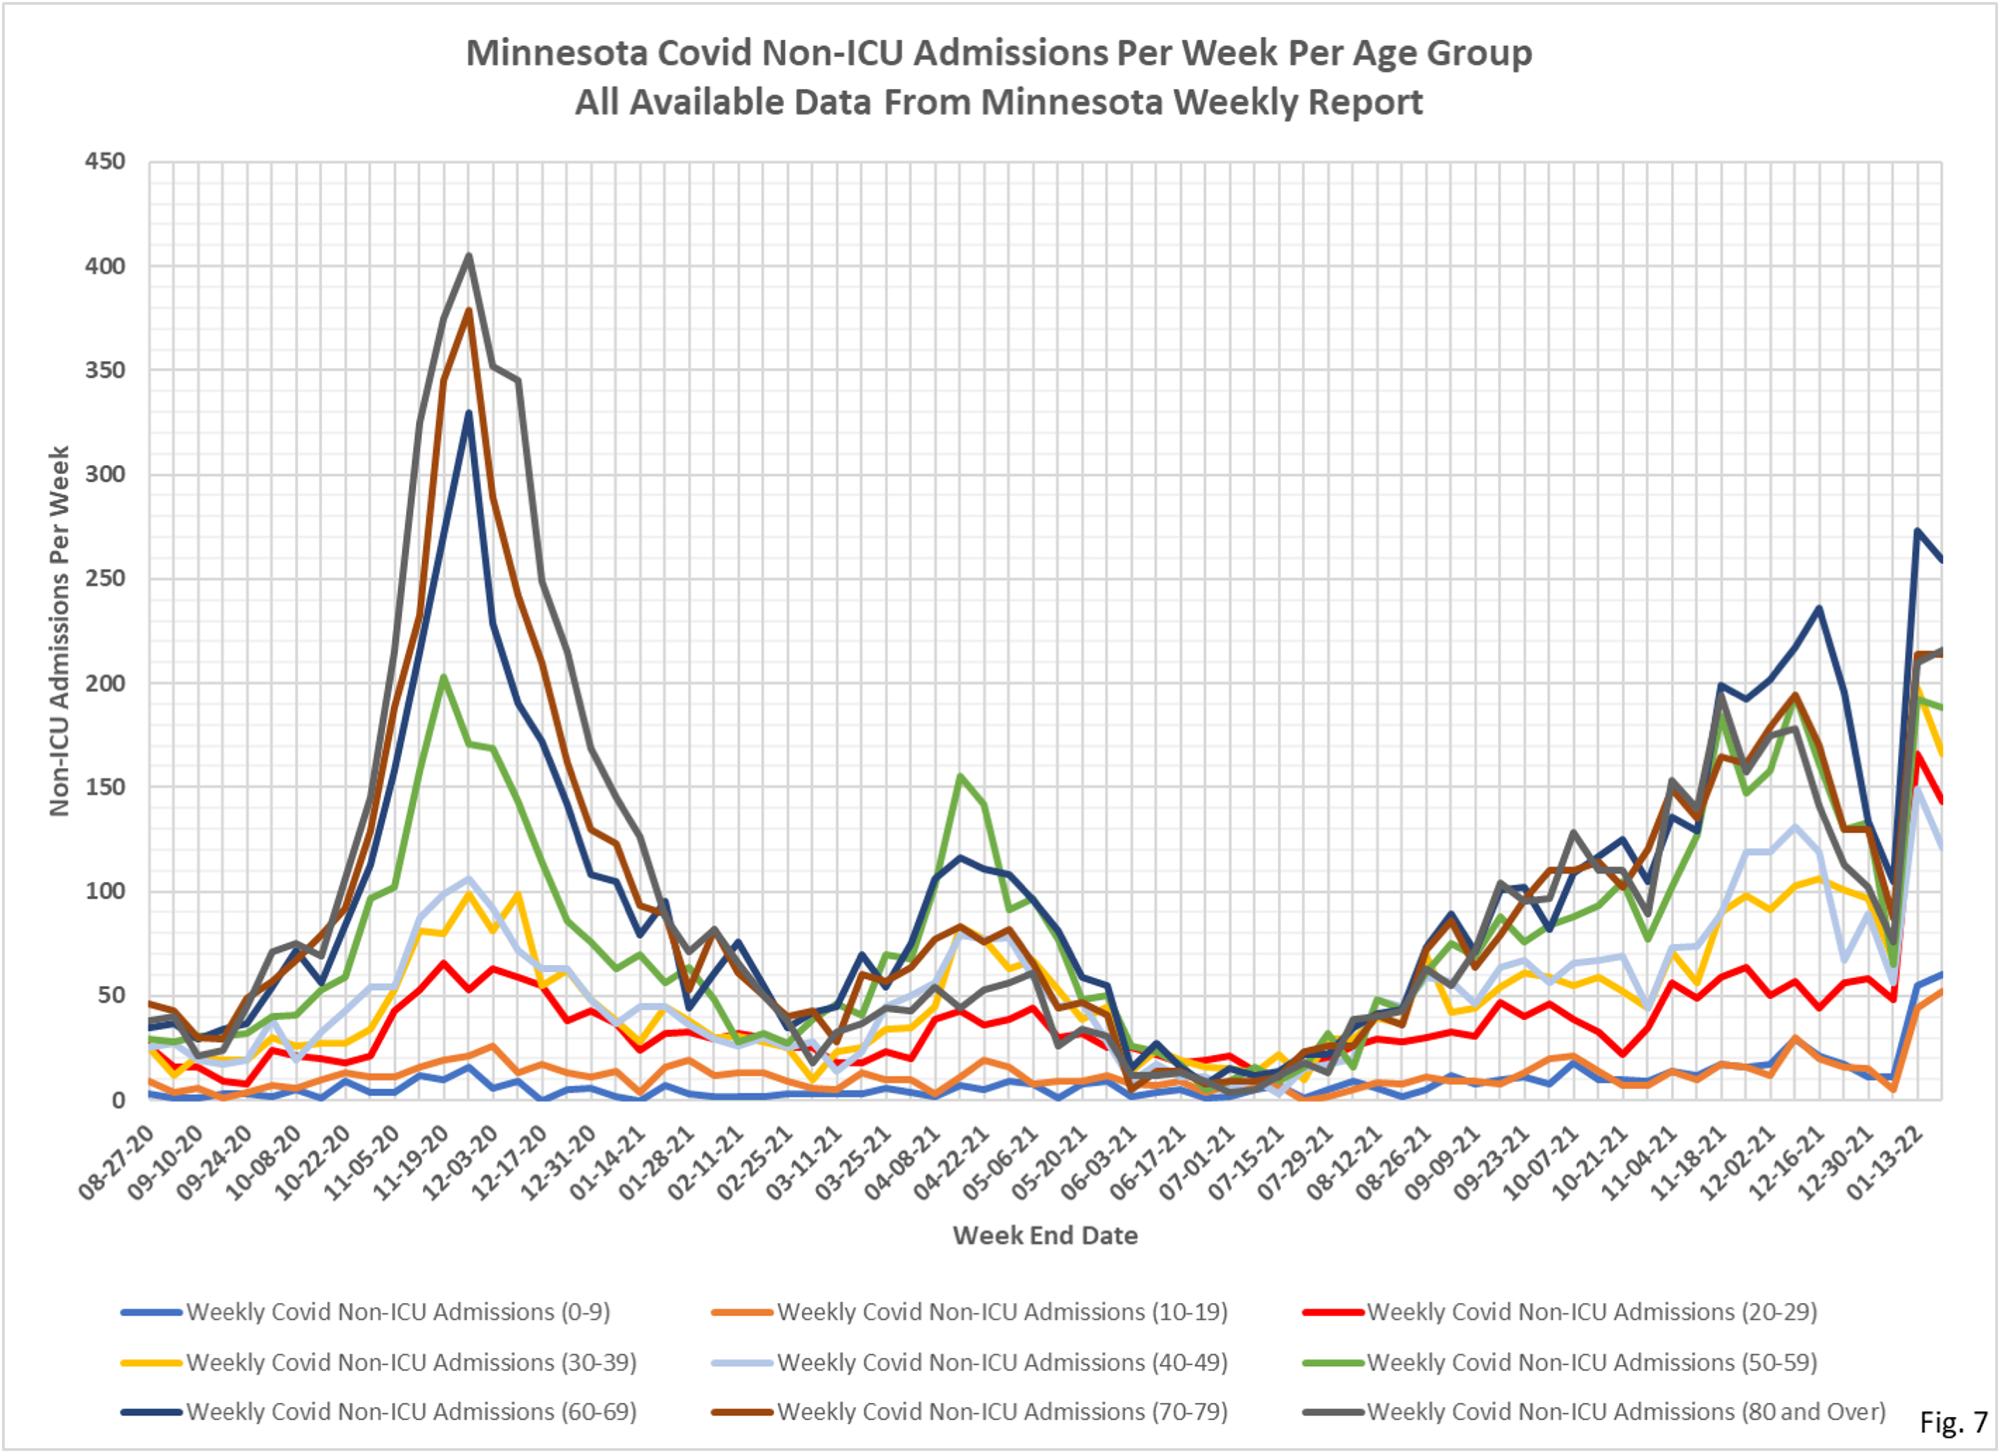
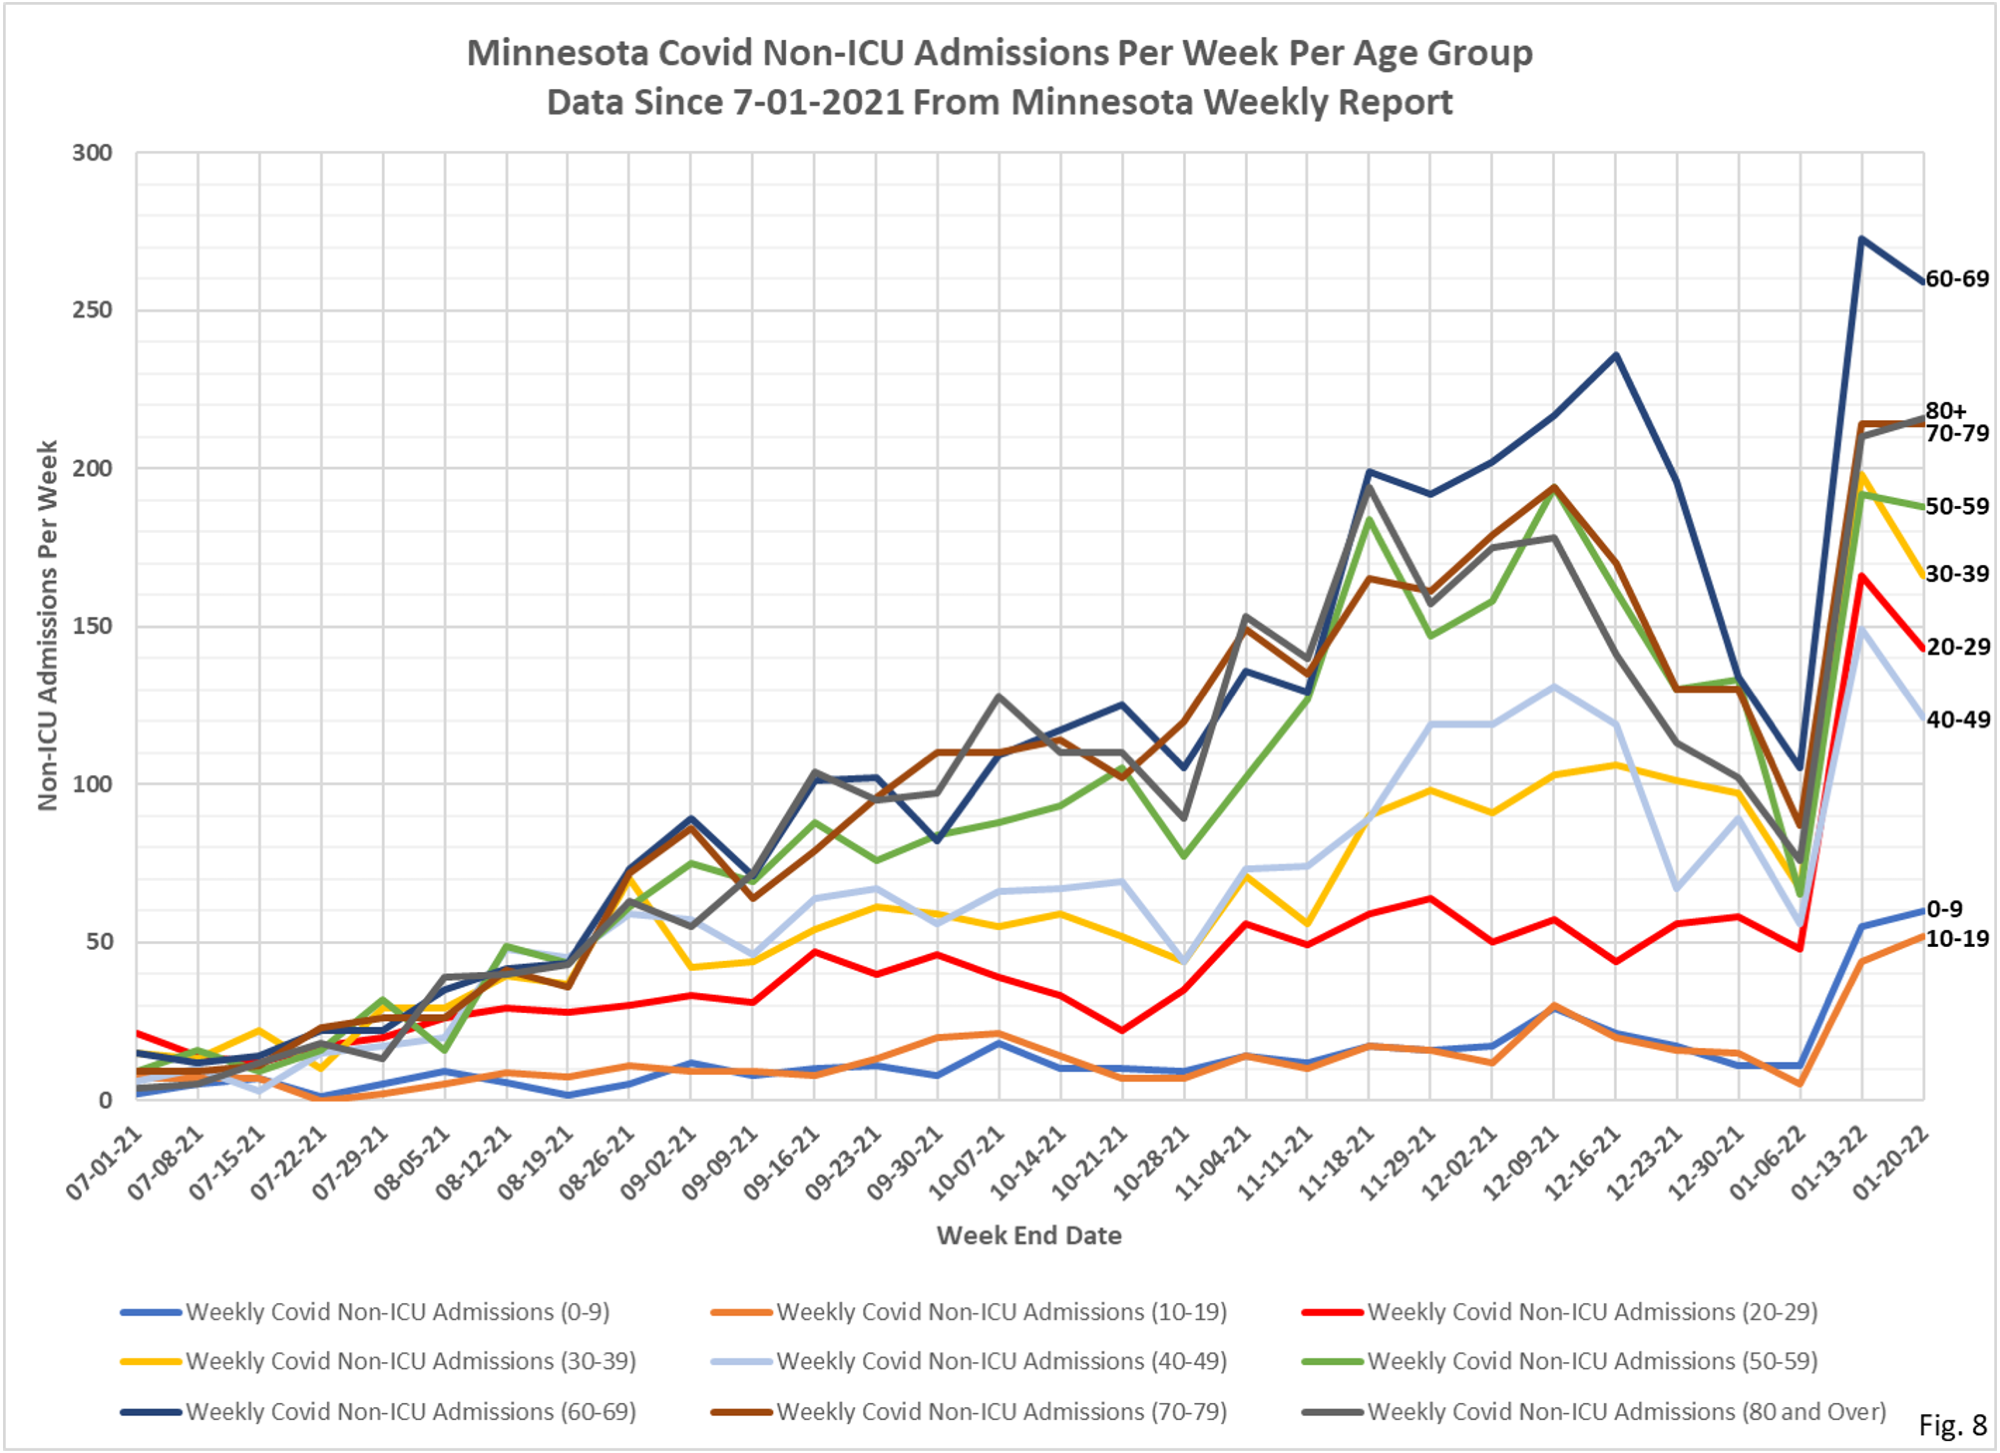
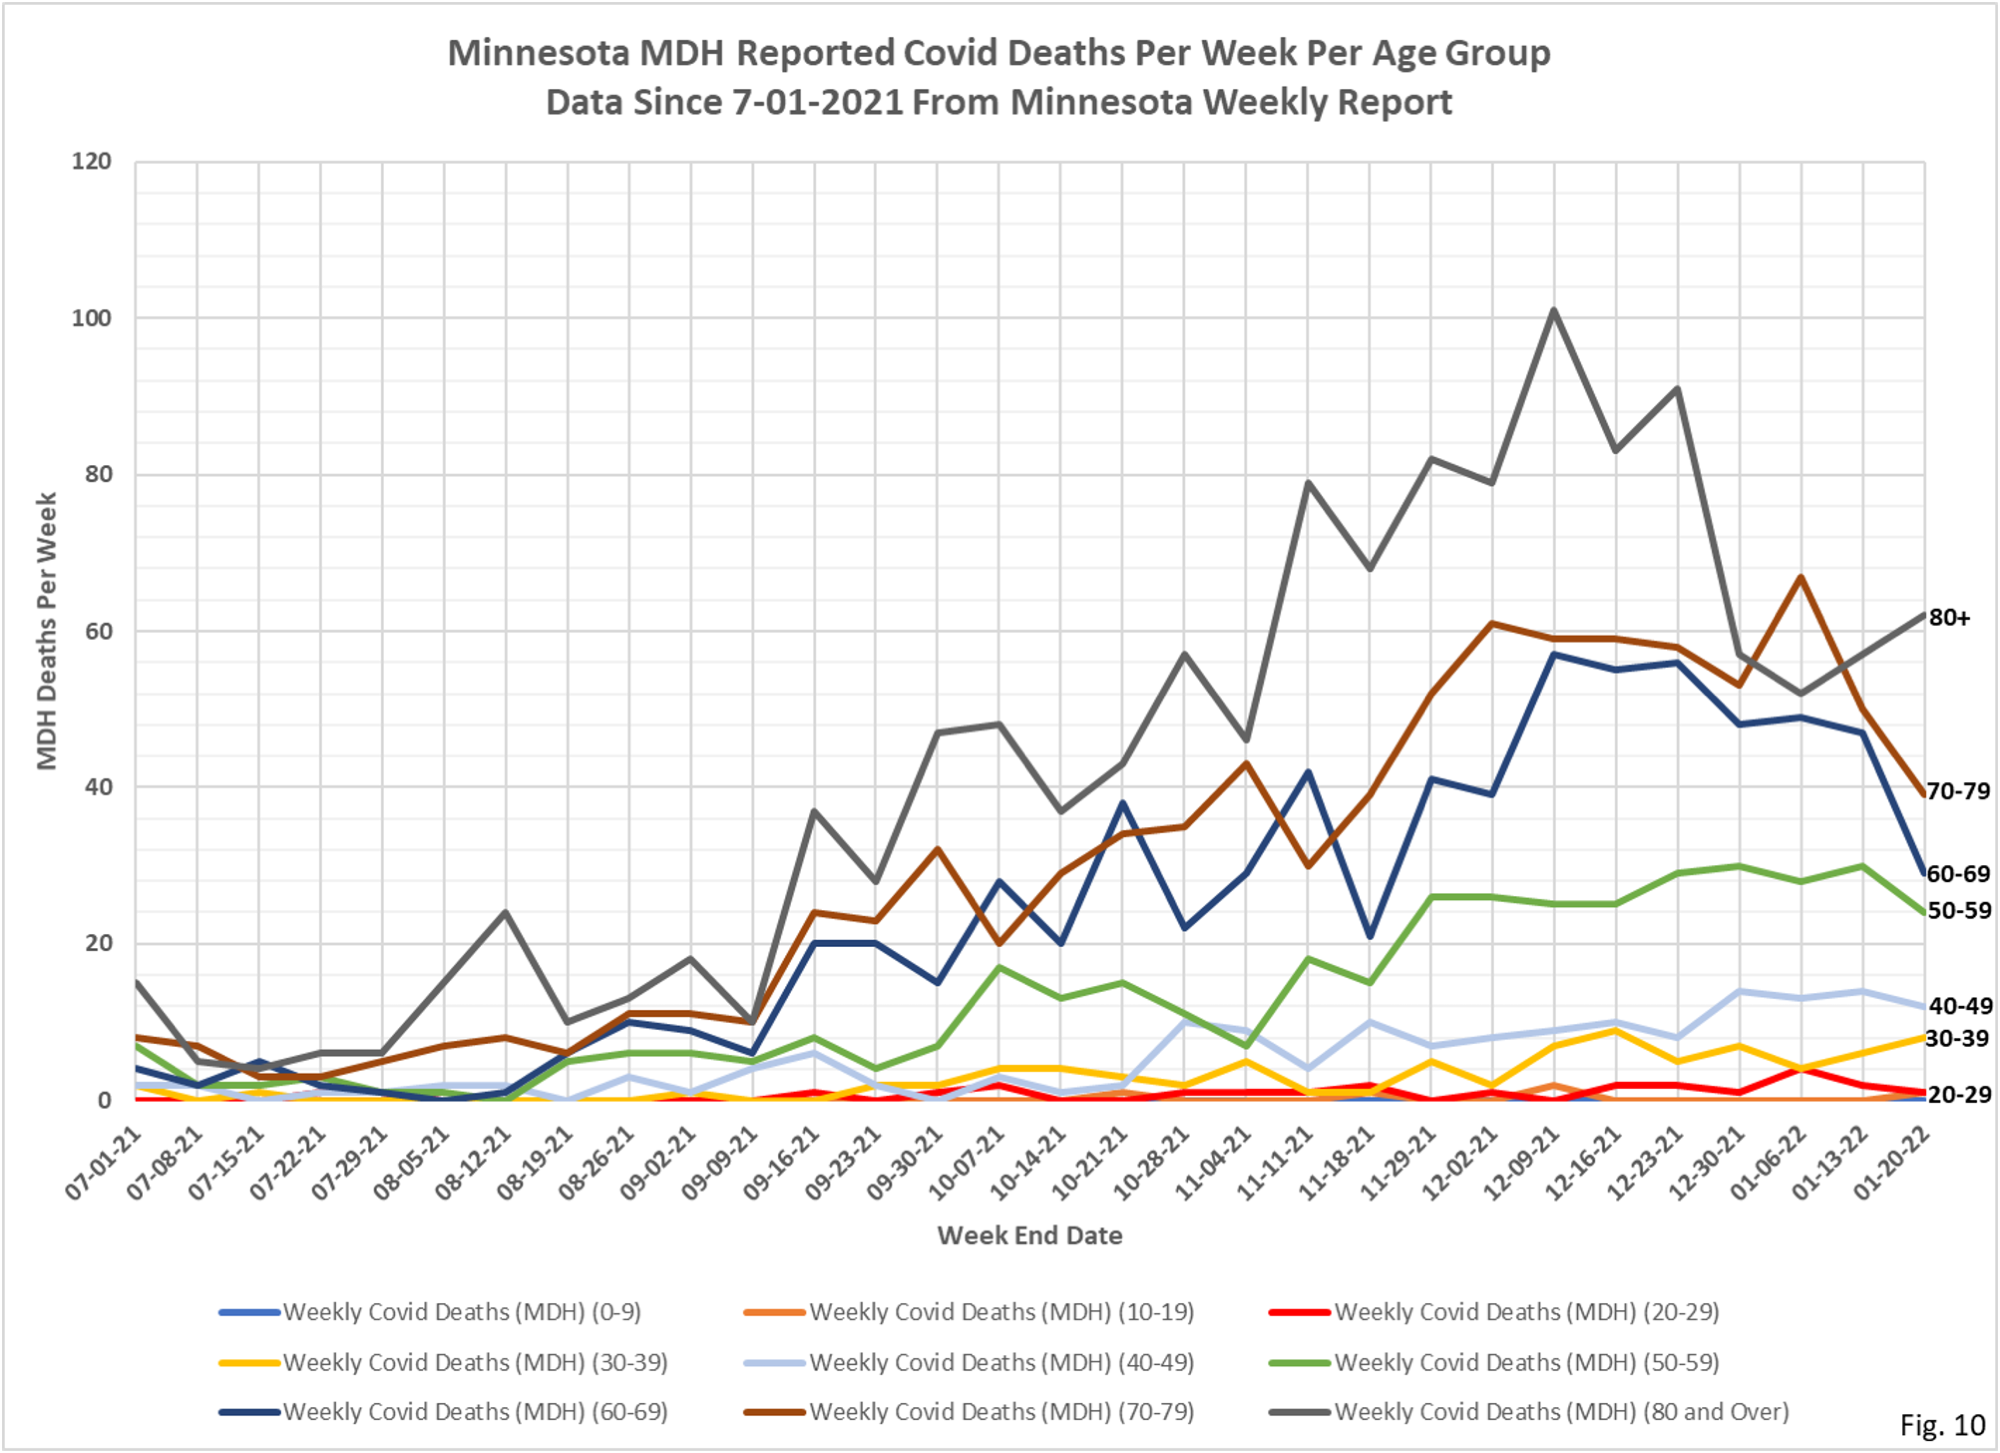
1. There are 2 slides for each set of data, one showing data for the whole pandemic and a second chart showing only data since early July, 2021. Note that the full pandemic slides have different start dates, because Minnesota Department started publishing different data on different dates.
2. The data for the charts on testing, hospital admissions, and deaths comes from the Minnesota Weekly Report (available here: https://www.health.state.mn.us/diseases/coronavirus/stats/index.html). The data in the Weekly Report is presented as cumulative totals for each data type each week. I am taking weekly differences and assembling the data into charts. This data is by date of report, meaning the charts are documenting new events reported this week, even though the underlying event occurred sometime in the past. The data is provided for 5 year age groups, and I am assembling into 10 year age groups to make the charts more readable.
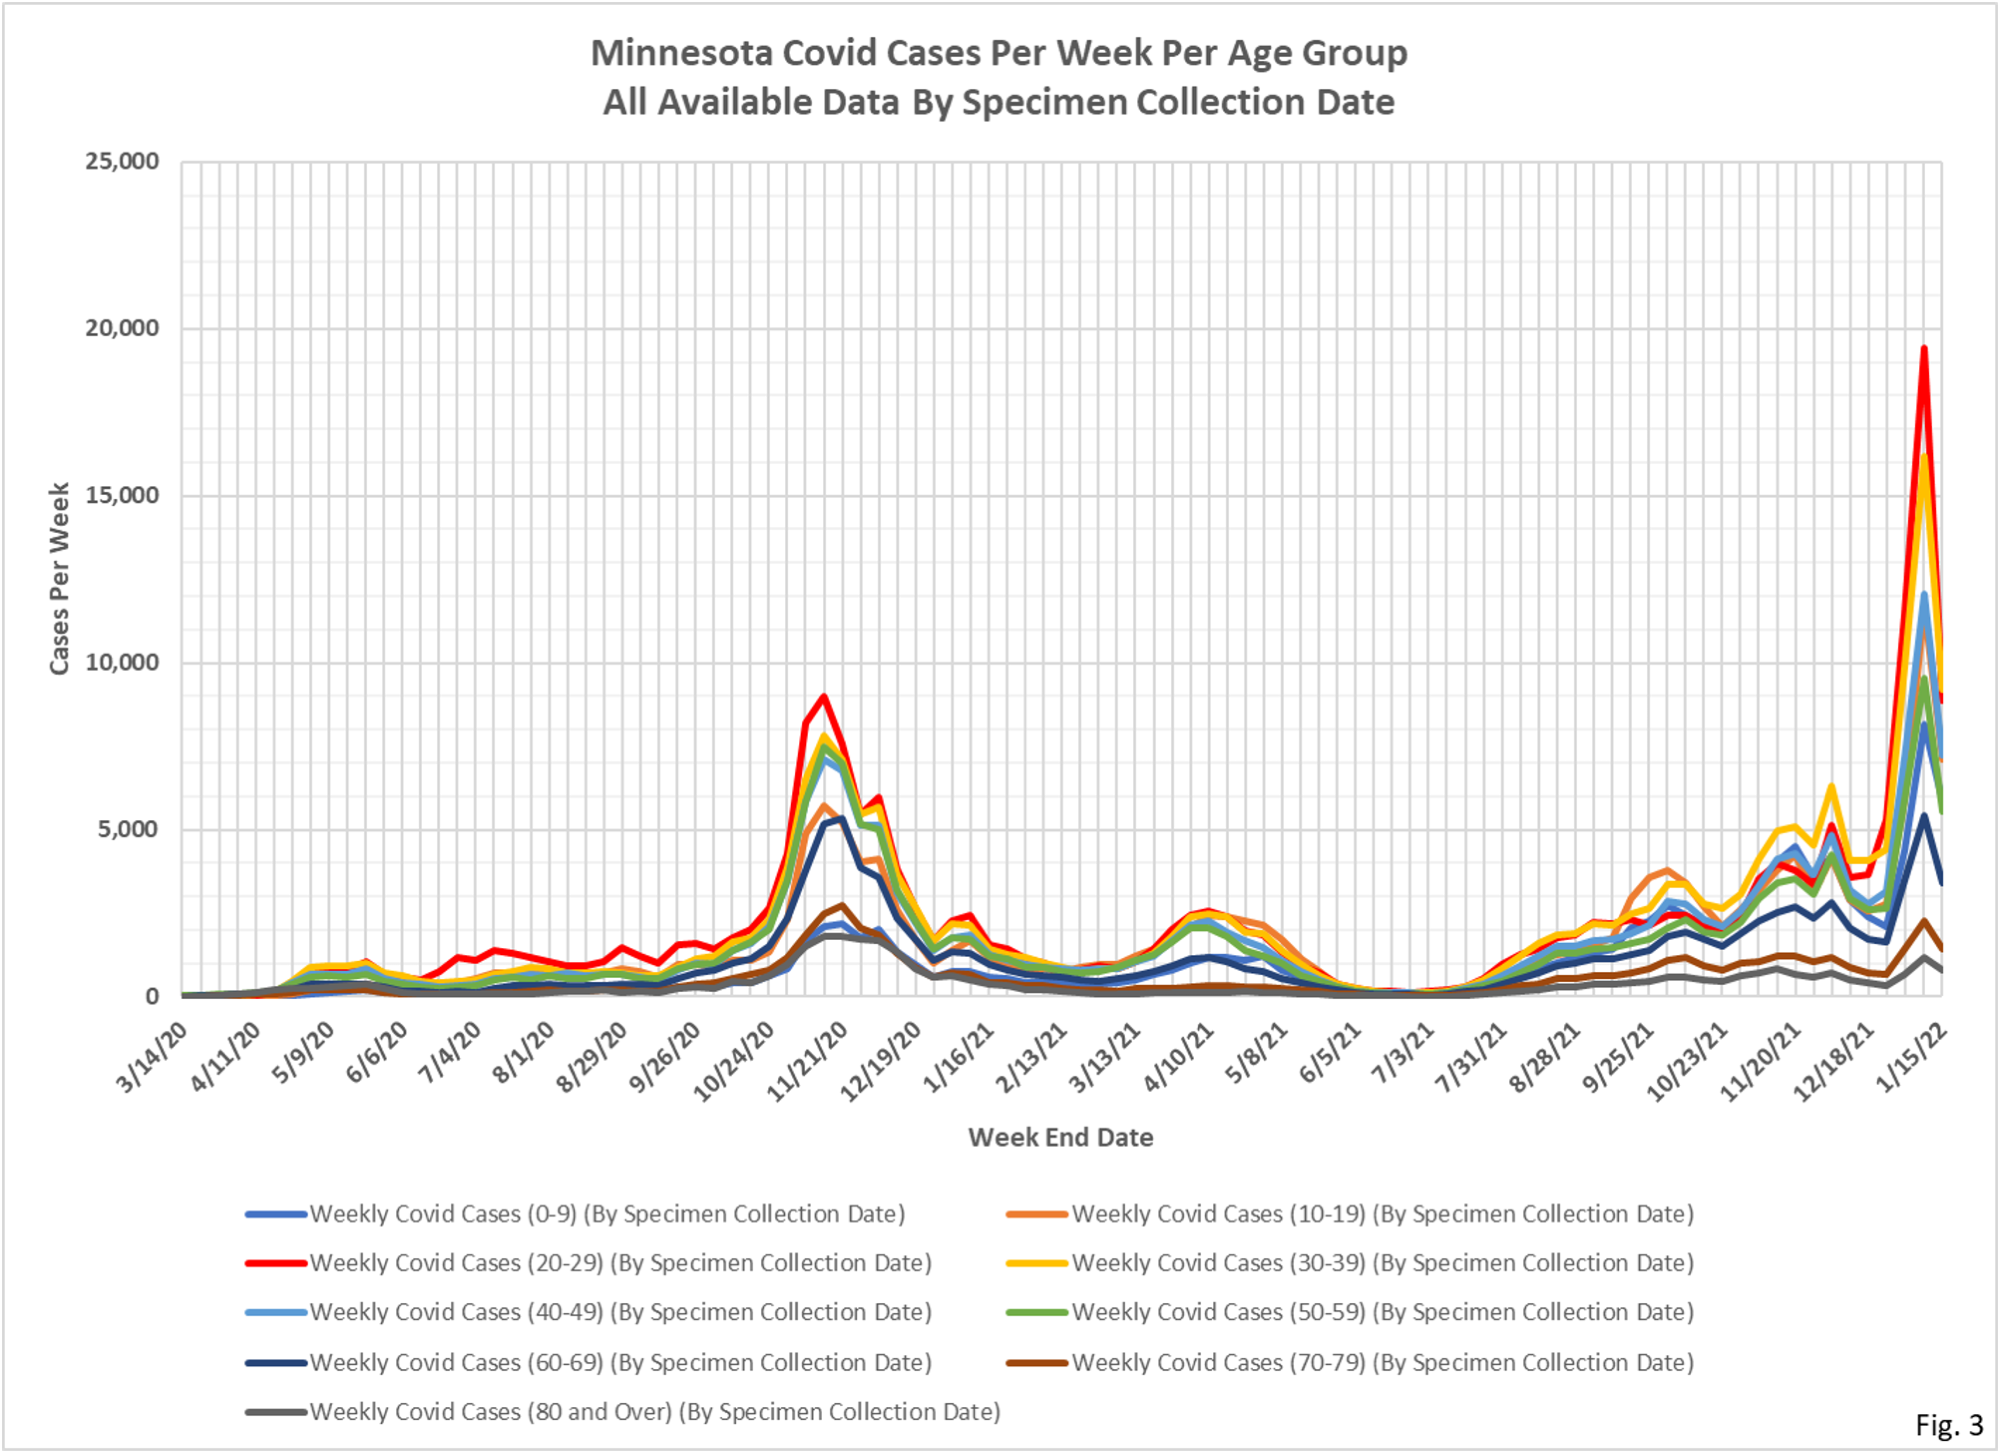
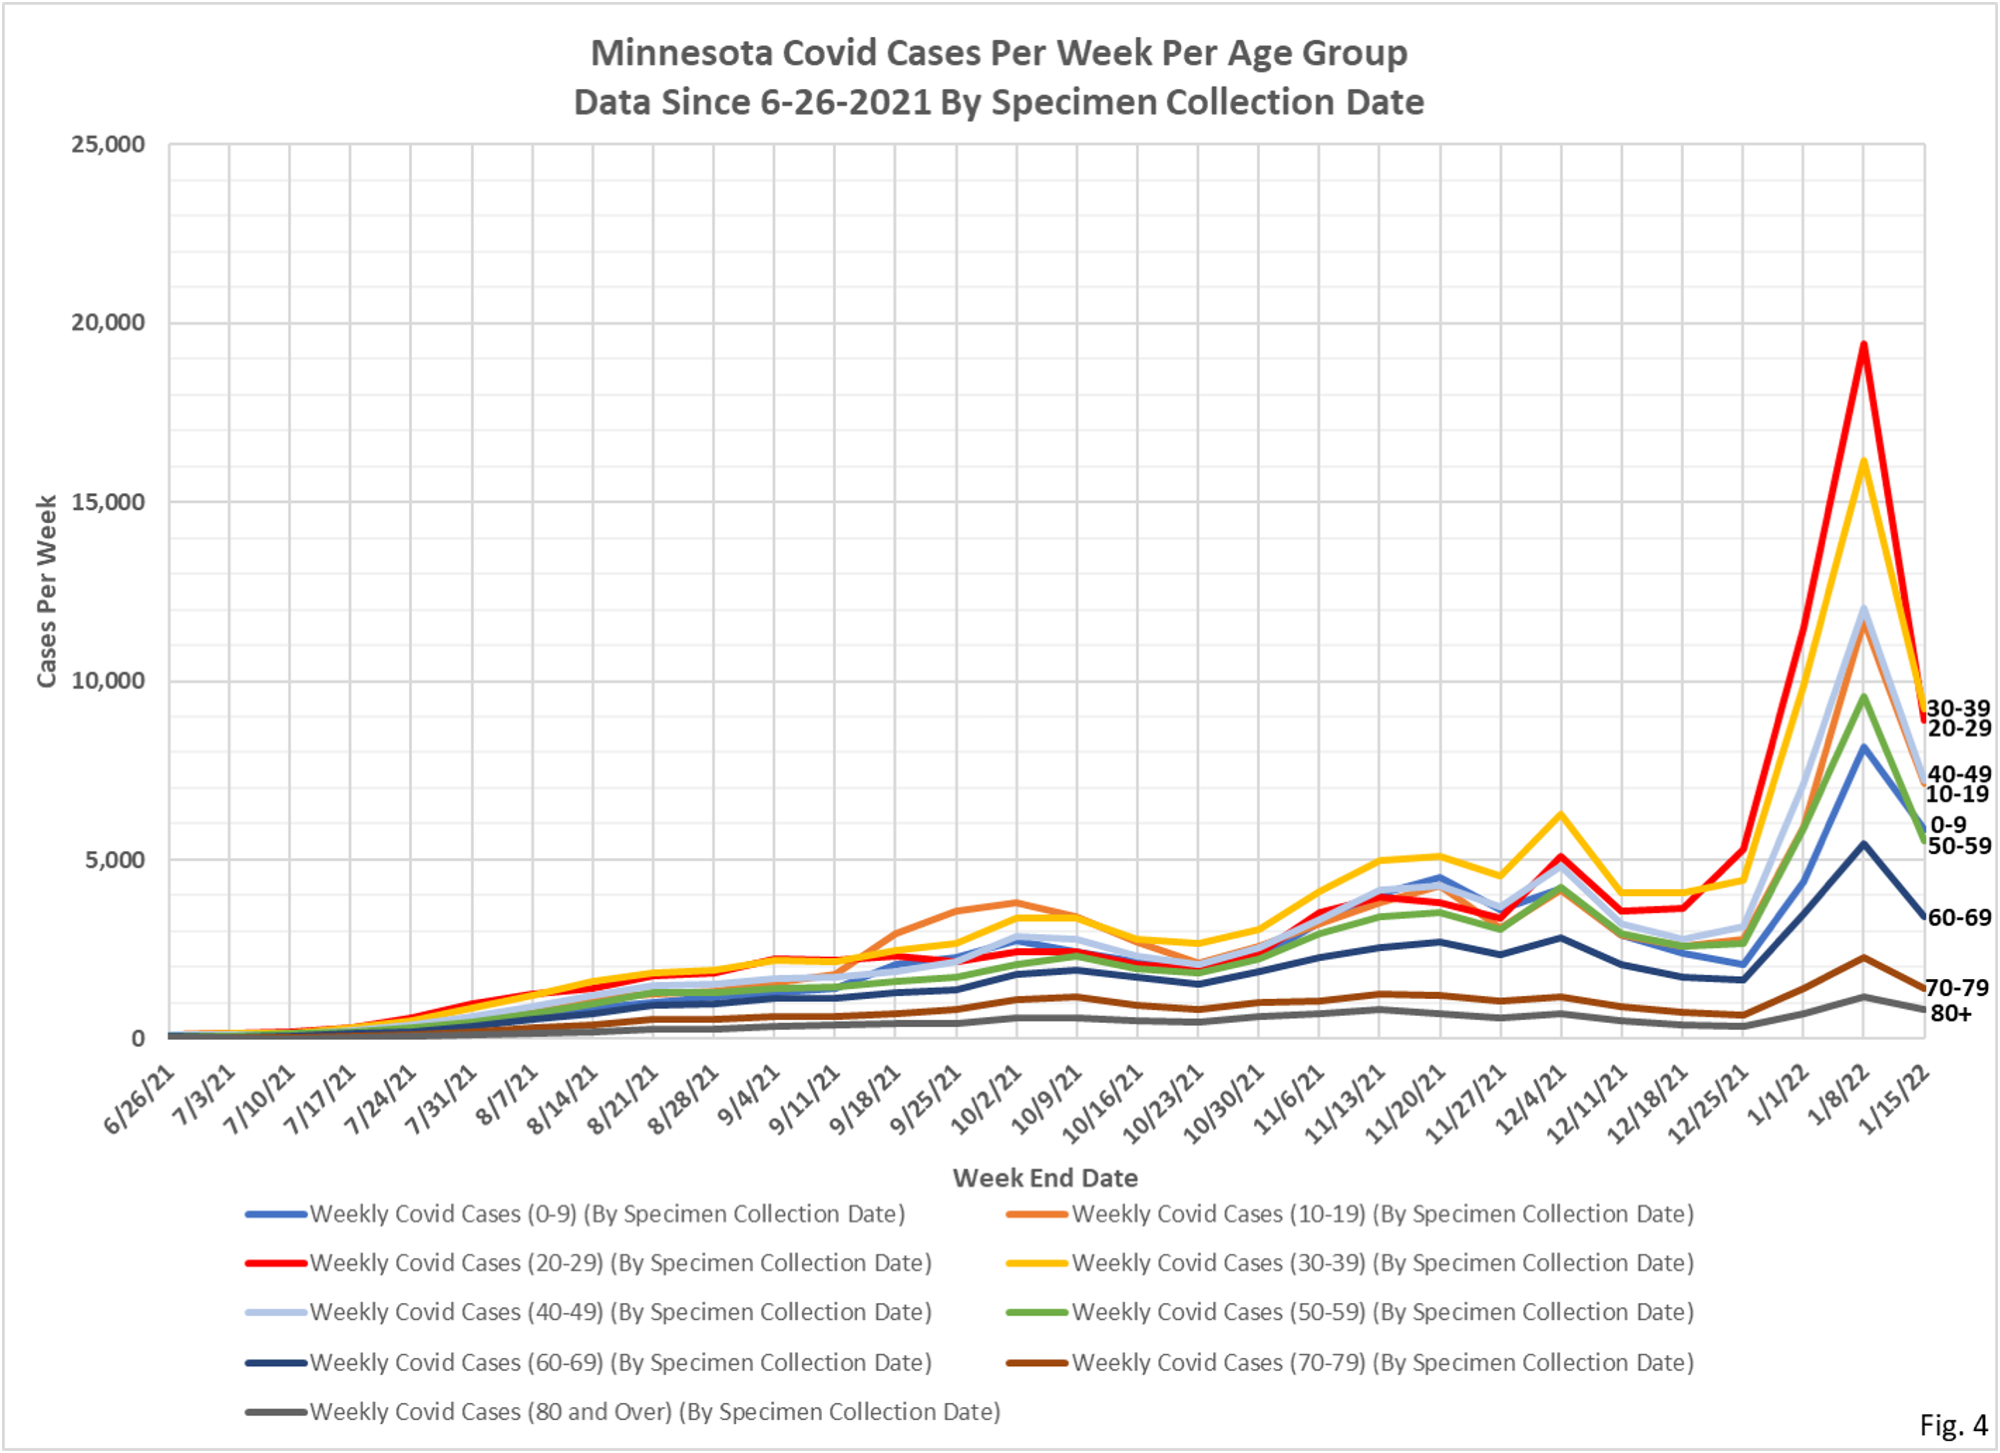
3. The data for the Covid cases per week come from a data file published along with the Minnesota Weekly Report, here: https://www.health.state.mn.us/diseases/coronavirus/stats/index.html#wagscd1 This data is published by date of specimen collection, rather than by date of report as the other data is. The data is provided as cases per week in 5 year age groups. I am compiling the data into 10 year age groups in order for the charts to be more readable. This data is updated by date of specimen collection, so it is possible that past week’s data will be updated.
4. Fig. 1 and 2: Covid Tests Per Week. Reported testing is sharply higher this week, reaching all-time reported high testing levels. This matches the data seen on the Situation Update page, which also recently reached record high levels.
5. Fig. 3 and 4: Covid Cases Per Week. The reported Covid cases this week were sharply lower this week in all age groups. The reported cases on the Situation Update page peaked on Jan.9, but there is evidence that processing of Covid tests is lagging more than usual, so it is entirely possible that when all cases are reported that this week’s drop in cases will turn out to be less dramatic than it appears, especially given the data on presumptive positives provided in the situation report on January 21. Given the magnitude of the drop in cases, and the size of past data dumps as cases are processed, it is possible that a new high in cases could be established. Considering that the cases the week ending 1/08/22 were reported as 49,484 last week, and 85,881 this week (a revision of 36,397) then next week’s report could show 1/15/22 cases exceeding 1/08/22, rather than being sharply lower as these charts show. Total cases for the week were reported as 49,484, a 70% decrease from last week’s revised total of 85,881 cases. This is the highest total cases per week reported at any time during the pandemic.
6. Fig. 5 and 6: ICU Covid Admissions Per Week. ICU Covid admissions were mixed again this week, with the 10-19 and 20-29 age groups showing notable increases and the 50-59 and 80+ age groups showing sizeable decreases. Total ICU admissions for the week were 172, an increase of 10 from the 162 admissions the prior week.
7. Fig. 7 and 8: Non-ICU Covid Admissions Per Week. The sharp rise in Non-ICU Covid admissions seen last week has levelled off, with all groups ranging from slightly up to modestly down. Total Non-ICU Covid admissions for the week were 1419, a decrease of 82 admissions from the prior week.
8. Fig. 9 and 10: Covid Deaths Per Week. Total reported Covid deaths for the week were 176, a decrease of 30 from the 206 reported deaths the week before. The deaths per age group were higher in order of age, as seen throughout most of the pandemic.