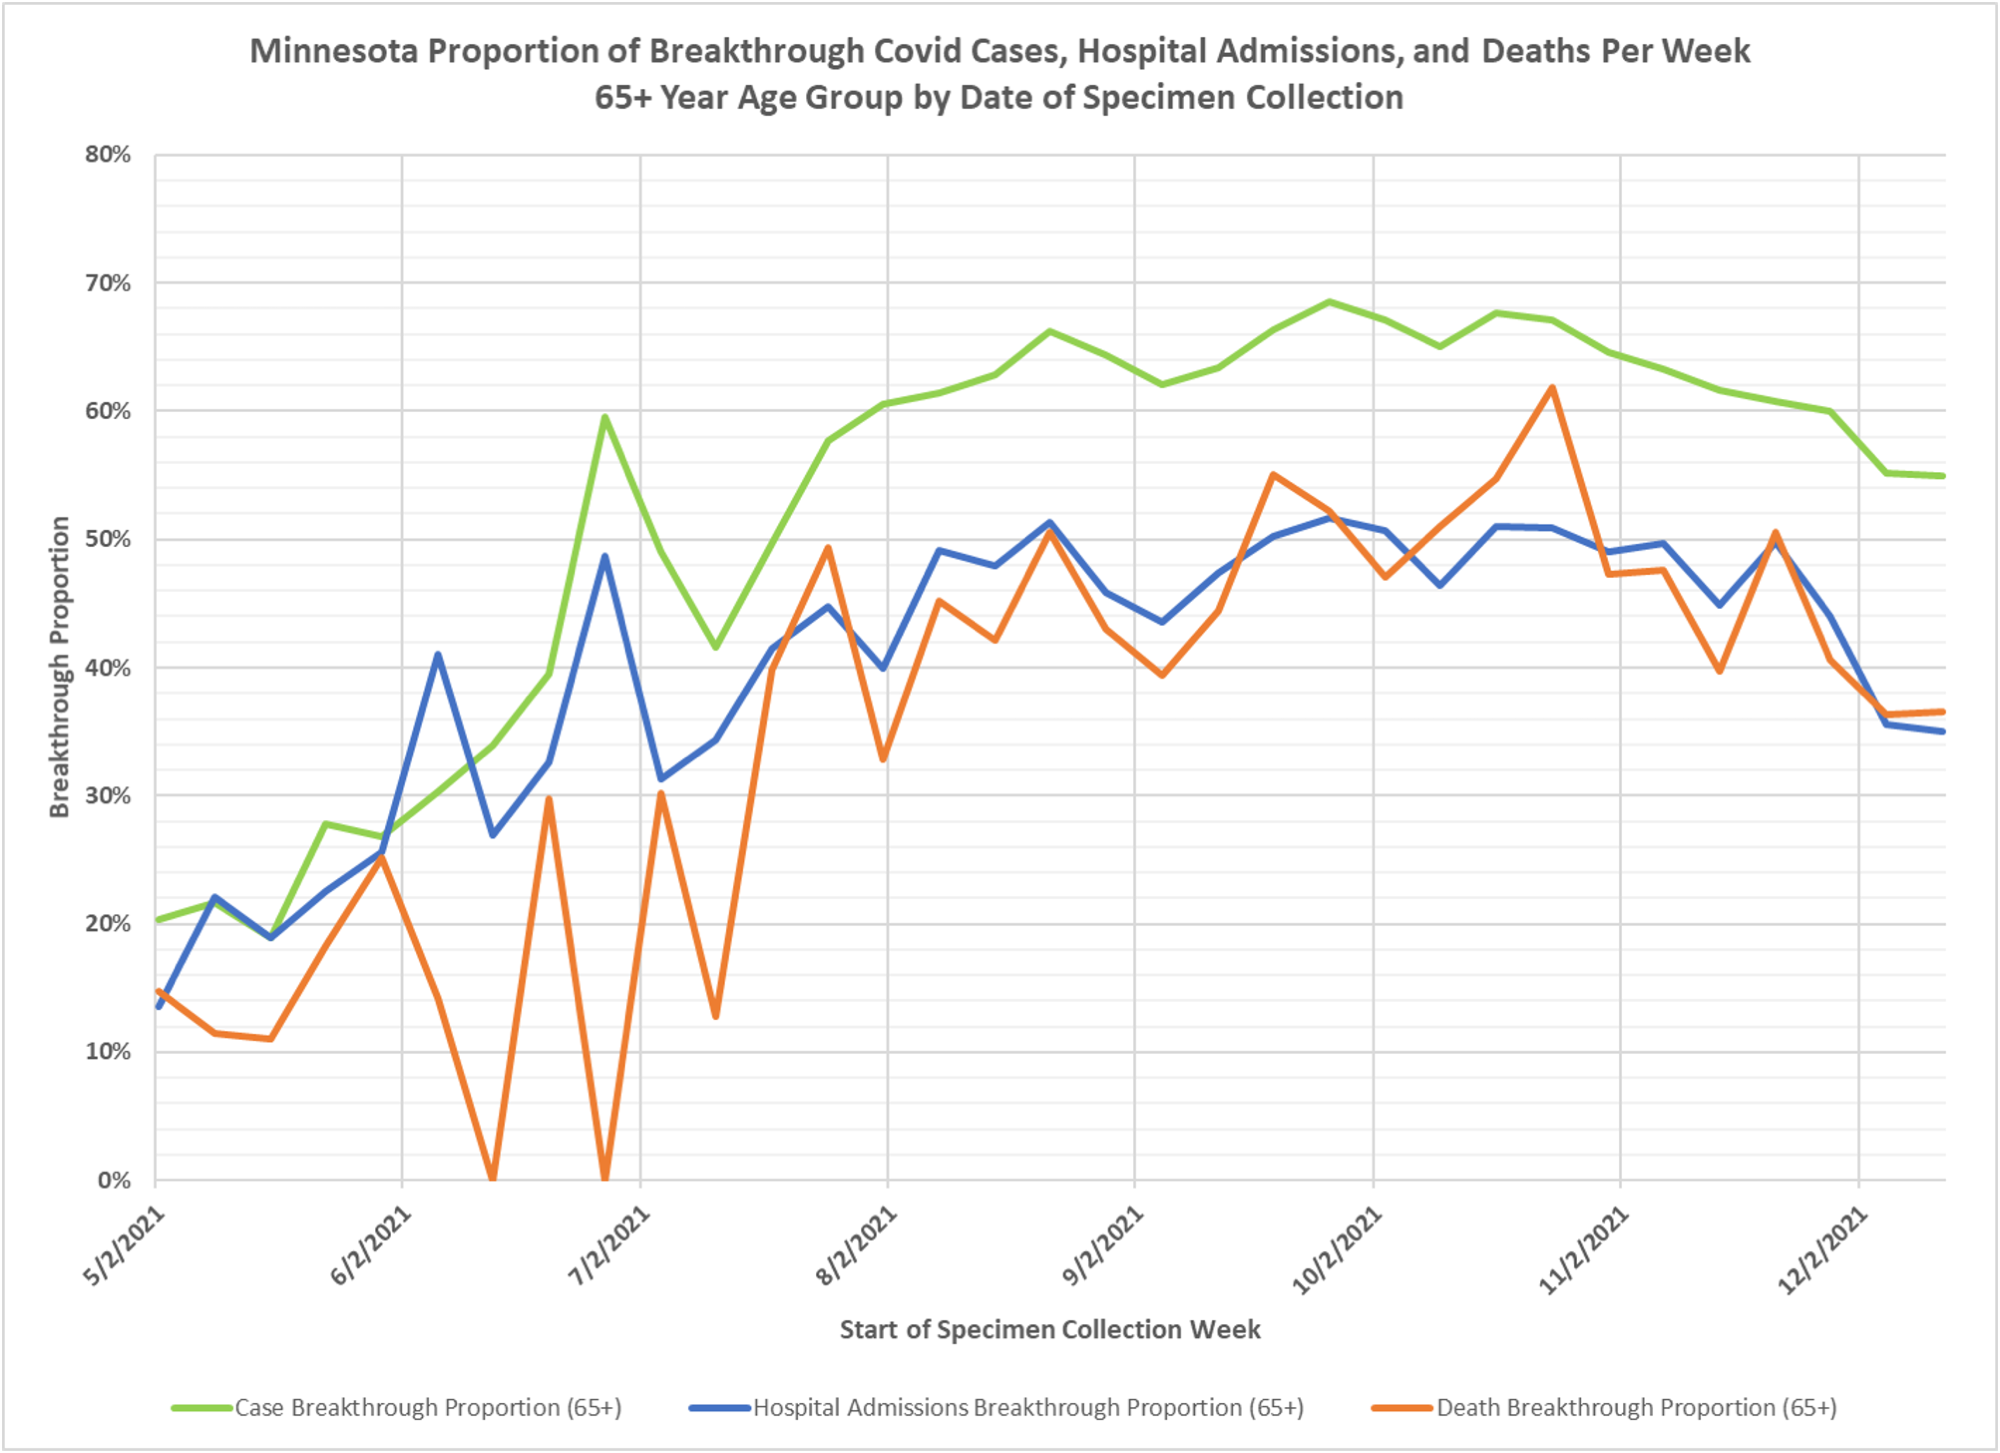
Breakthrough files and charts updated, although still likely very lagged and still undercounting breakthru events. Note that over 50% of cases in the heavily vaxed older groups are in among those vaxed. Most of the breakthru cases and other events reported this week were from several weeks ago. Again, I suspect that right now, at this moment, most cases are in the fully vaxed.
Dave’s notes:
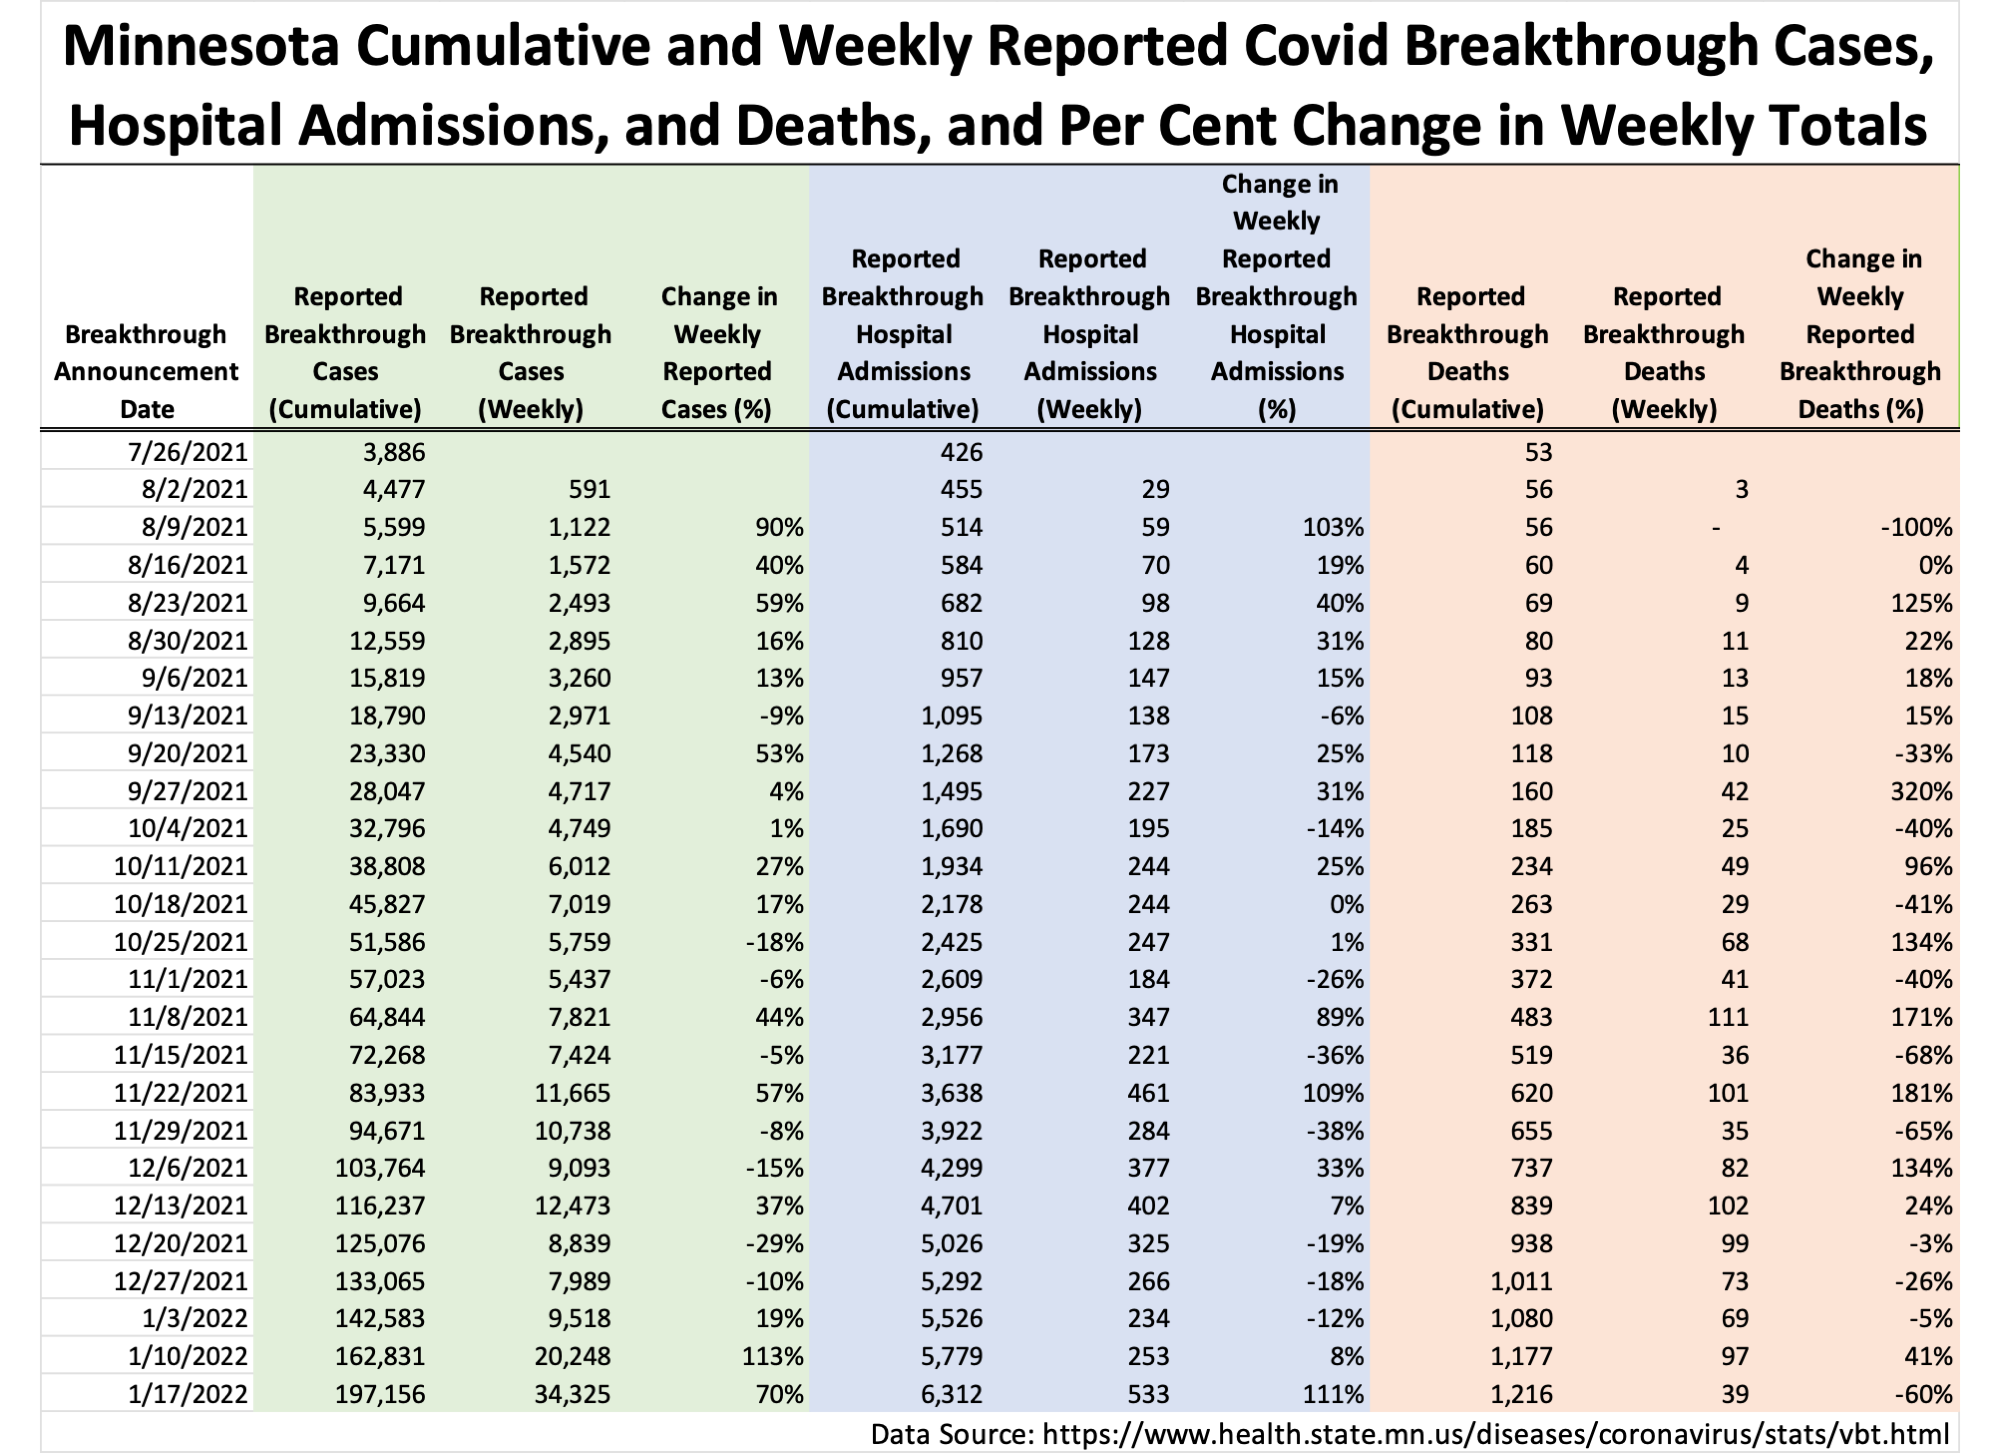
1. The table and charts are updated for new data released by Minnesota Department of Health (MDH) on 1/18/2022, adding data for the week starting 12/12/2021. The data source for the data on Slide 1 is the cumulative breakthrough cases, hospitalizations, and deaths published on the MDH COVID-19 Vaccine Breakthrough Weekly Update https://www.health.state.mn.us/diseases/coronavirus/stats/vbt.html
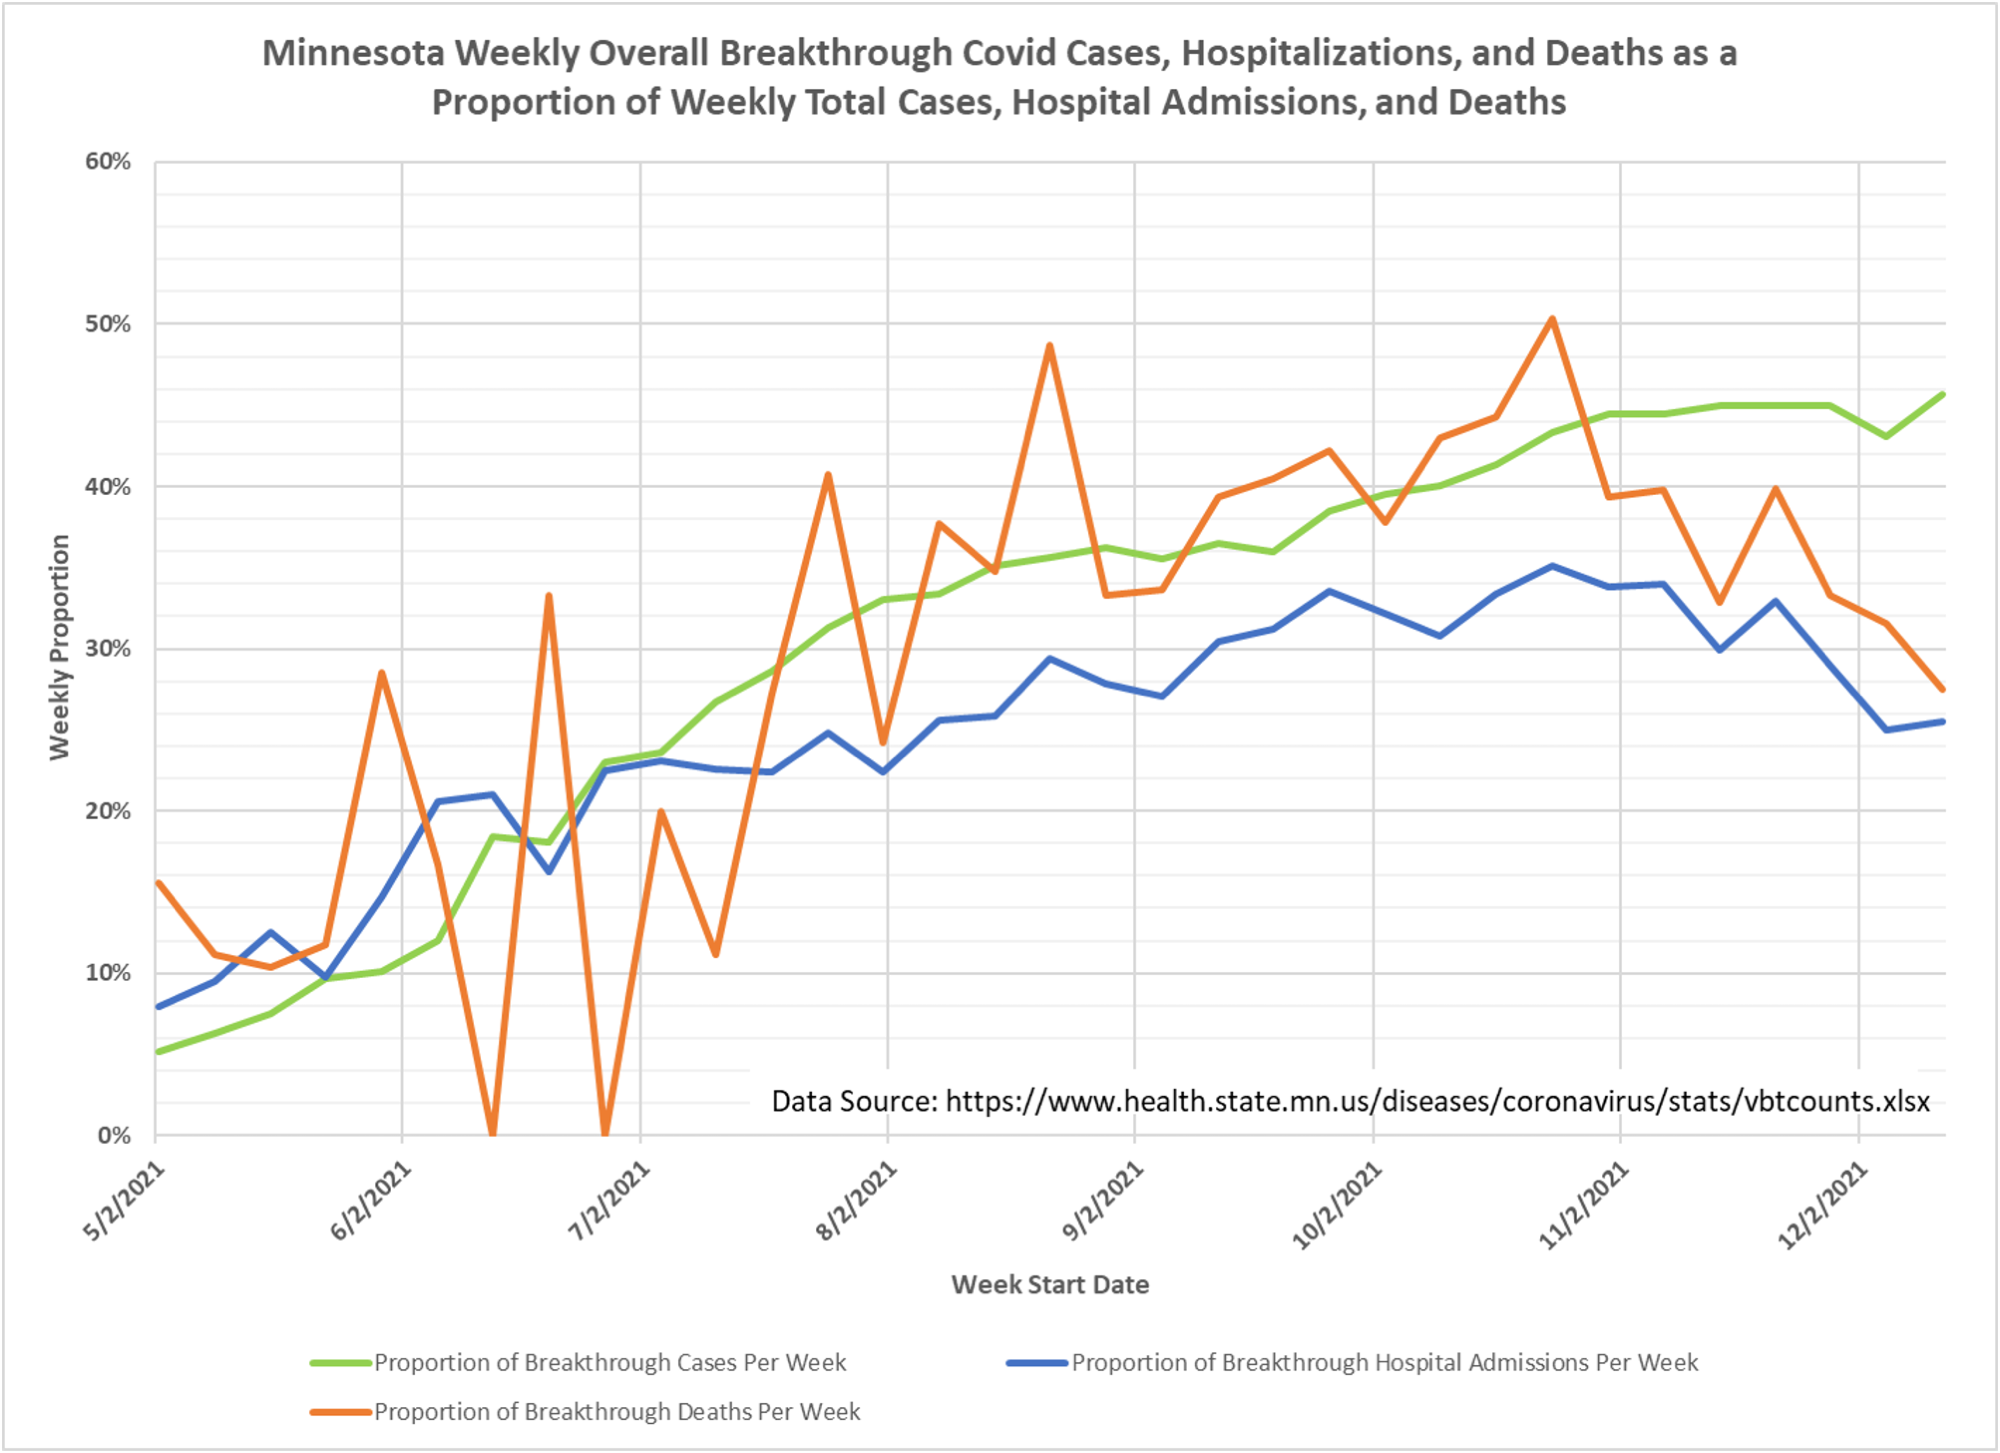
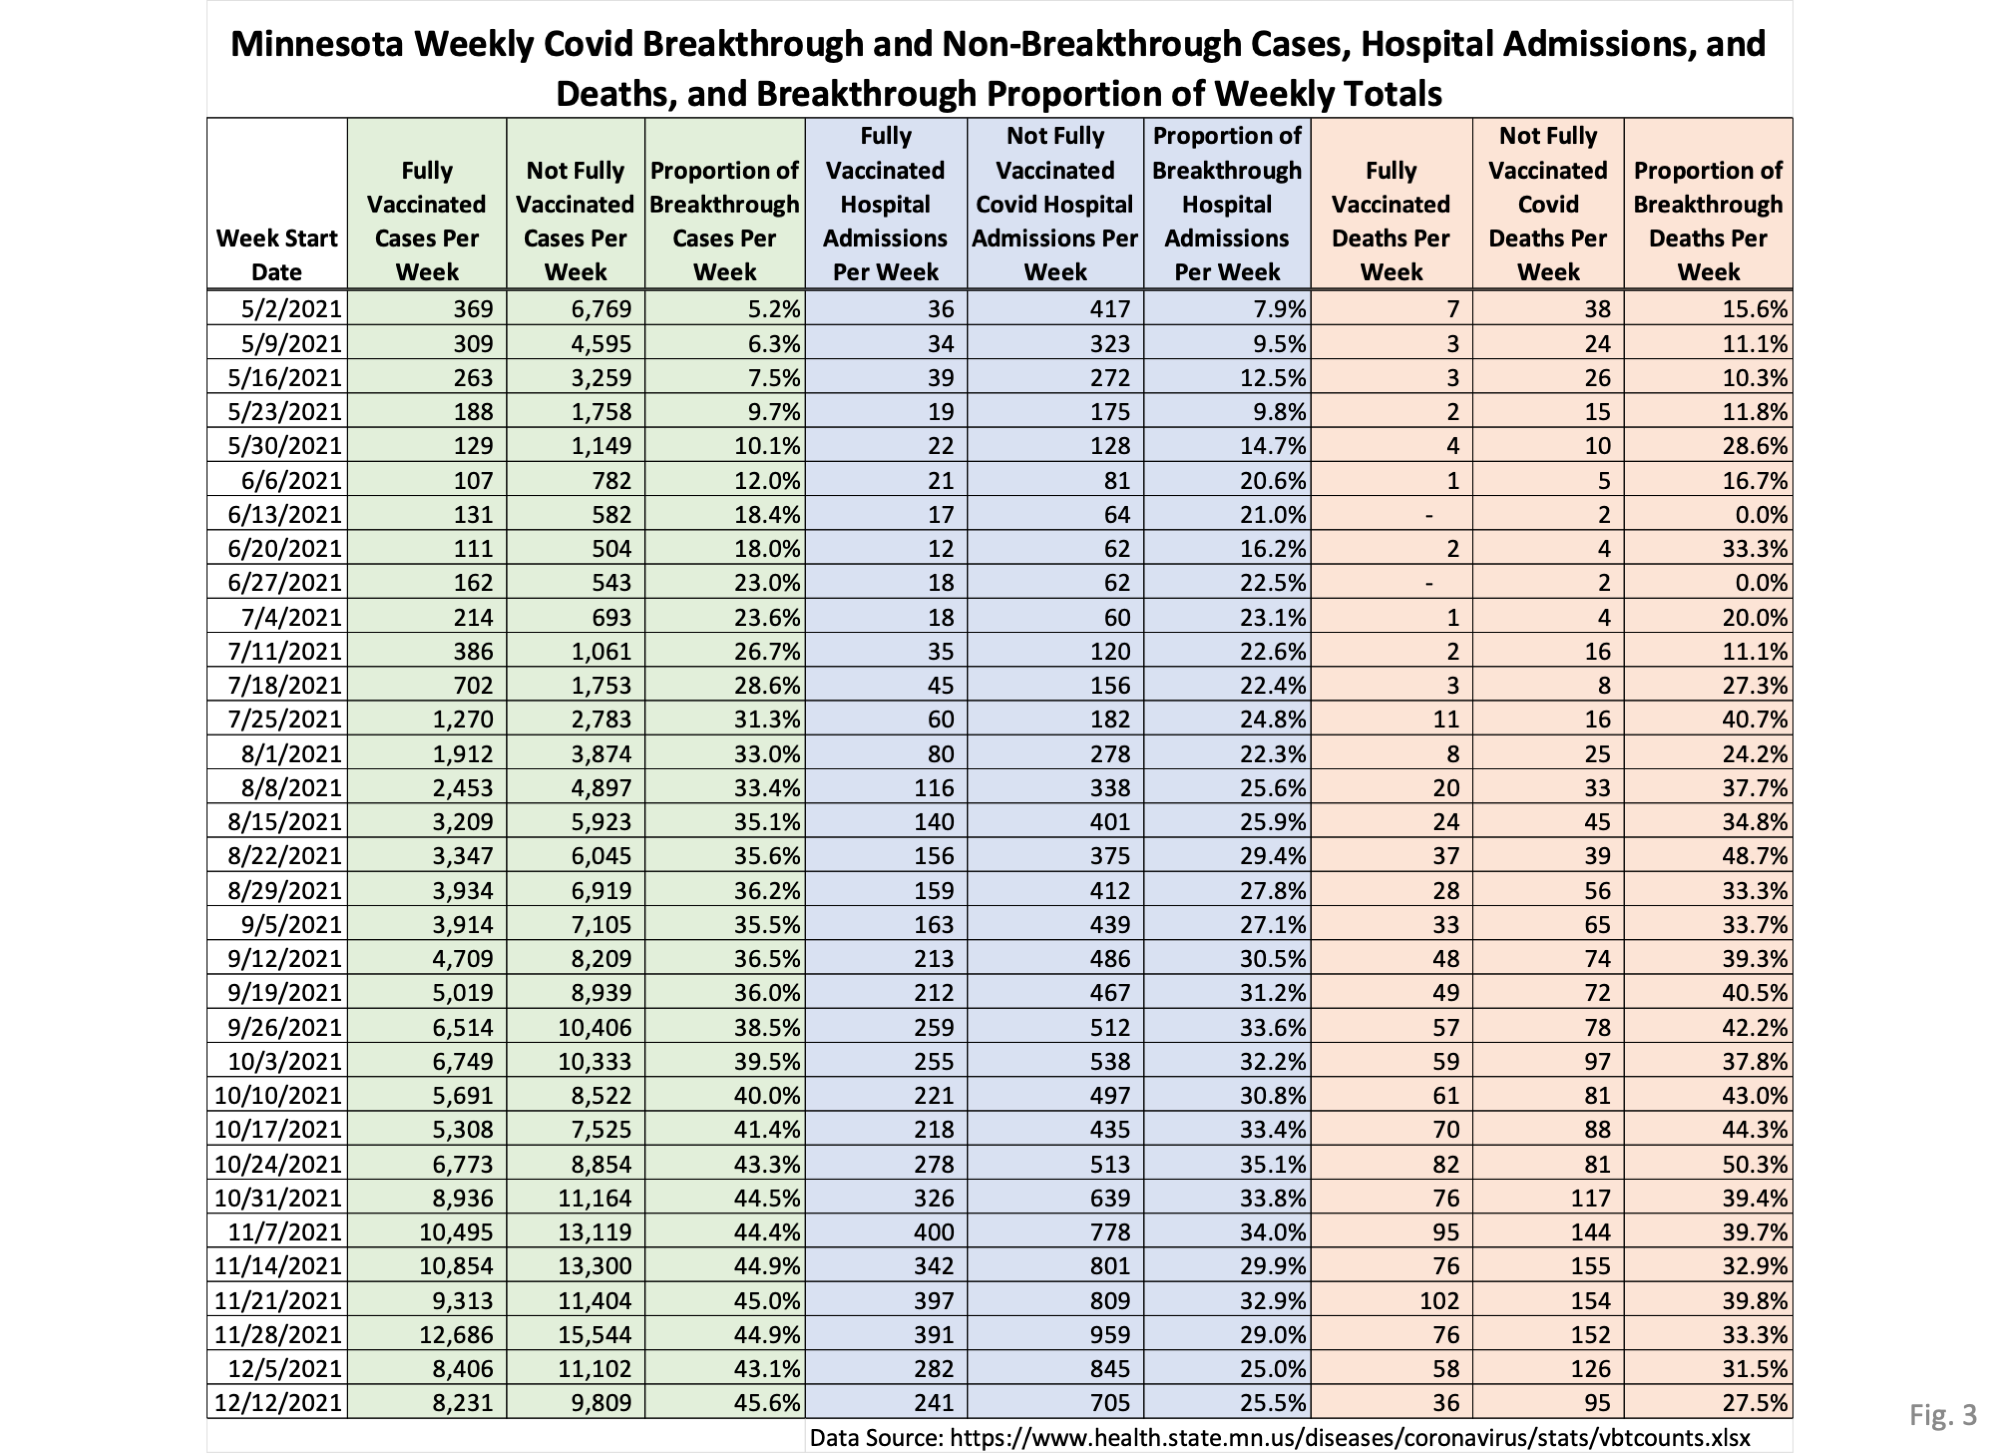
2. The data source for Slides 2 and 3 is the data file https://www.health.state.mn.us/diseases/coronavirus/stats/vbtcounts.xlsx found on MDH web page https://www.health.state.mn.us/diseases/coronavirus/stats/vbt.html. The data provided in the data file vbtcounts.xlsx is used without modification, other than to sum the weekly events and compute the breakthrough proportion. Vbtcounts.xlsx provides breakthrough and non-breakthrough cases, hospital admissions, and deaths for each week listed.
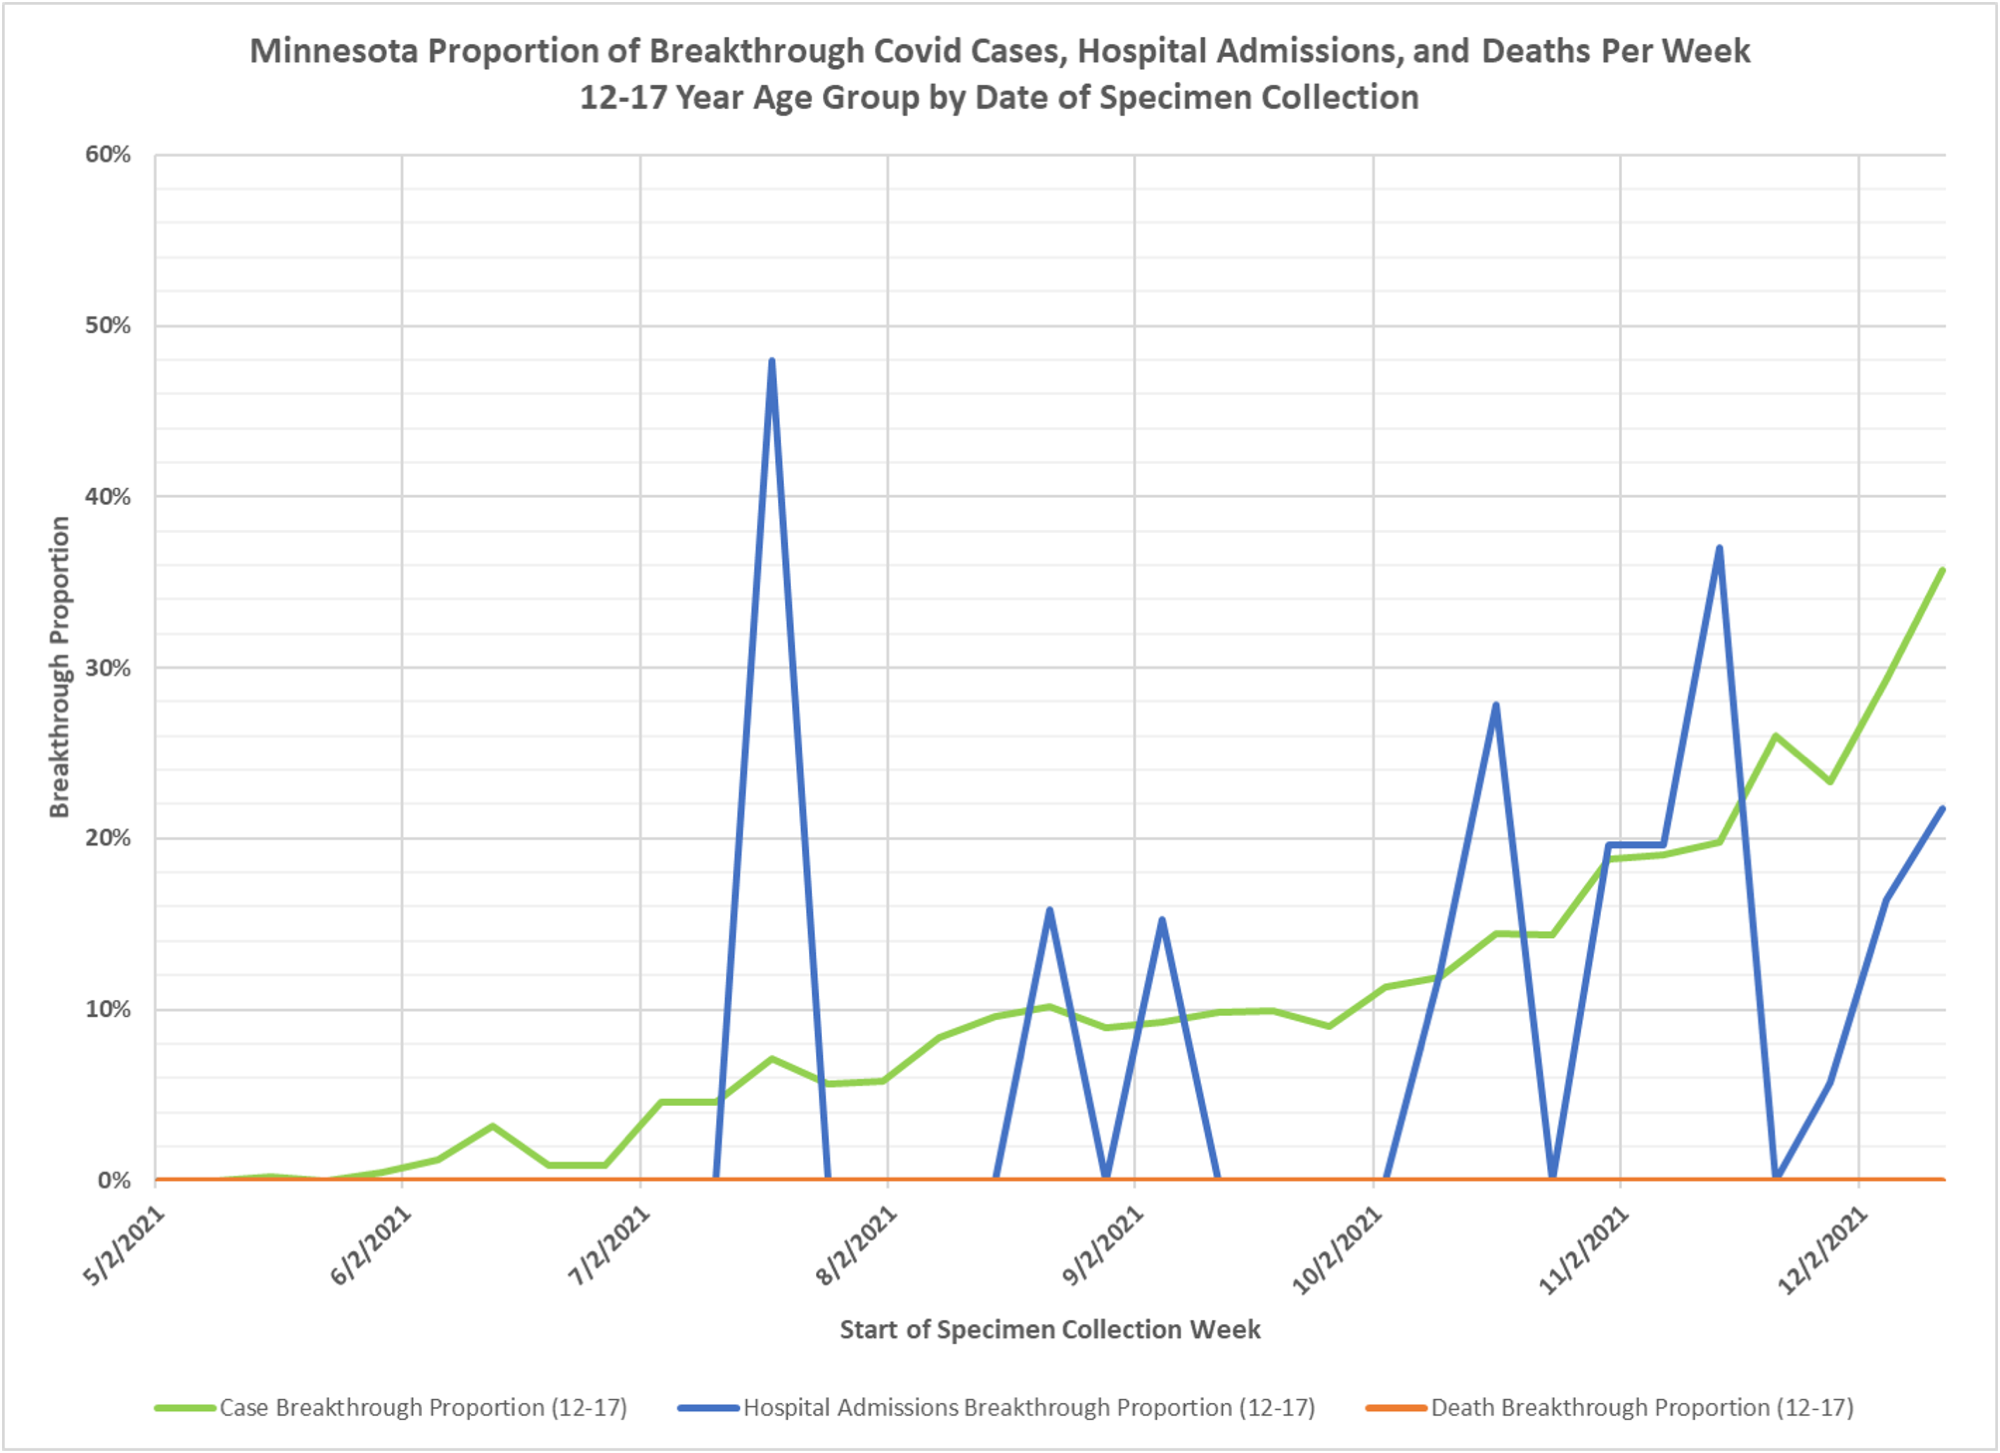
3. The data source for the breakthrough proportions by age group (Slides 4 through 7) is the data file vbtcirates.xlsx, found on the Minnesota Department of Health (MDH) web page: https://www.health.state.mn.us/diseases/coronavirus/stats/vbtcirates.xlsx . This data file gives the rates per 100k of cases, hospitalizations, and deaths in full vaccinated and not fully vaccinated people, broken out by age group.
4. The rates per 100k in vbtcirates.xlsx are converted into cases, hospitalizations, and deaths by multiplying by the appropriate population. The number of vaccinated people by age group can found on the Vaccine Data page, https://mn.gov/covid19/vaccine/data/index.jsp , in the data file People Vaccinated by Age. The unvaccinated population is found by taking the US Census American Community Survey 5-Year Estimate (Data Table S0101, https://data.census.gov/cedsci/table) and subtracting the vaccinated population. The breakthrough proportion is then found by dividing the breakthrough events by the total of the breakthrough and non-breakthrough weekly events.
5. MDH defines a breakthrough event as a Covid case, hospital admission, or death that occurs 14 or more days after completing the vaccination shots (not including boosters).
6. Slide 1: New breakthrough cases on 1/18 2022 total 34,325, by far the largest weekly total breakthrough cases. The newly reported breakthrough hospitalizations of 533 are also the largest yet reported. Note that many of these newly reported breakthrough events may occur more recently than the weeks published in vbtcounts.xlsx or vbtcirates.xlsx.
7. Slides 2 and 3, Overall Breakthrough Proportions: All categories of cases, hospital admissions, and deaths were reduced for the week starting 12/5/2021. In addition, the breakthrough proportion of cases, hospitalizations, and deaths was somewhat lower than for the prior several weeks
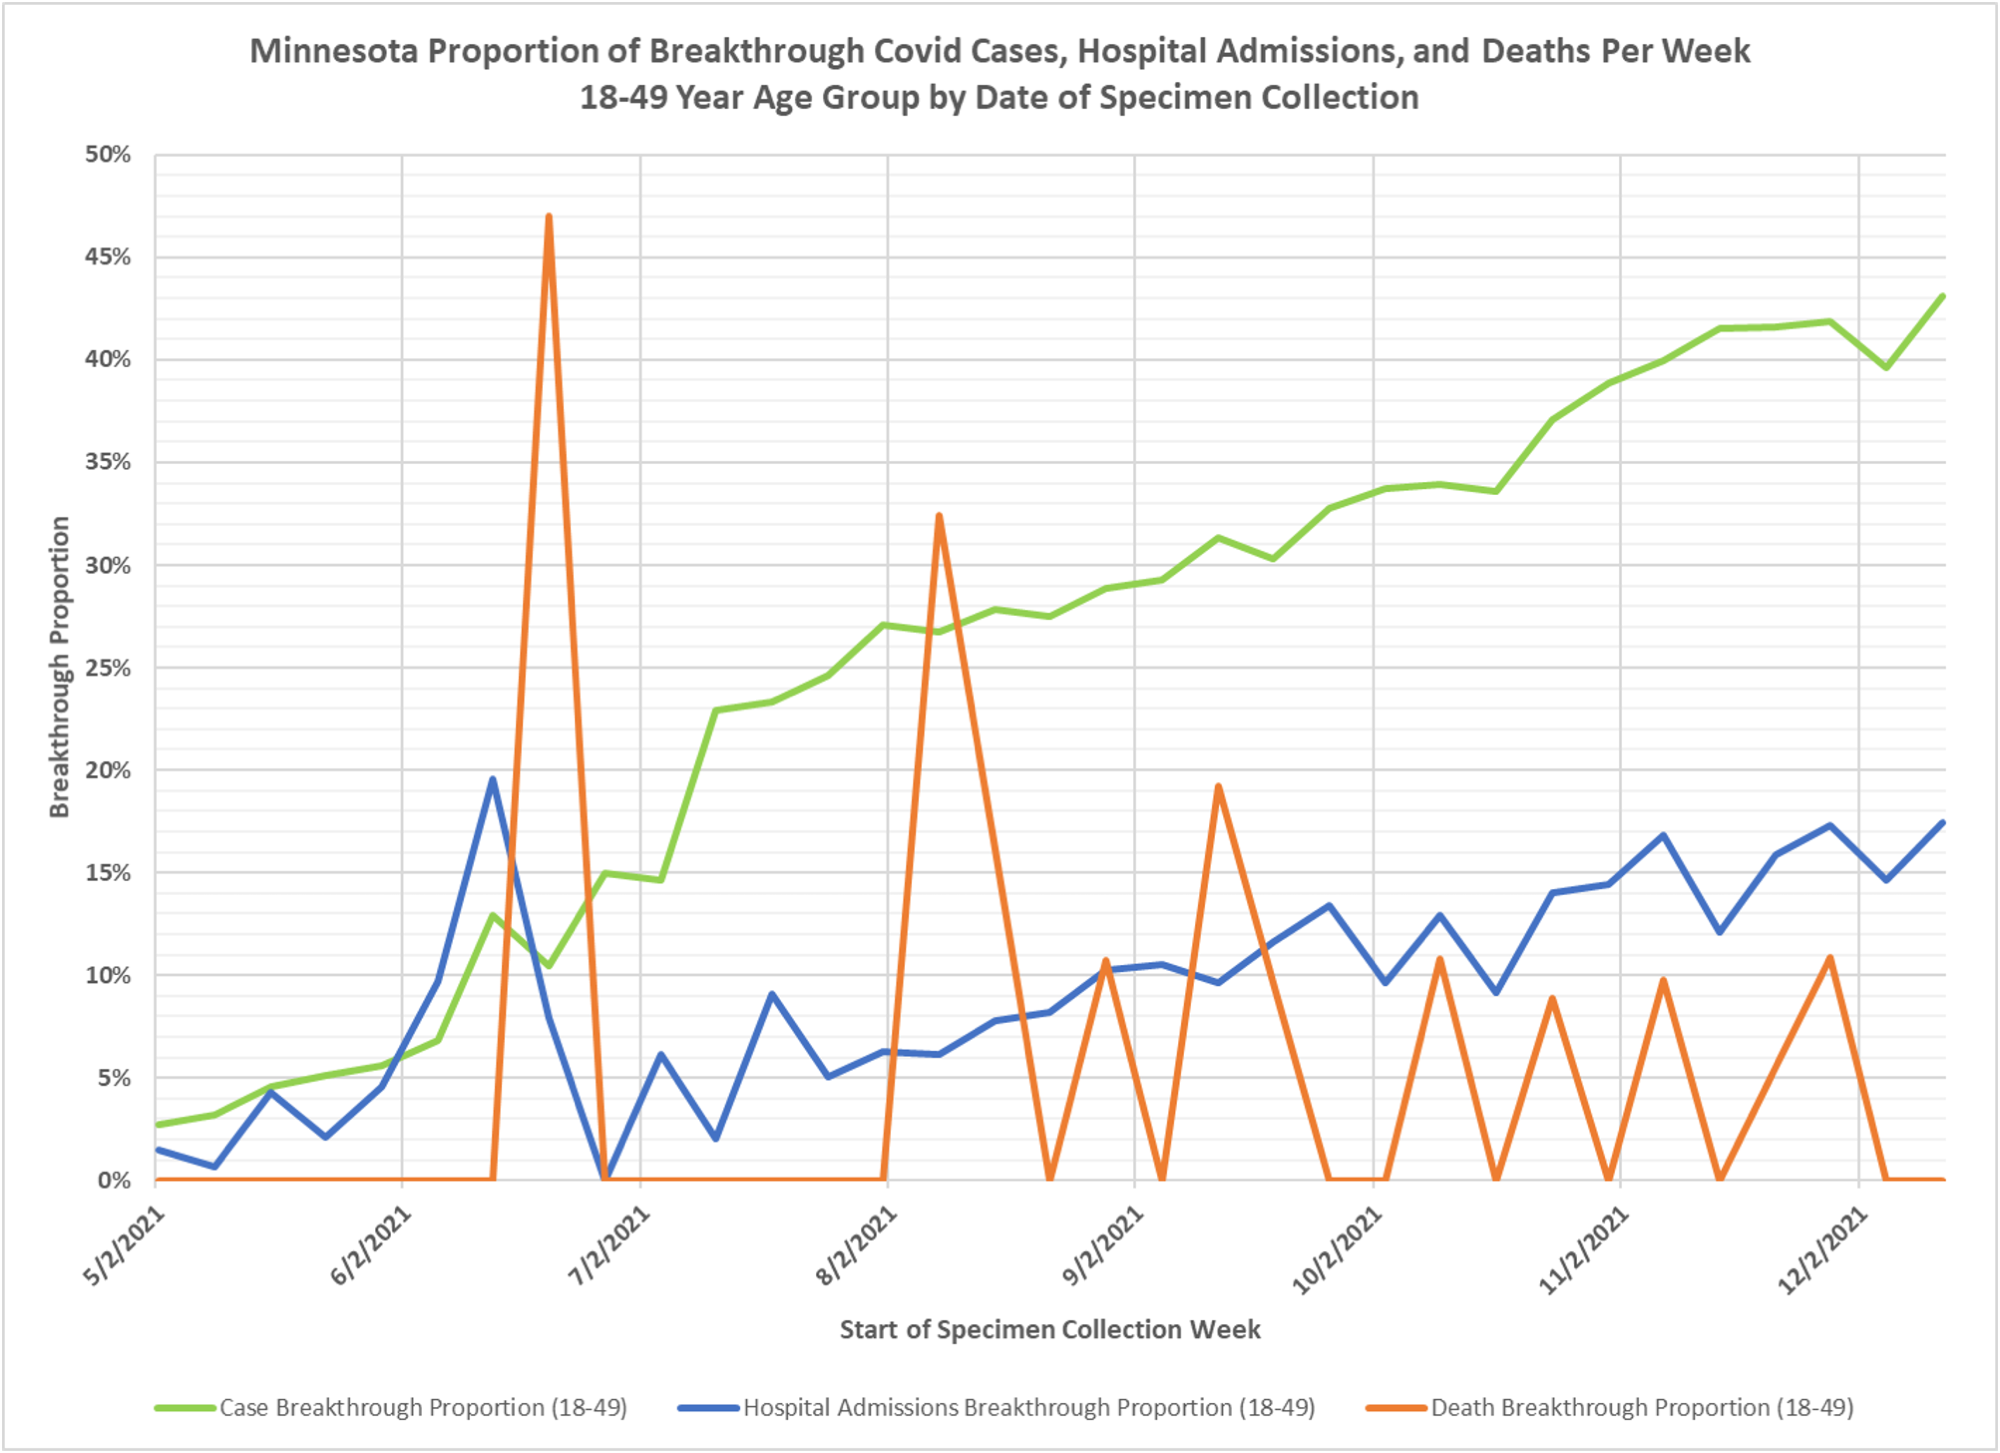
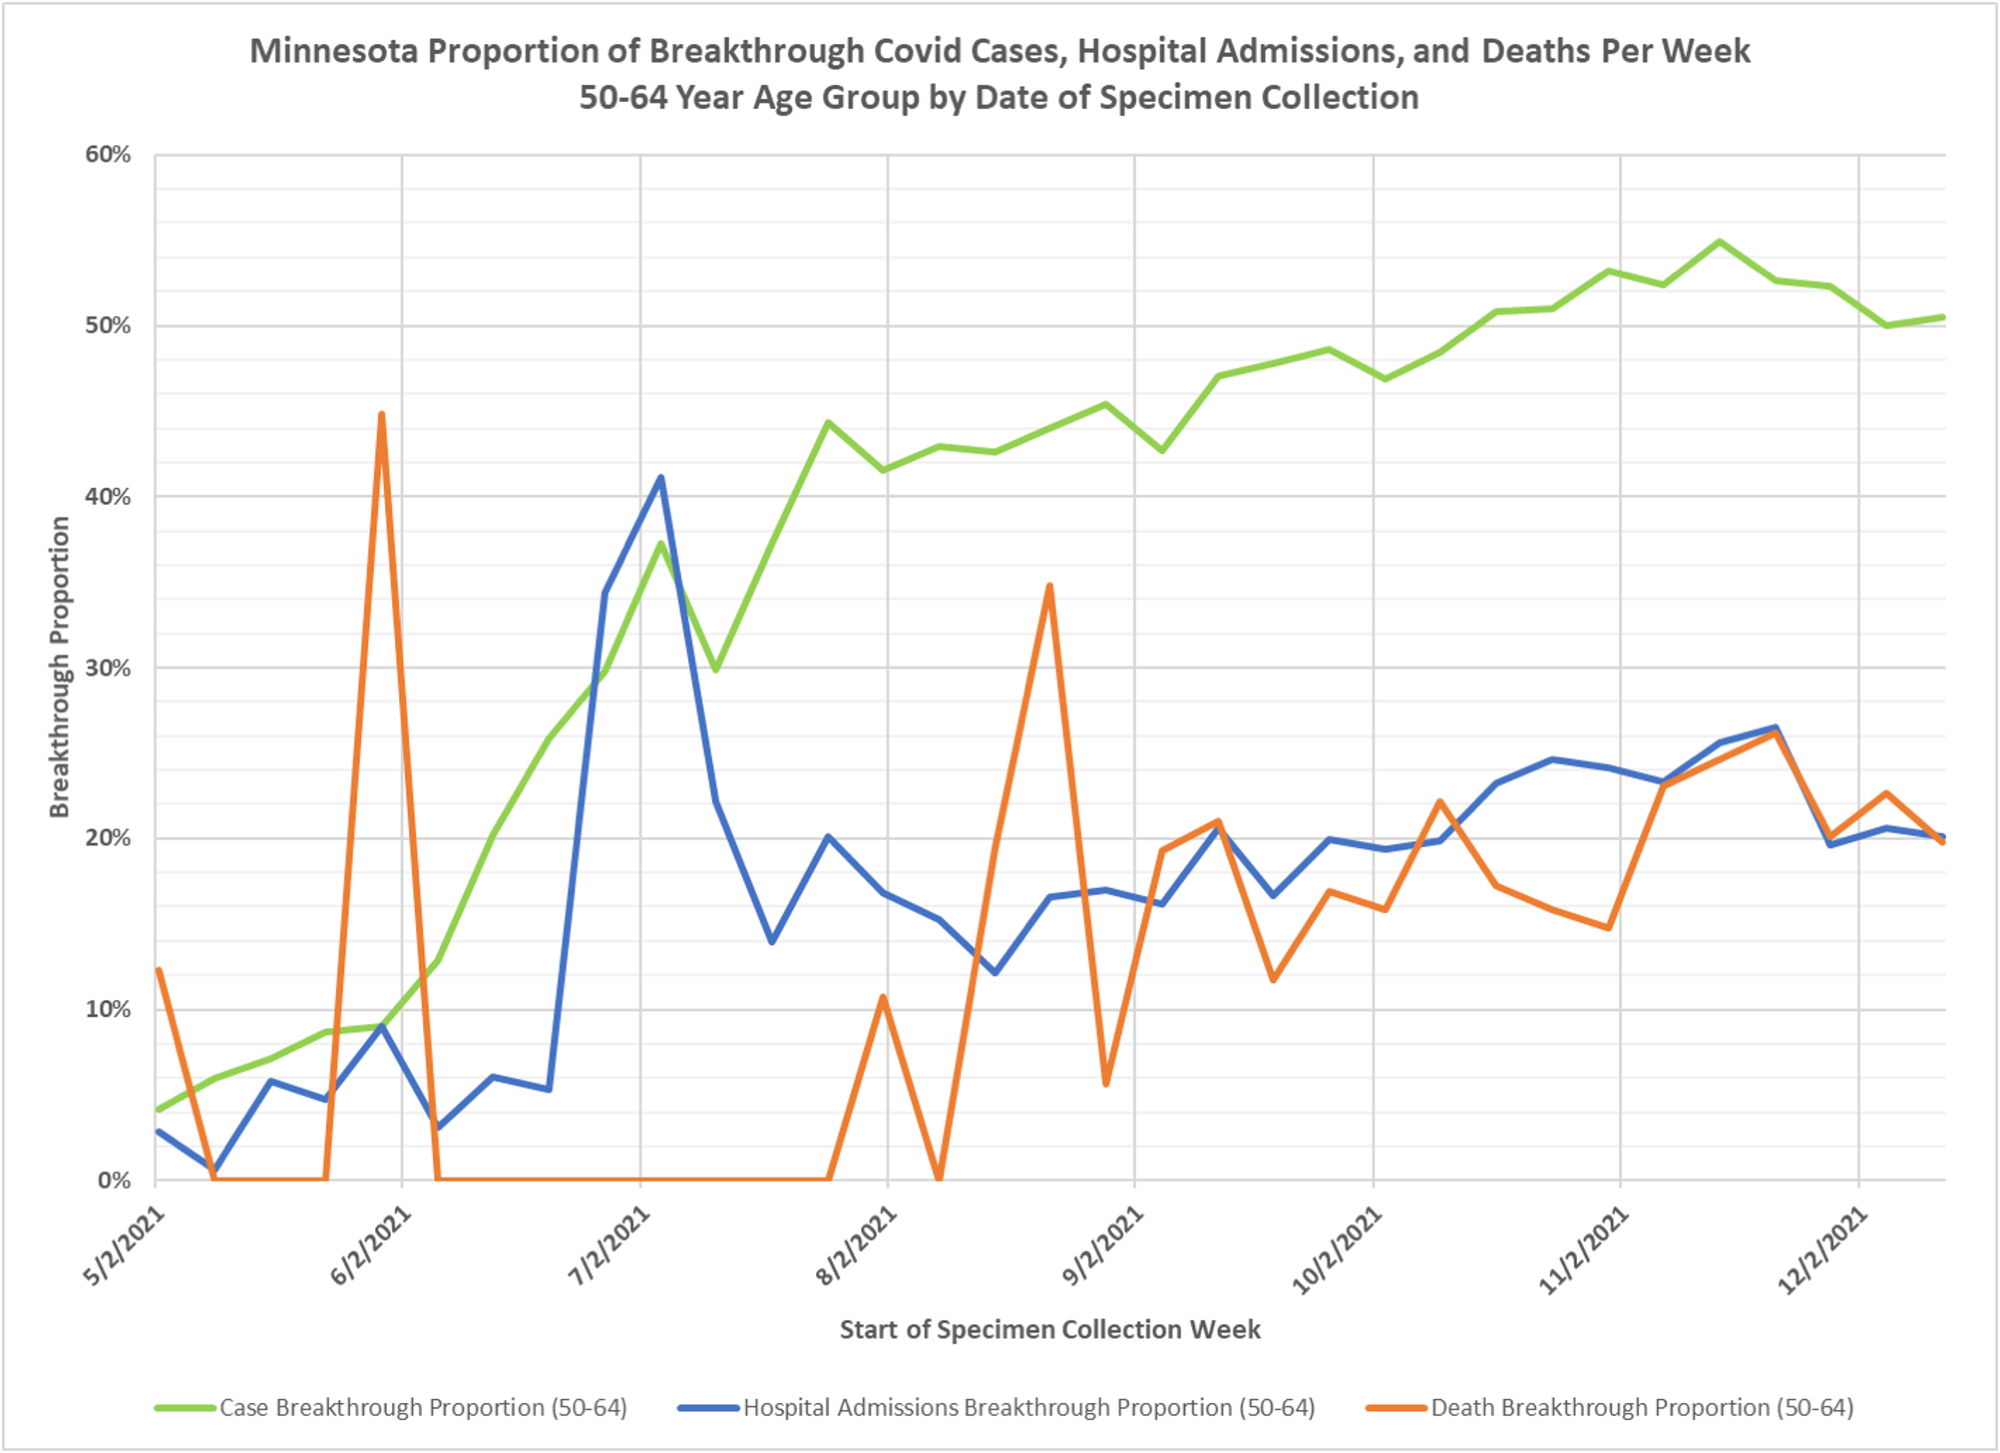
8. Slides 4 through 7: Breakthrough Proportions by Age Group: The breakthrough proportions by age charts follow the same general trend as seen for the overall chart, Slide 2.

Breakthrough is the new normal