Oh no, we are going on the third year of this lunacy. Help, I’ve fallen and I can’t get up. Dave’s notes:
1. For all charts the last 7 days of data is excluded to avoid charting incomplete data. Deaths reporting, however, is likely to be incomplete. All data is taken from the Minnesota Department of Health Situation Update for OCVID-19 web page https://www.health.state.mn.us/diseases/coronavirus/situation.html and from the Response and Preparation web page https://mn.gov/covid19/data/response-prep/response-capacity.jsp.
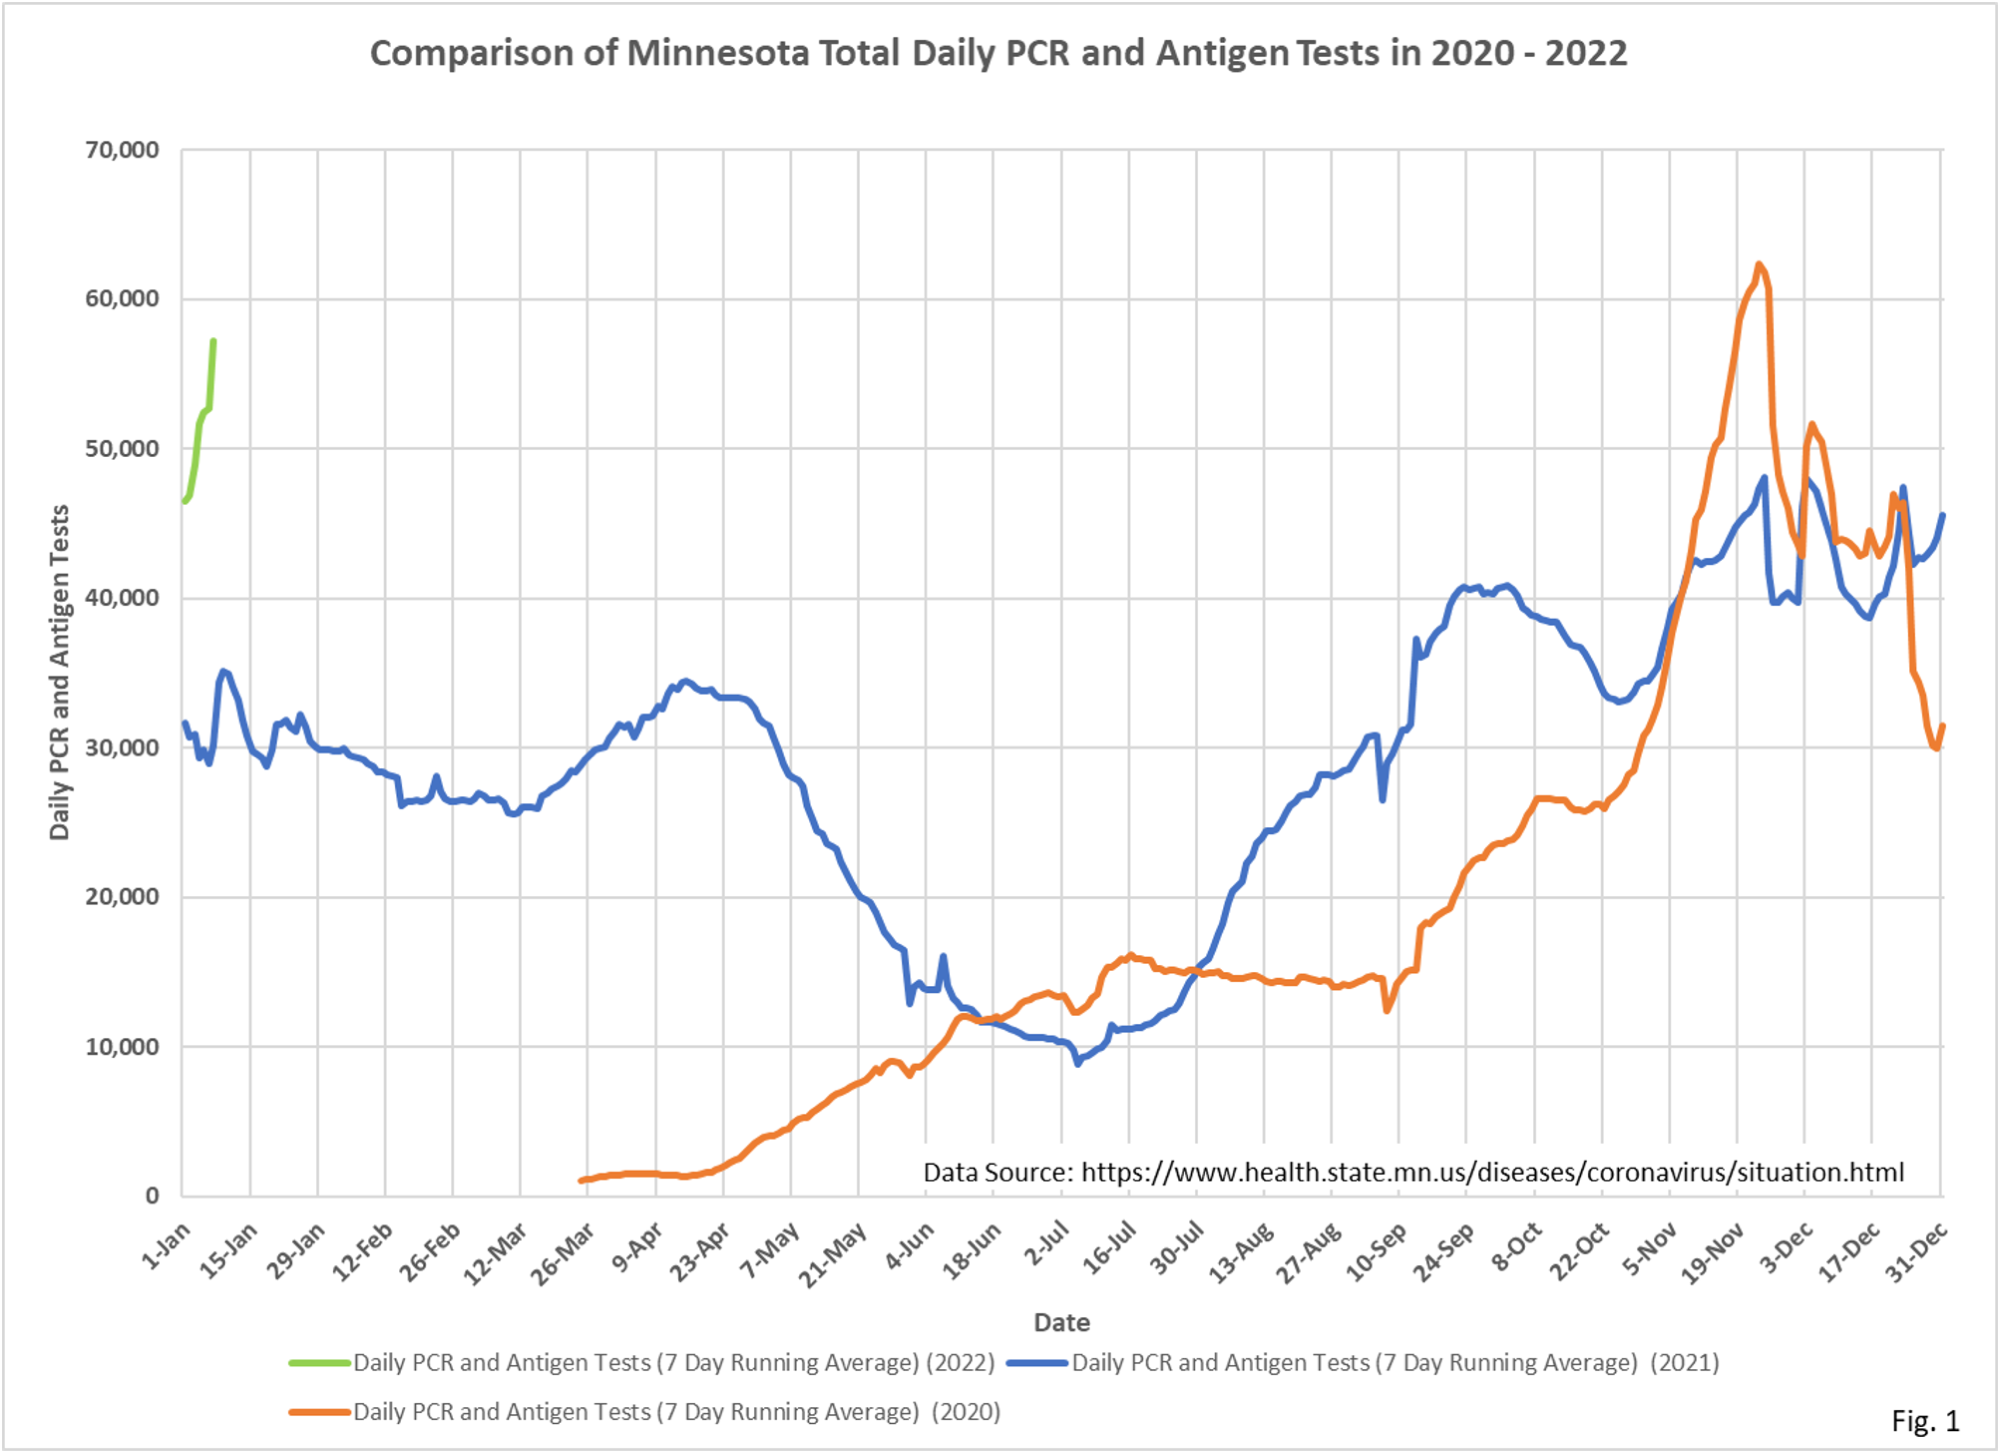
2. Fig. 1: Average tests per day are increasing rapidly, approaching the late 2020 high of 62,416 tests per day.
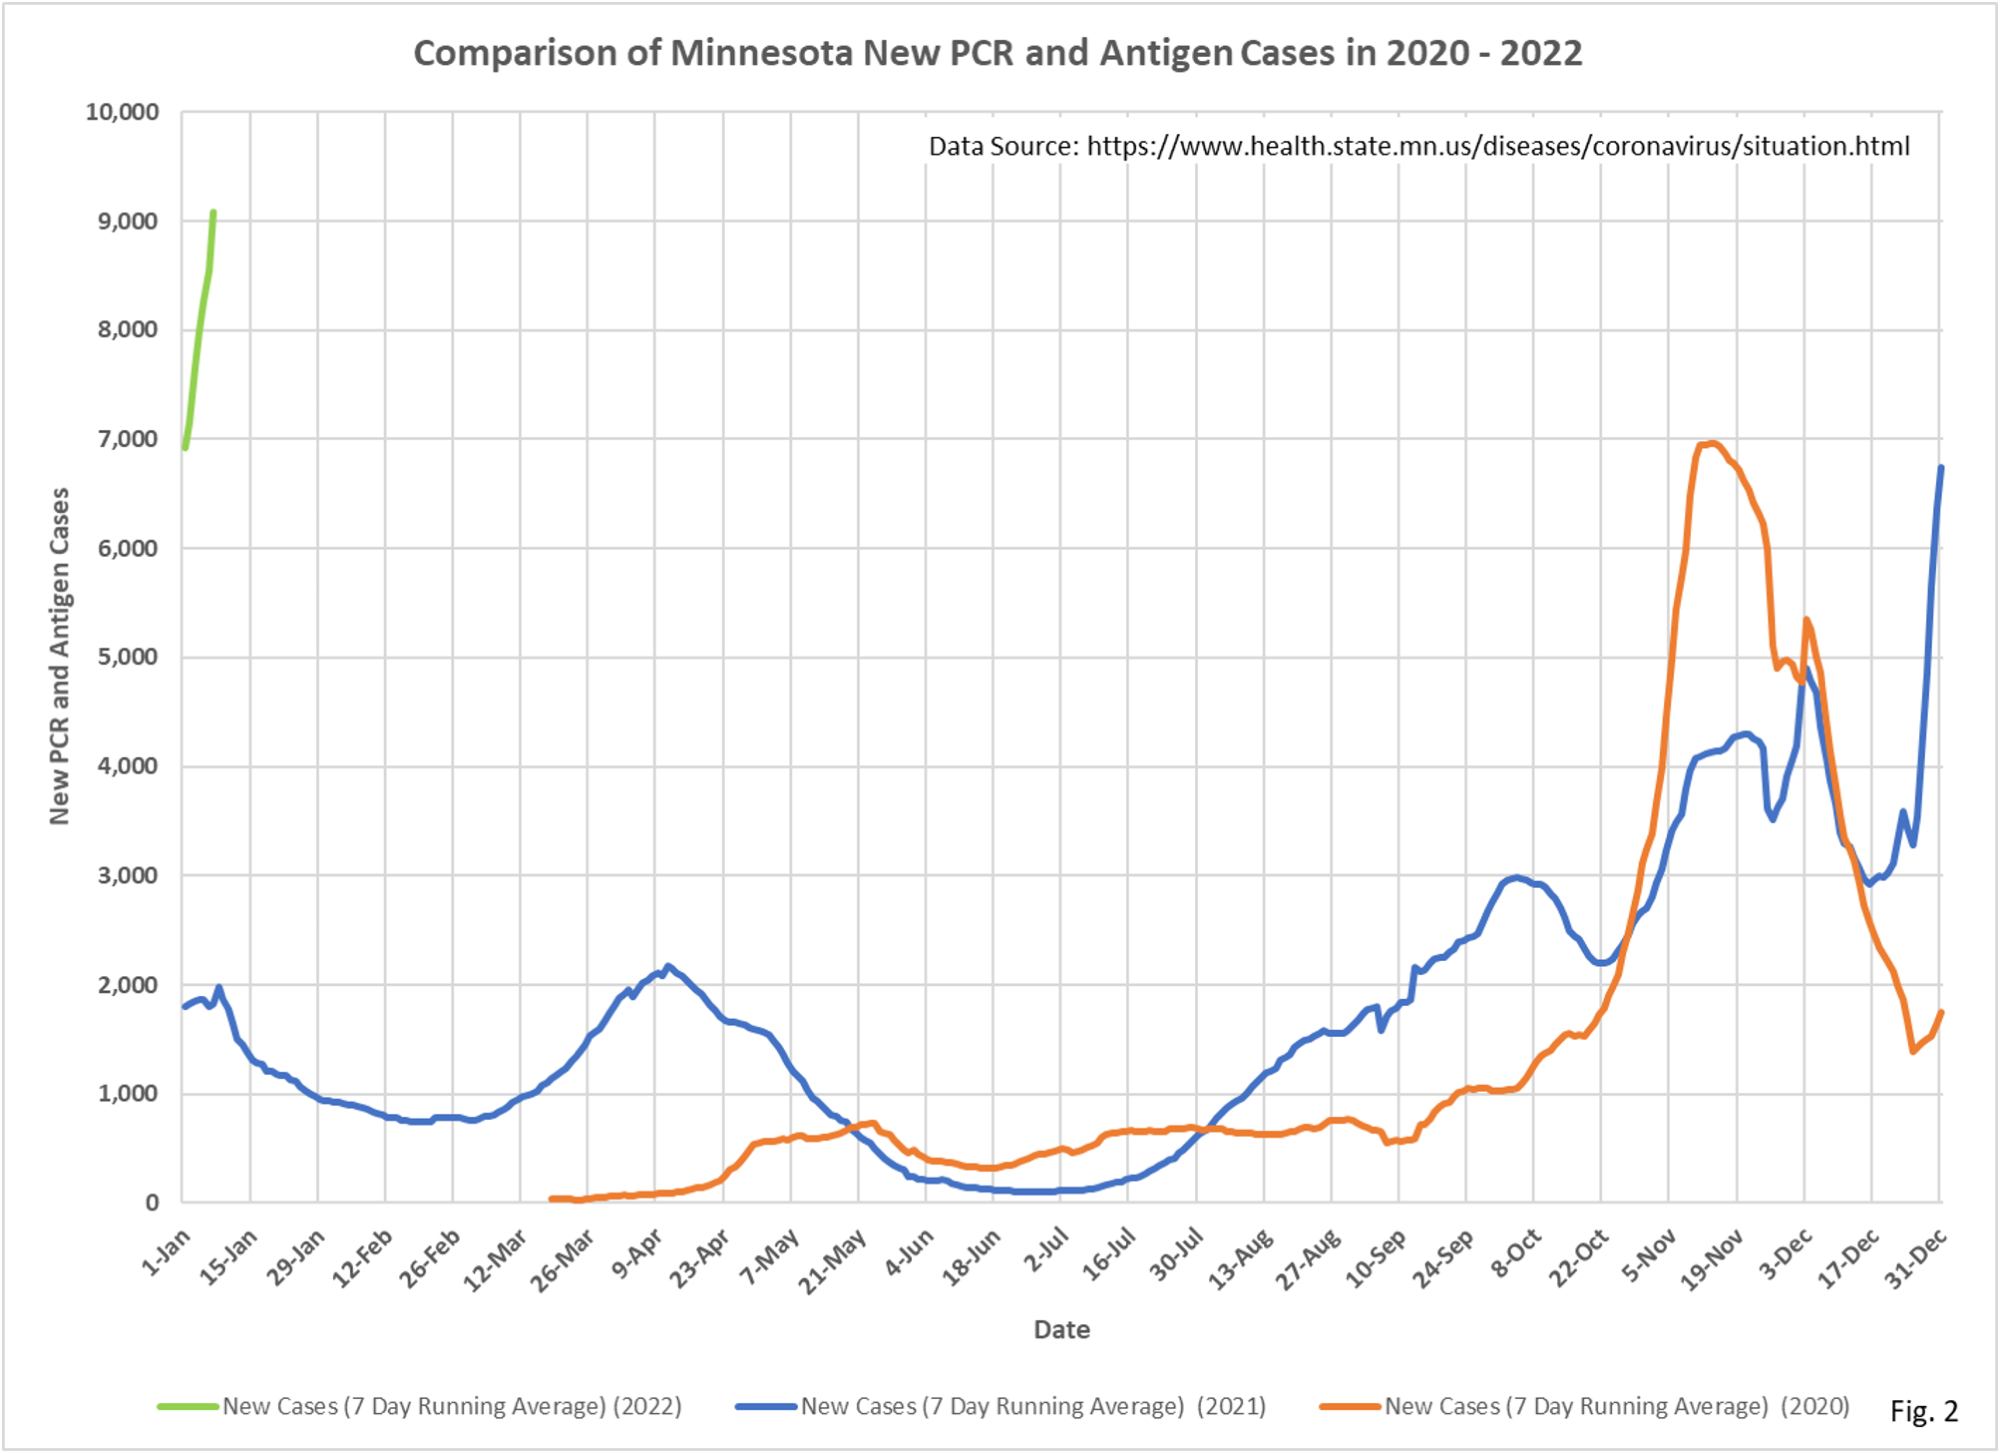
3. Fig. 2: New daily cases, after reaching a recent low point on 12/16/2021 at 2,918 cases per day, has now risen to a 7 day moving average of 9,081 cases per day on Jan. 7, 2022, the last day plotted.
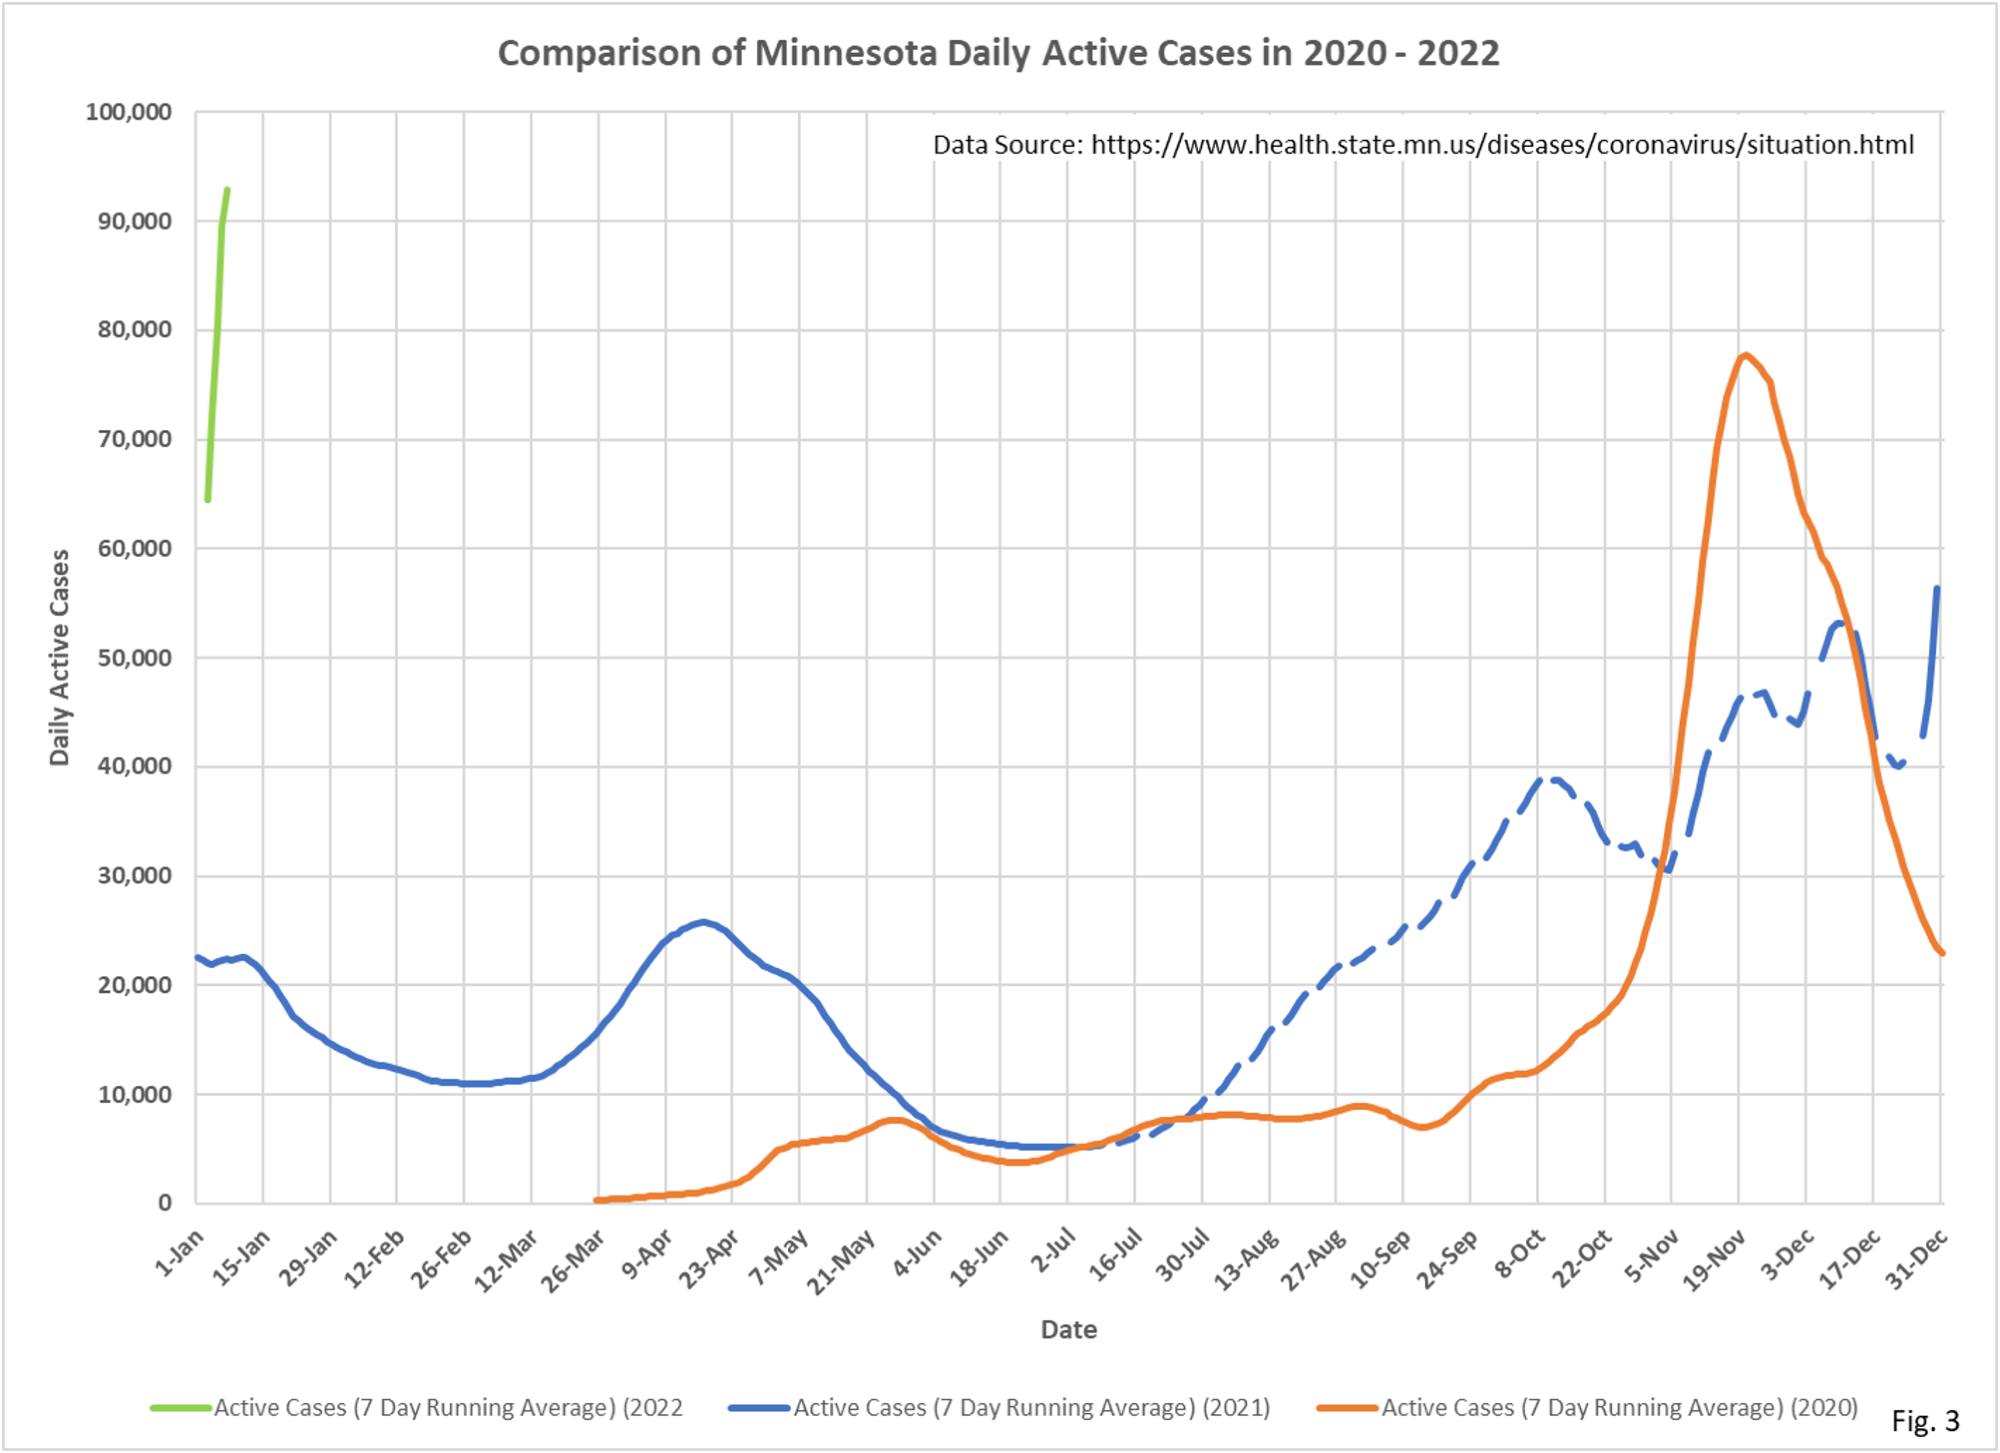
4. Fig. 3: Active cases largely mirrors the new daily cases curve, with a lag for the period in which a person is considered infectious. As far as we know MDH continues to use a nominal 10-day infectious period for reporting patients No Longer Needing Isolation, which forms the basis of the active case calculation.
5. Fig. 4: ICU Covid admissions per day are holding steady between 15 and 20 admissions per day, despite the rise in positive cases.
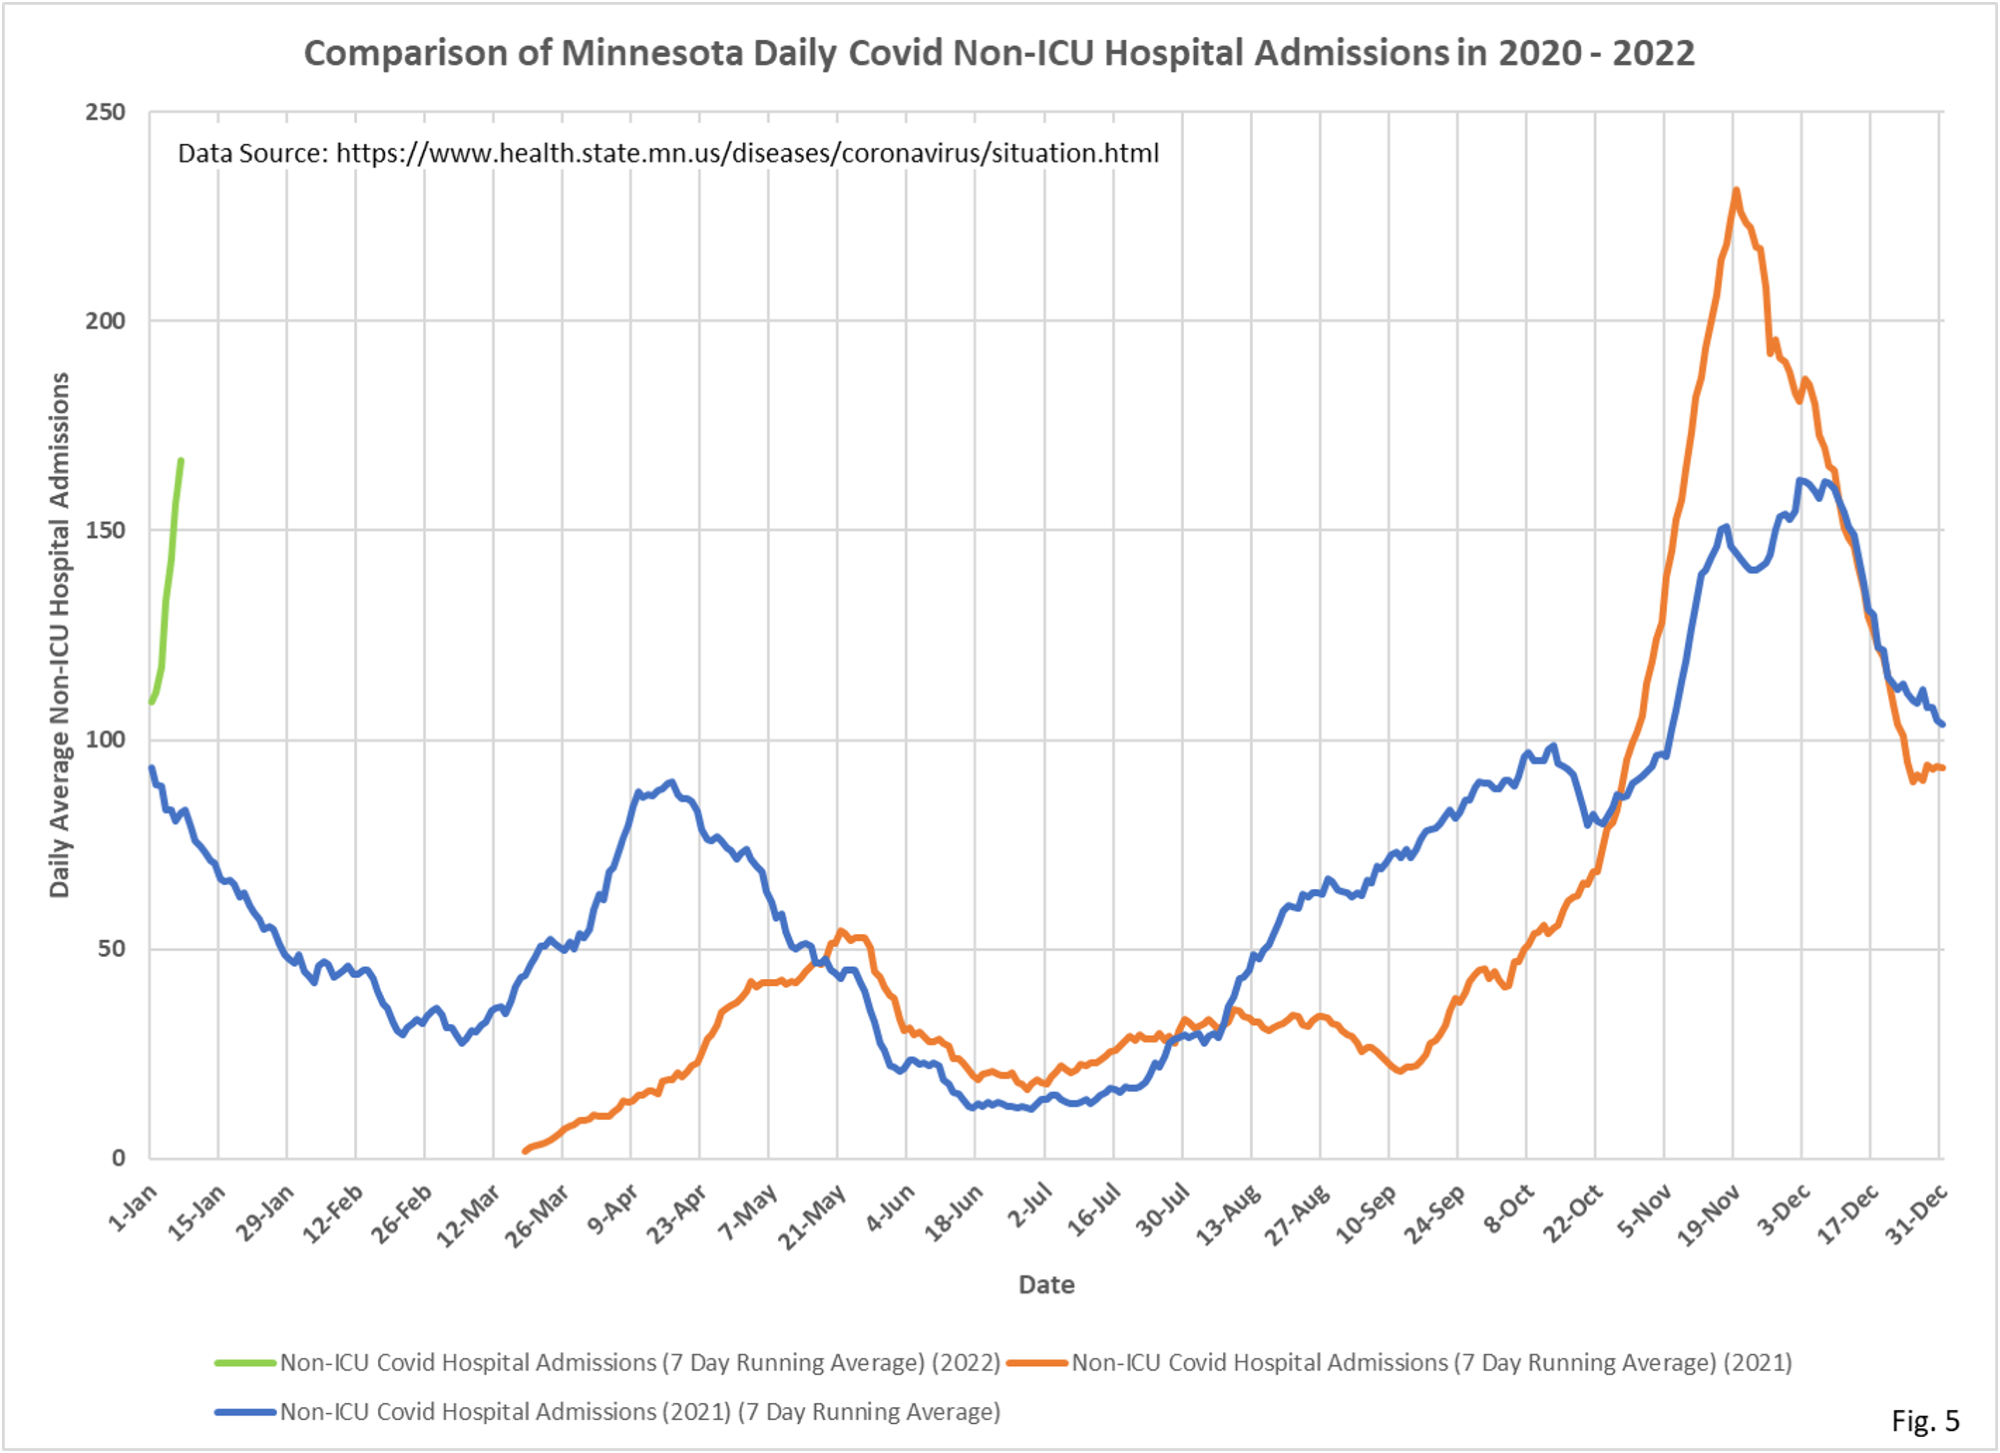
6. Fig. 5: Non-ICU Covid hospital admissions per day are rising sharply, but are still well below the late 2020 peak.
7. Fig. 6: ICU Covid hospital beds in use falling despite the rise in Covid cases.
8. Fig. 7: Non-ICU Covid hospital beds in use are rising, but still below the late 2020 and 2021 peaks.
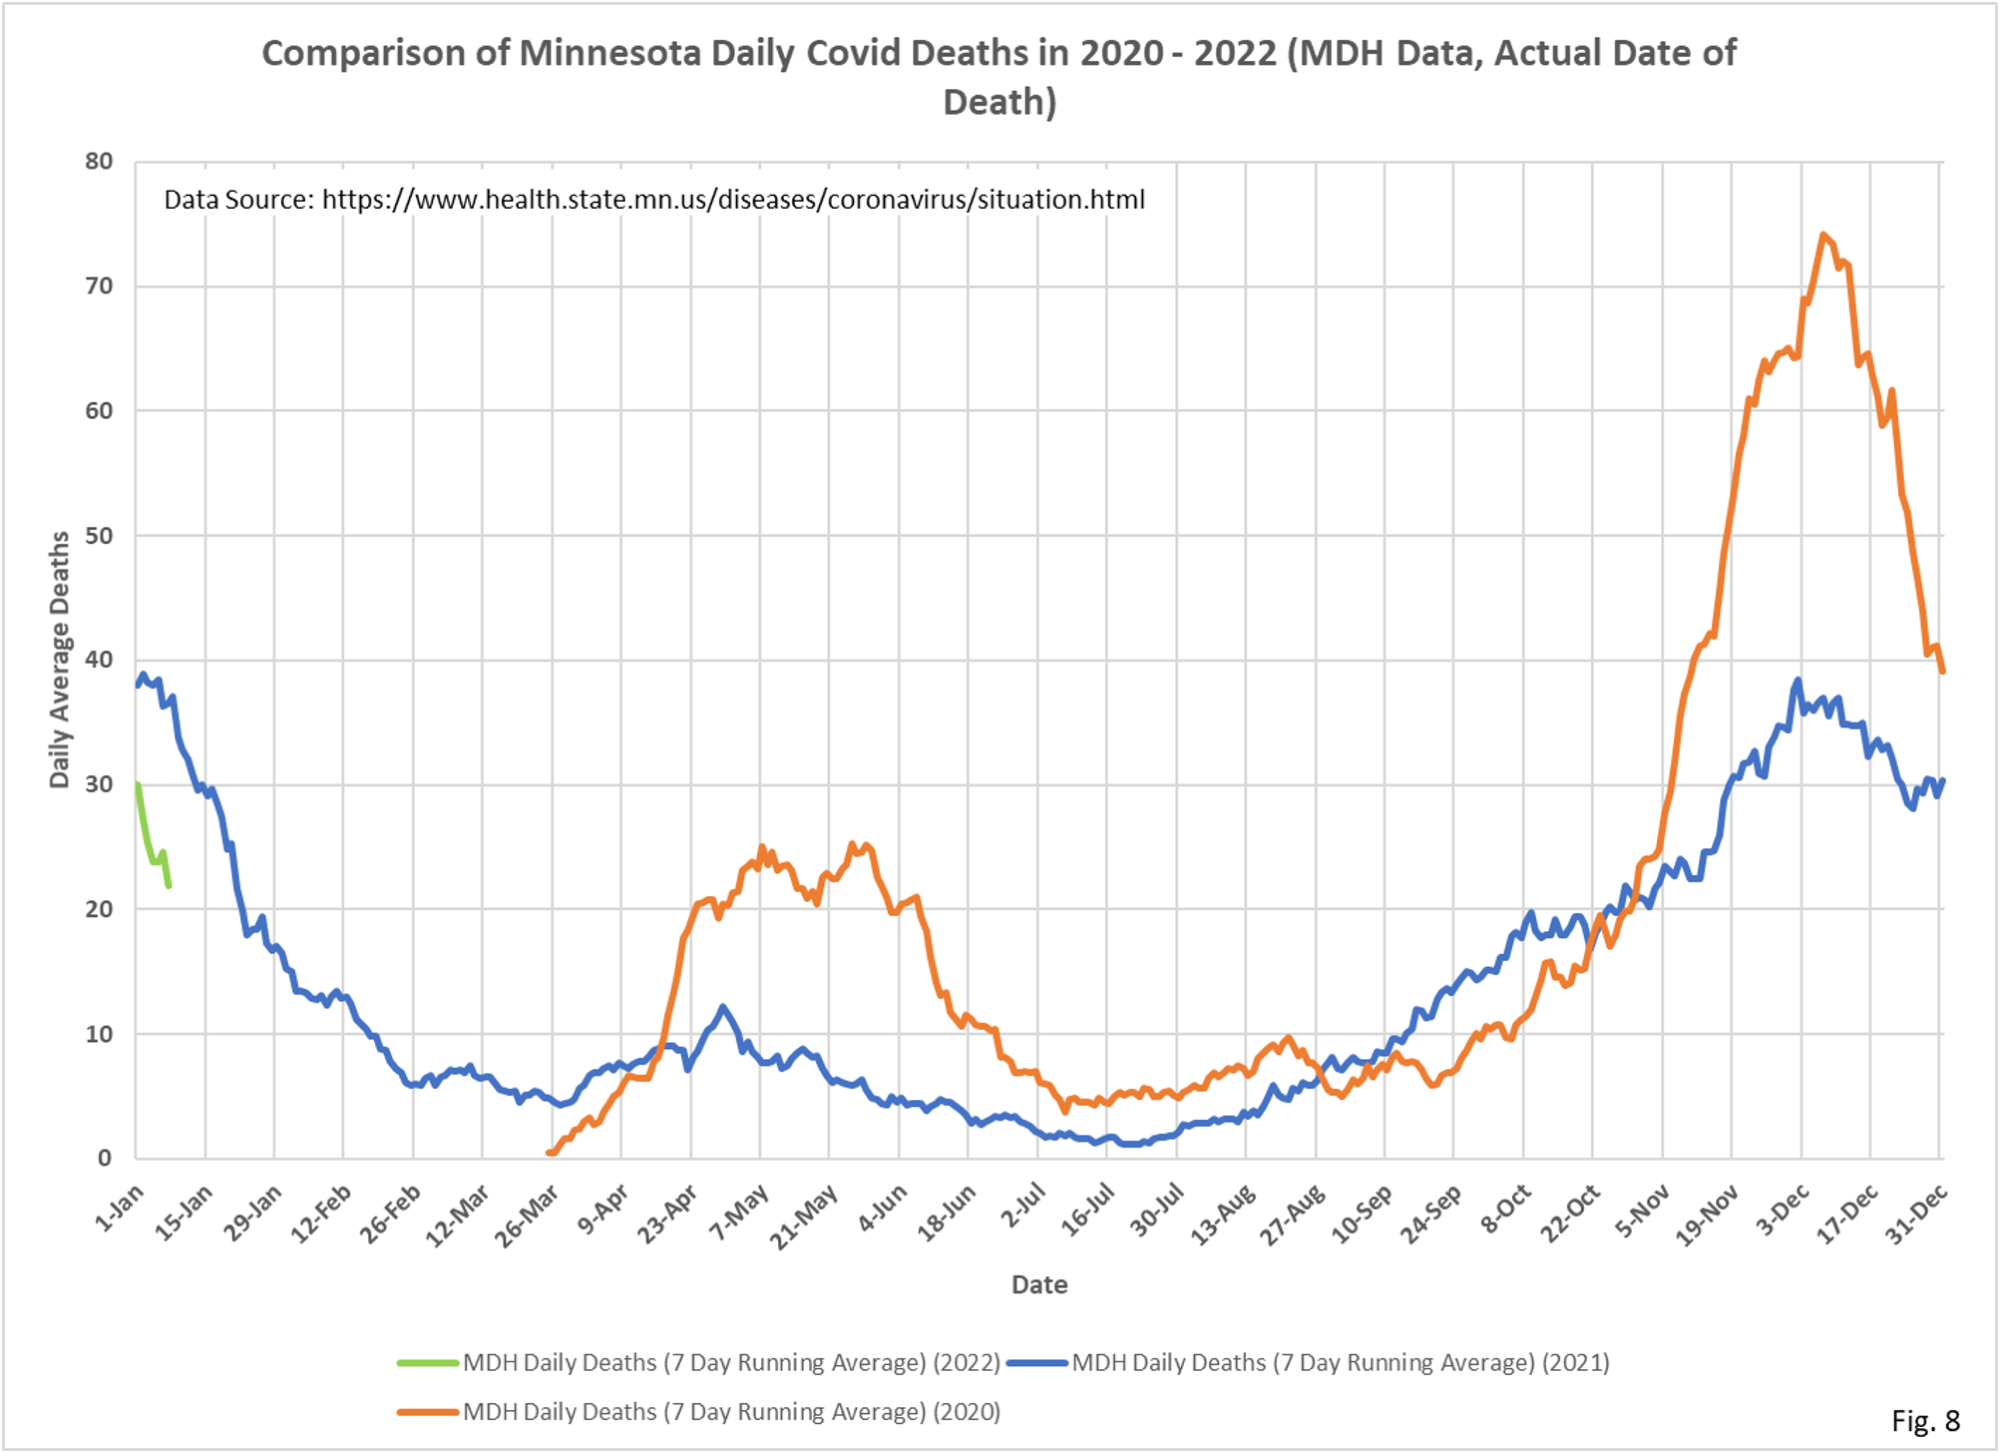
9. Fig. 8: Deaths attributed to Covid are declining.
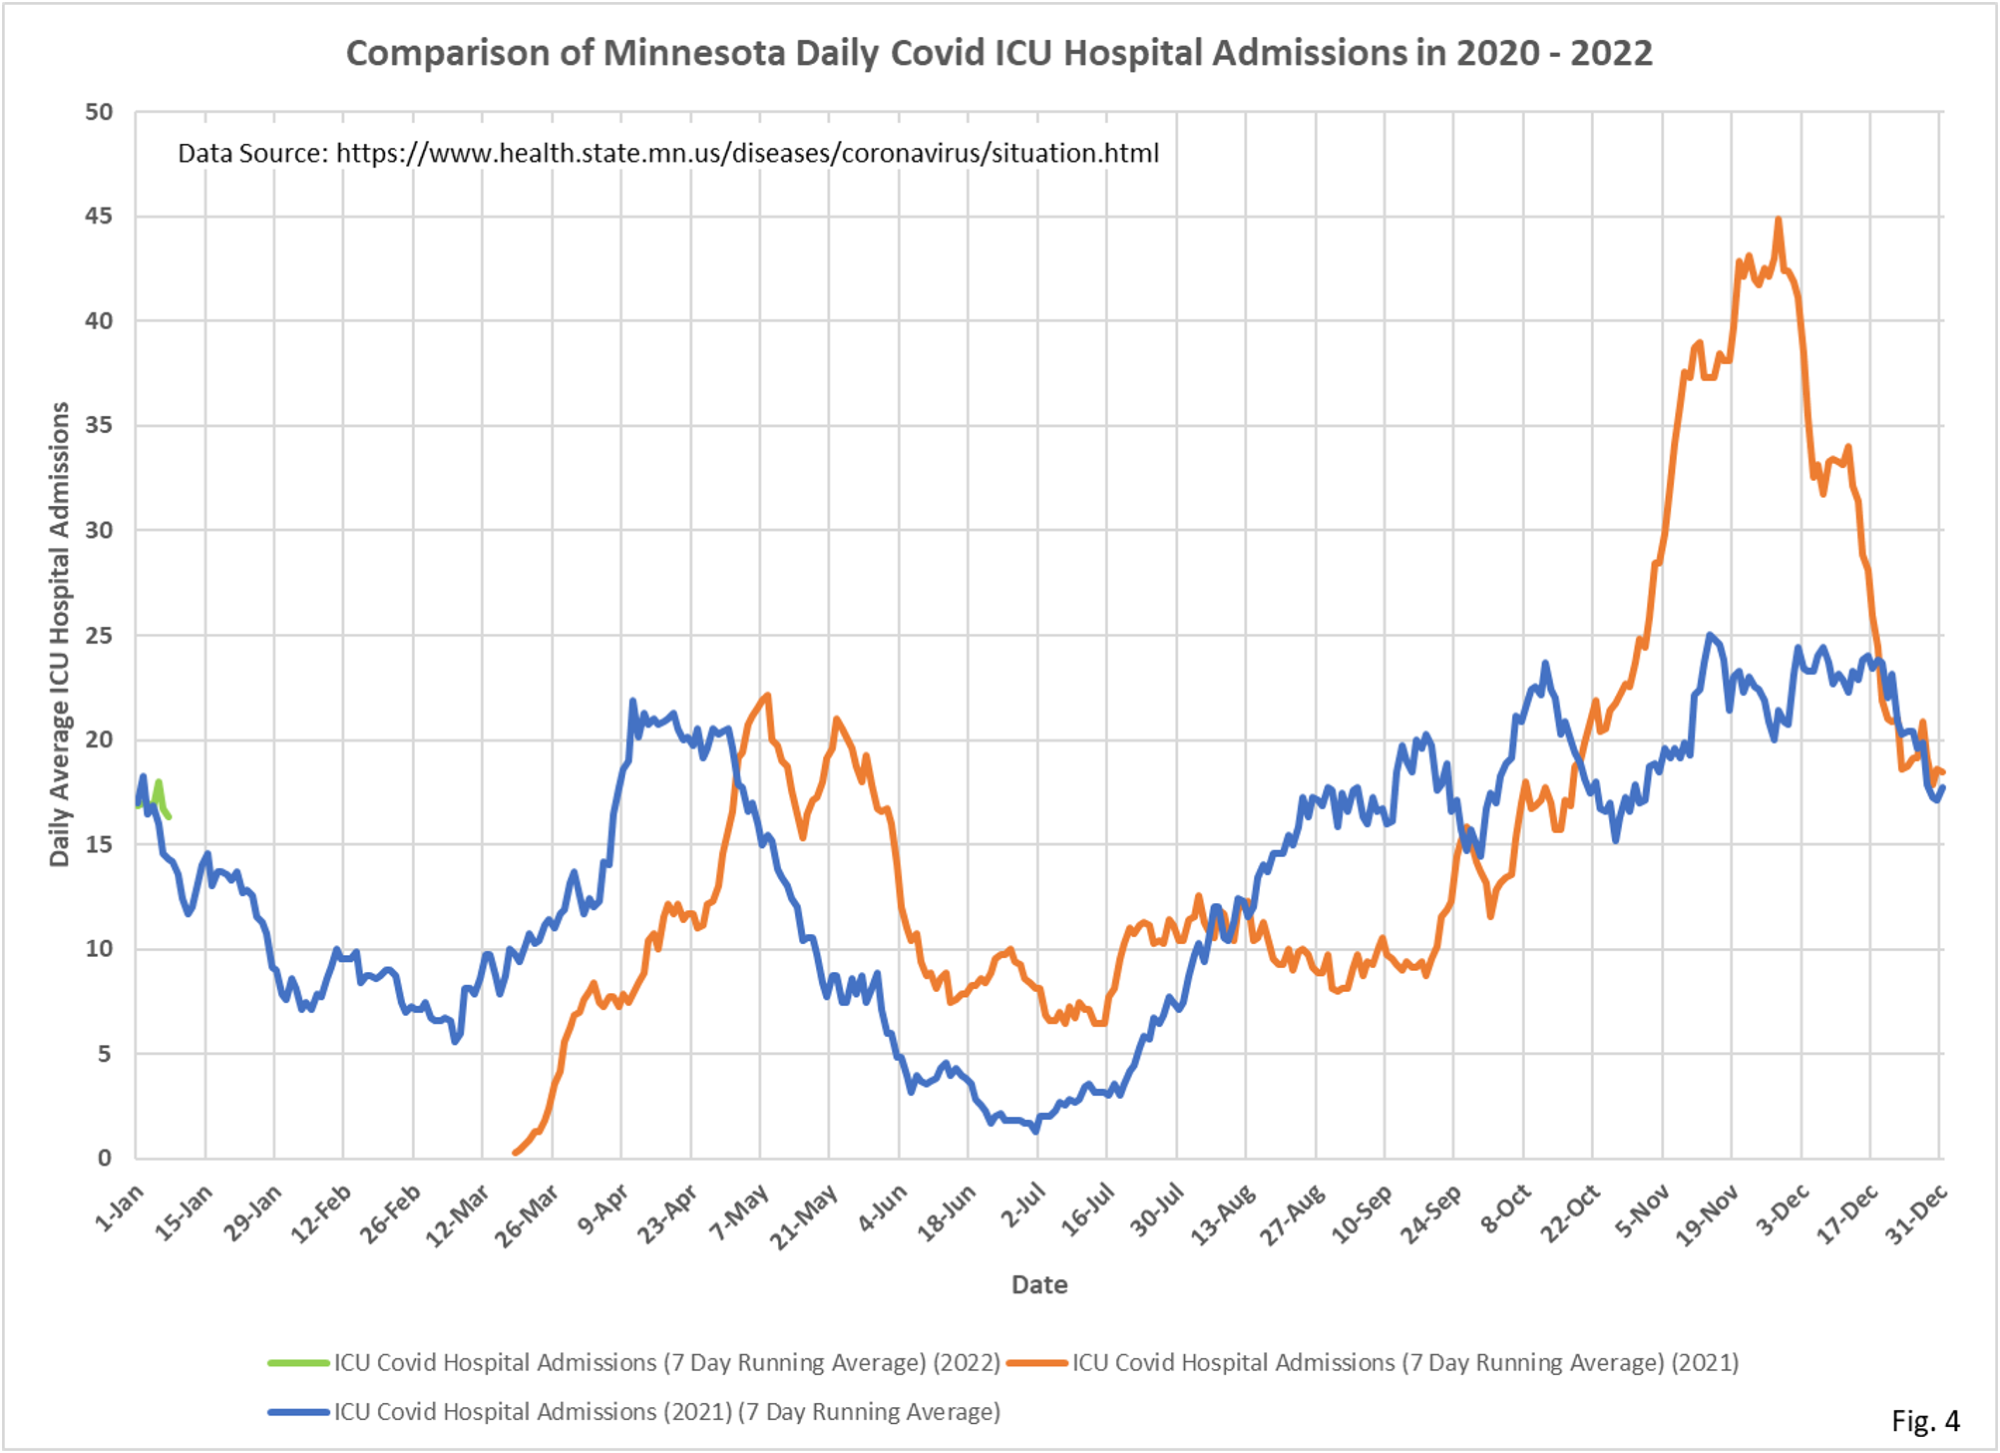
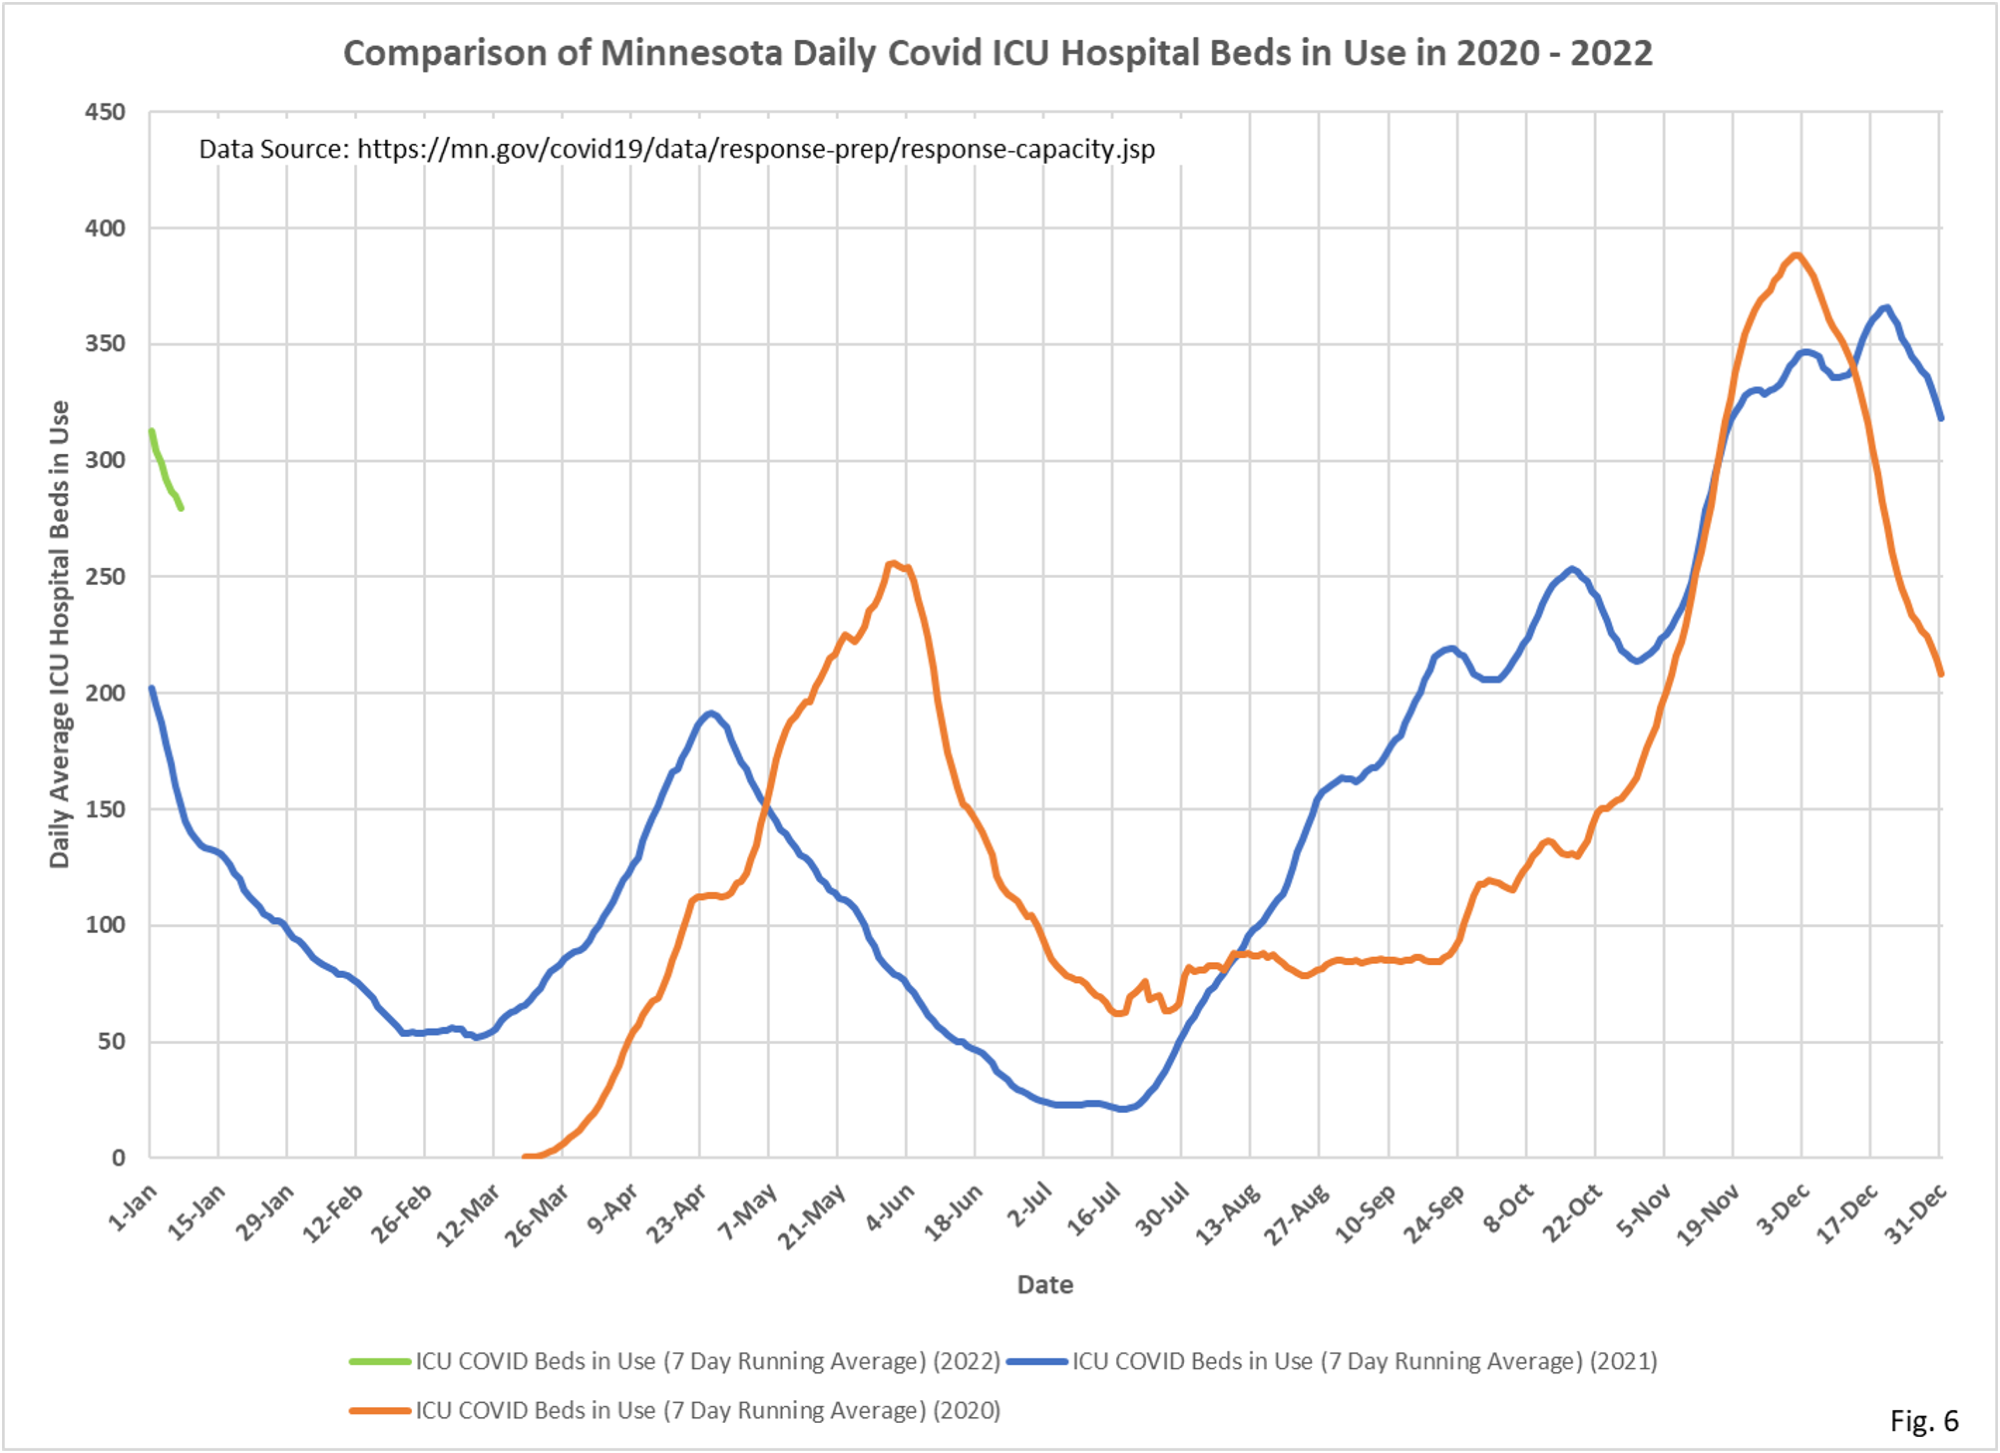
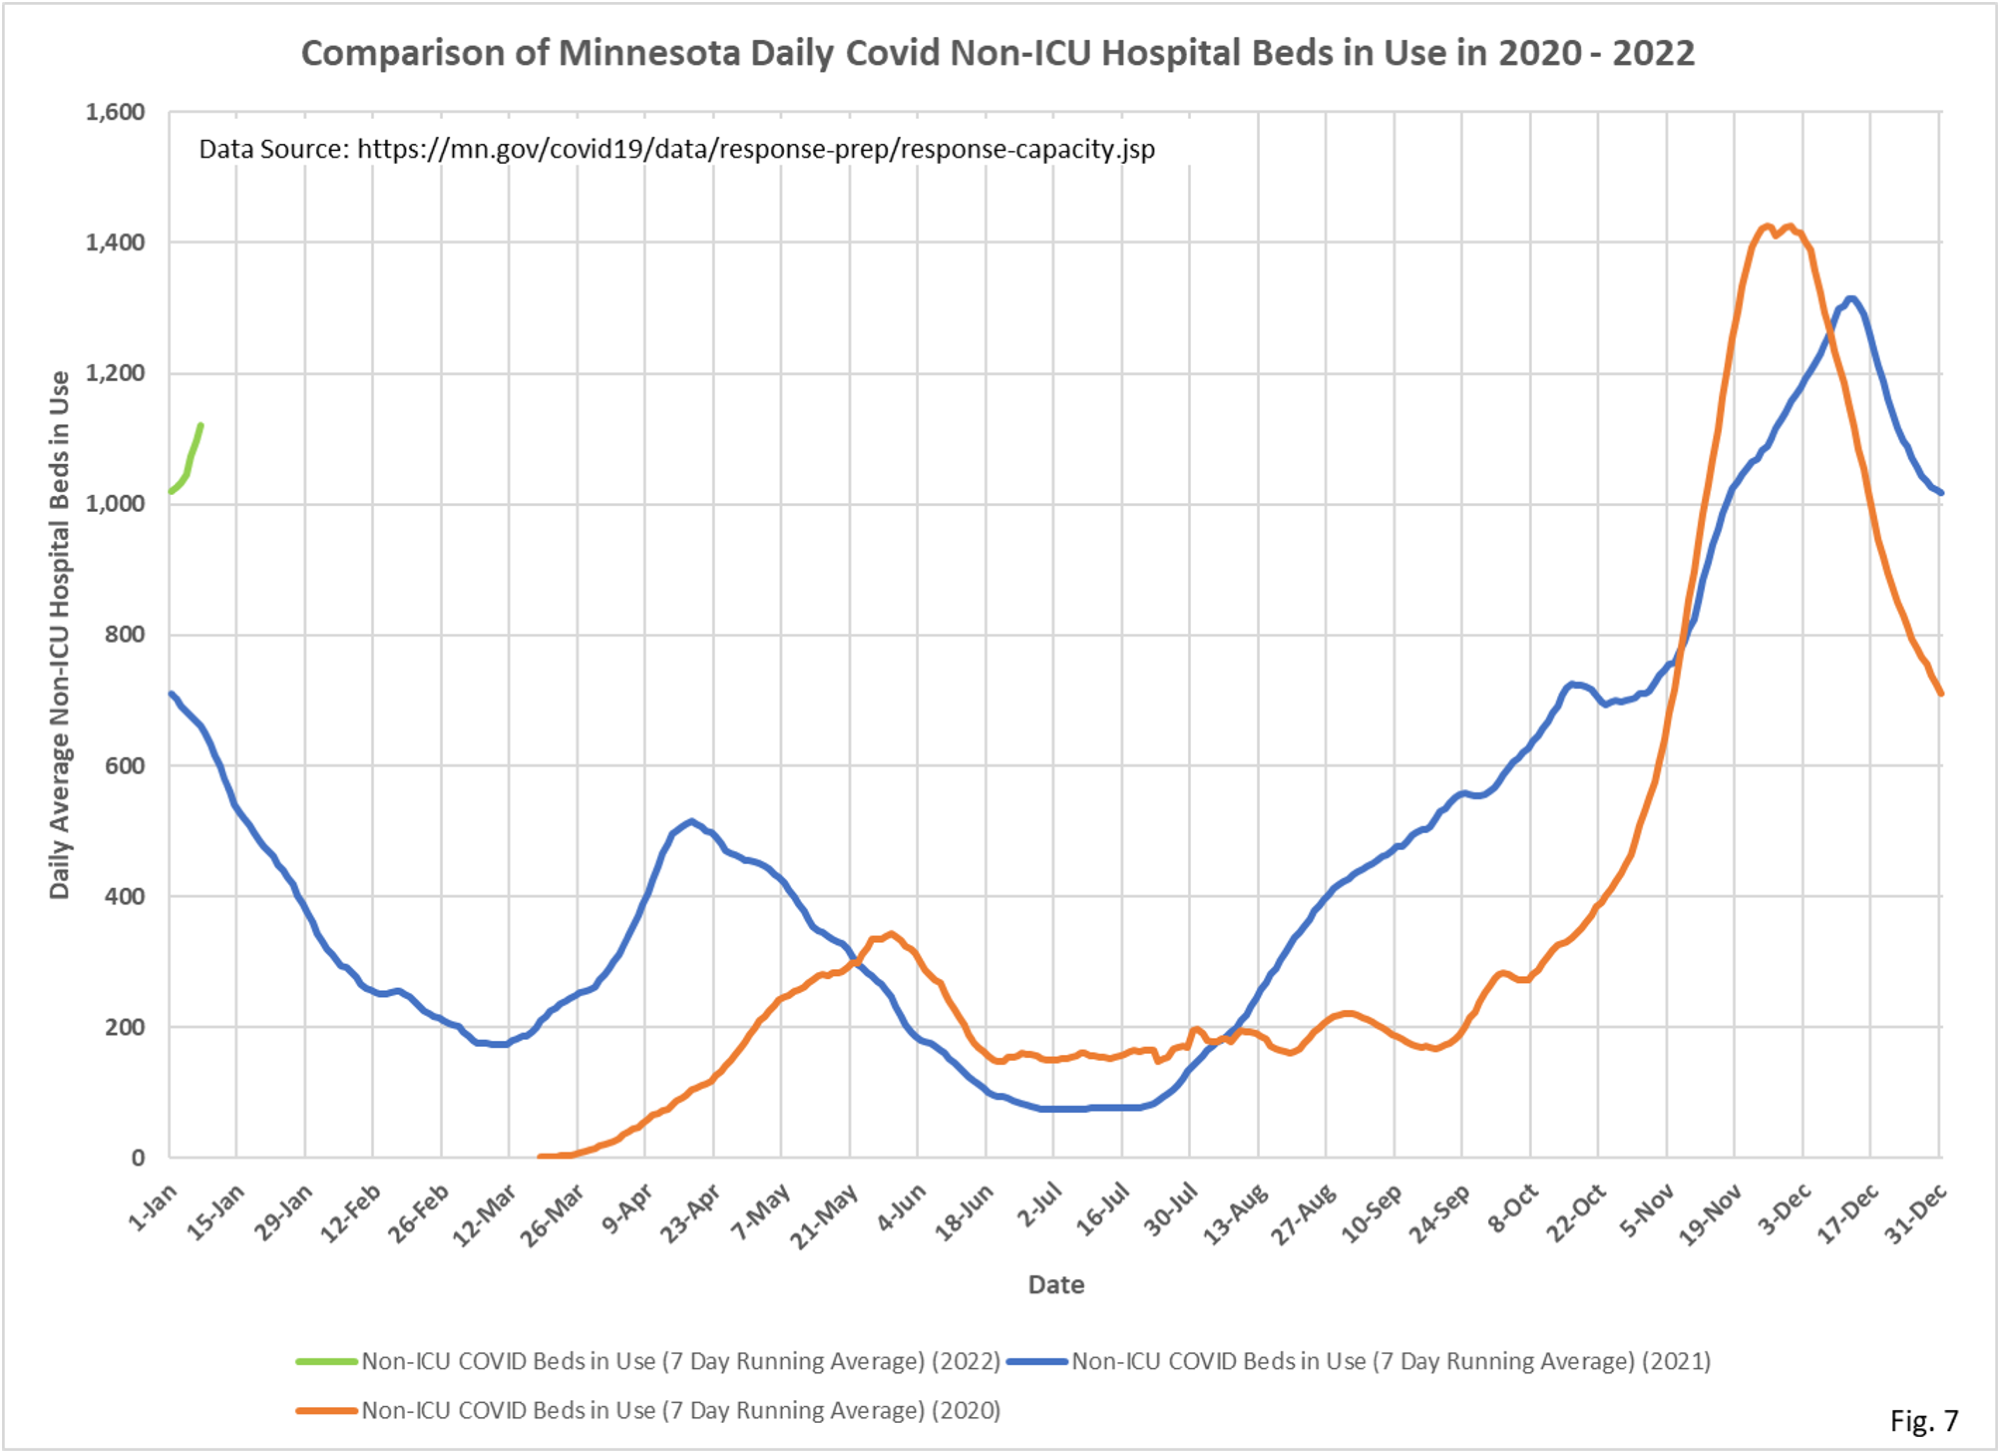

The Orange (2020 or 2021 ) ICU & non Icu hospitalizations appear to be mislabeled in the charts
Should orange be labeled 2020?
will check and fix