The usual breakdown of events by age. There will be an updated set focused on the younger age groups, due to the continued terrorism about child hospitalizations. Dave’s notes:
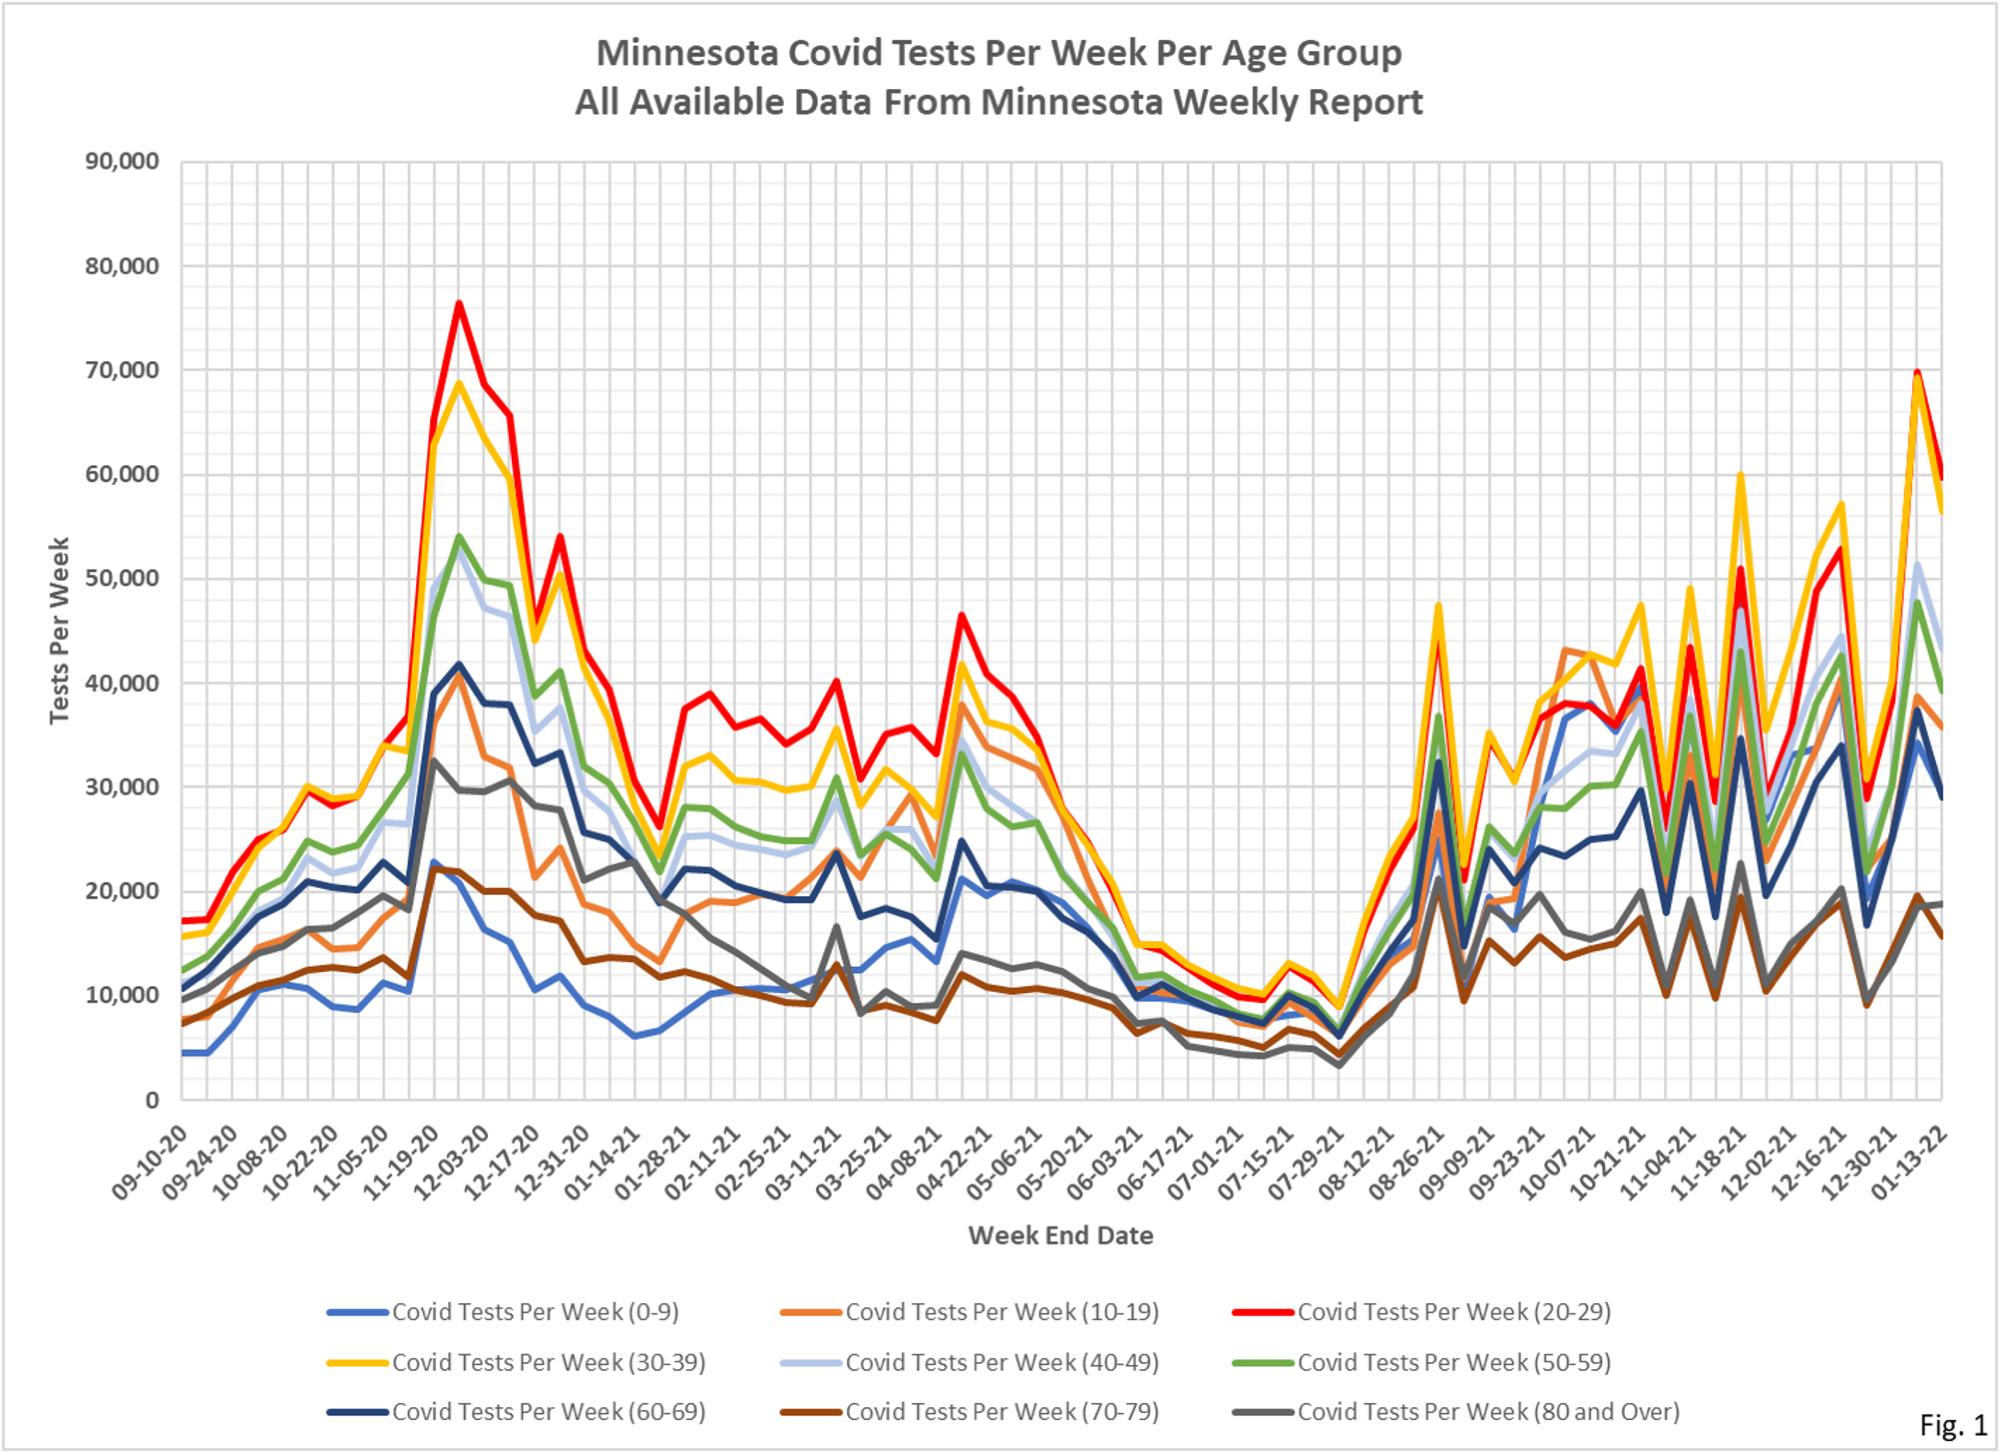
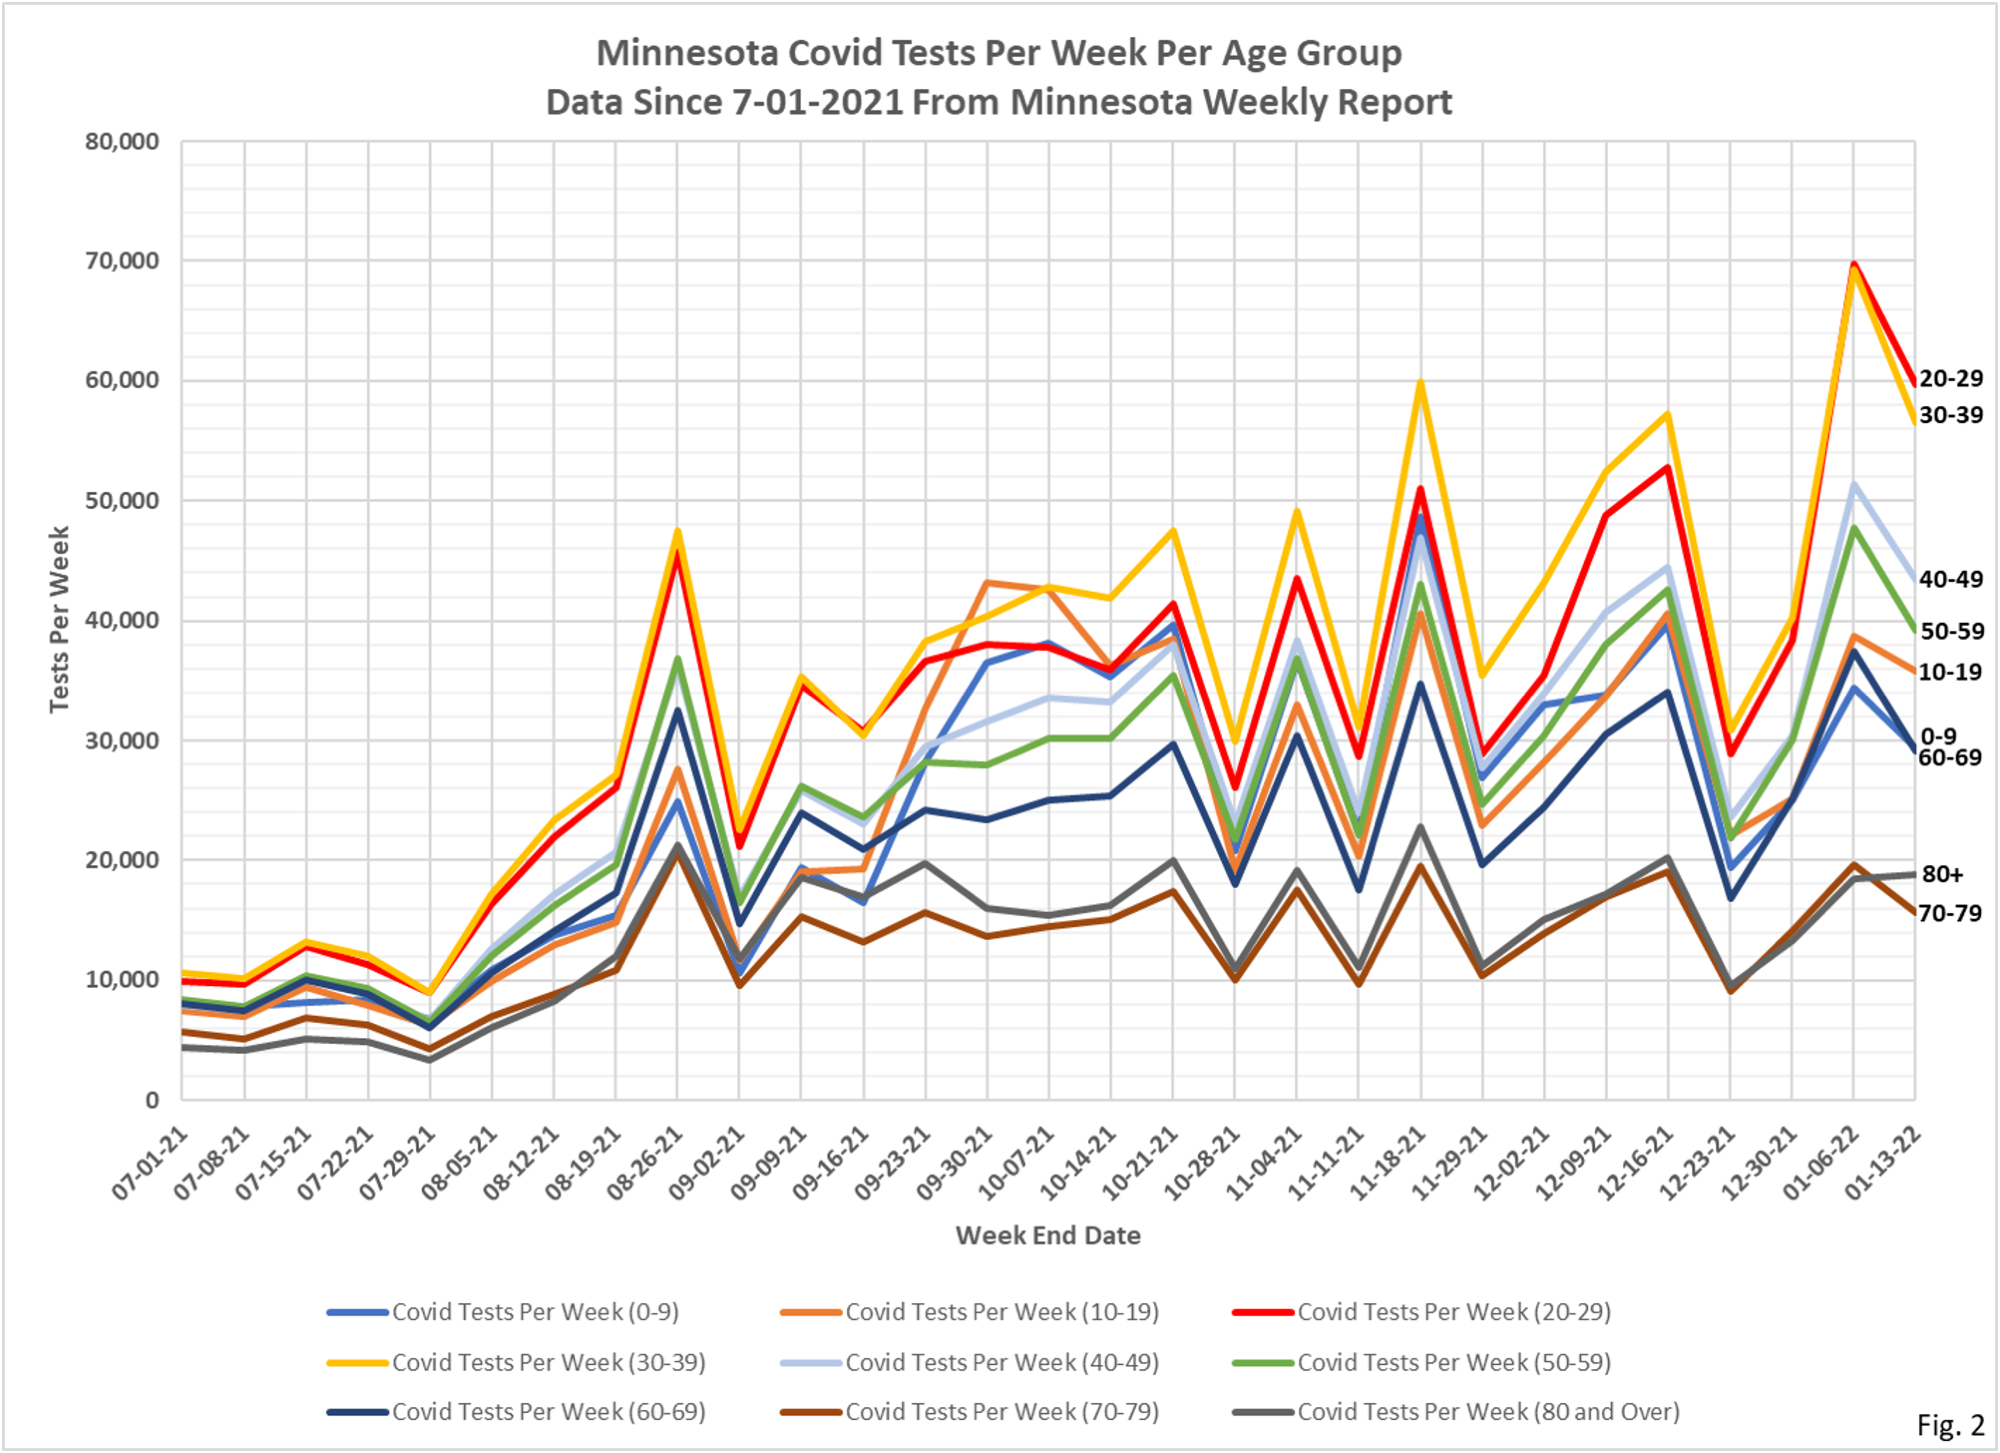
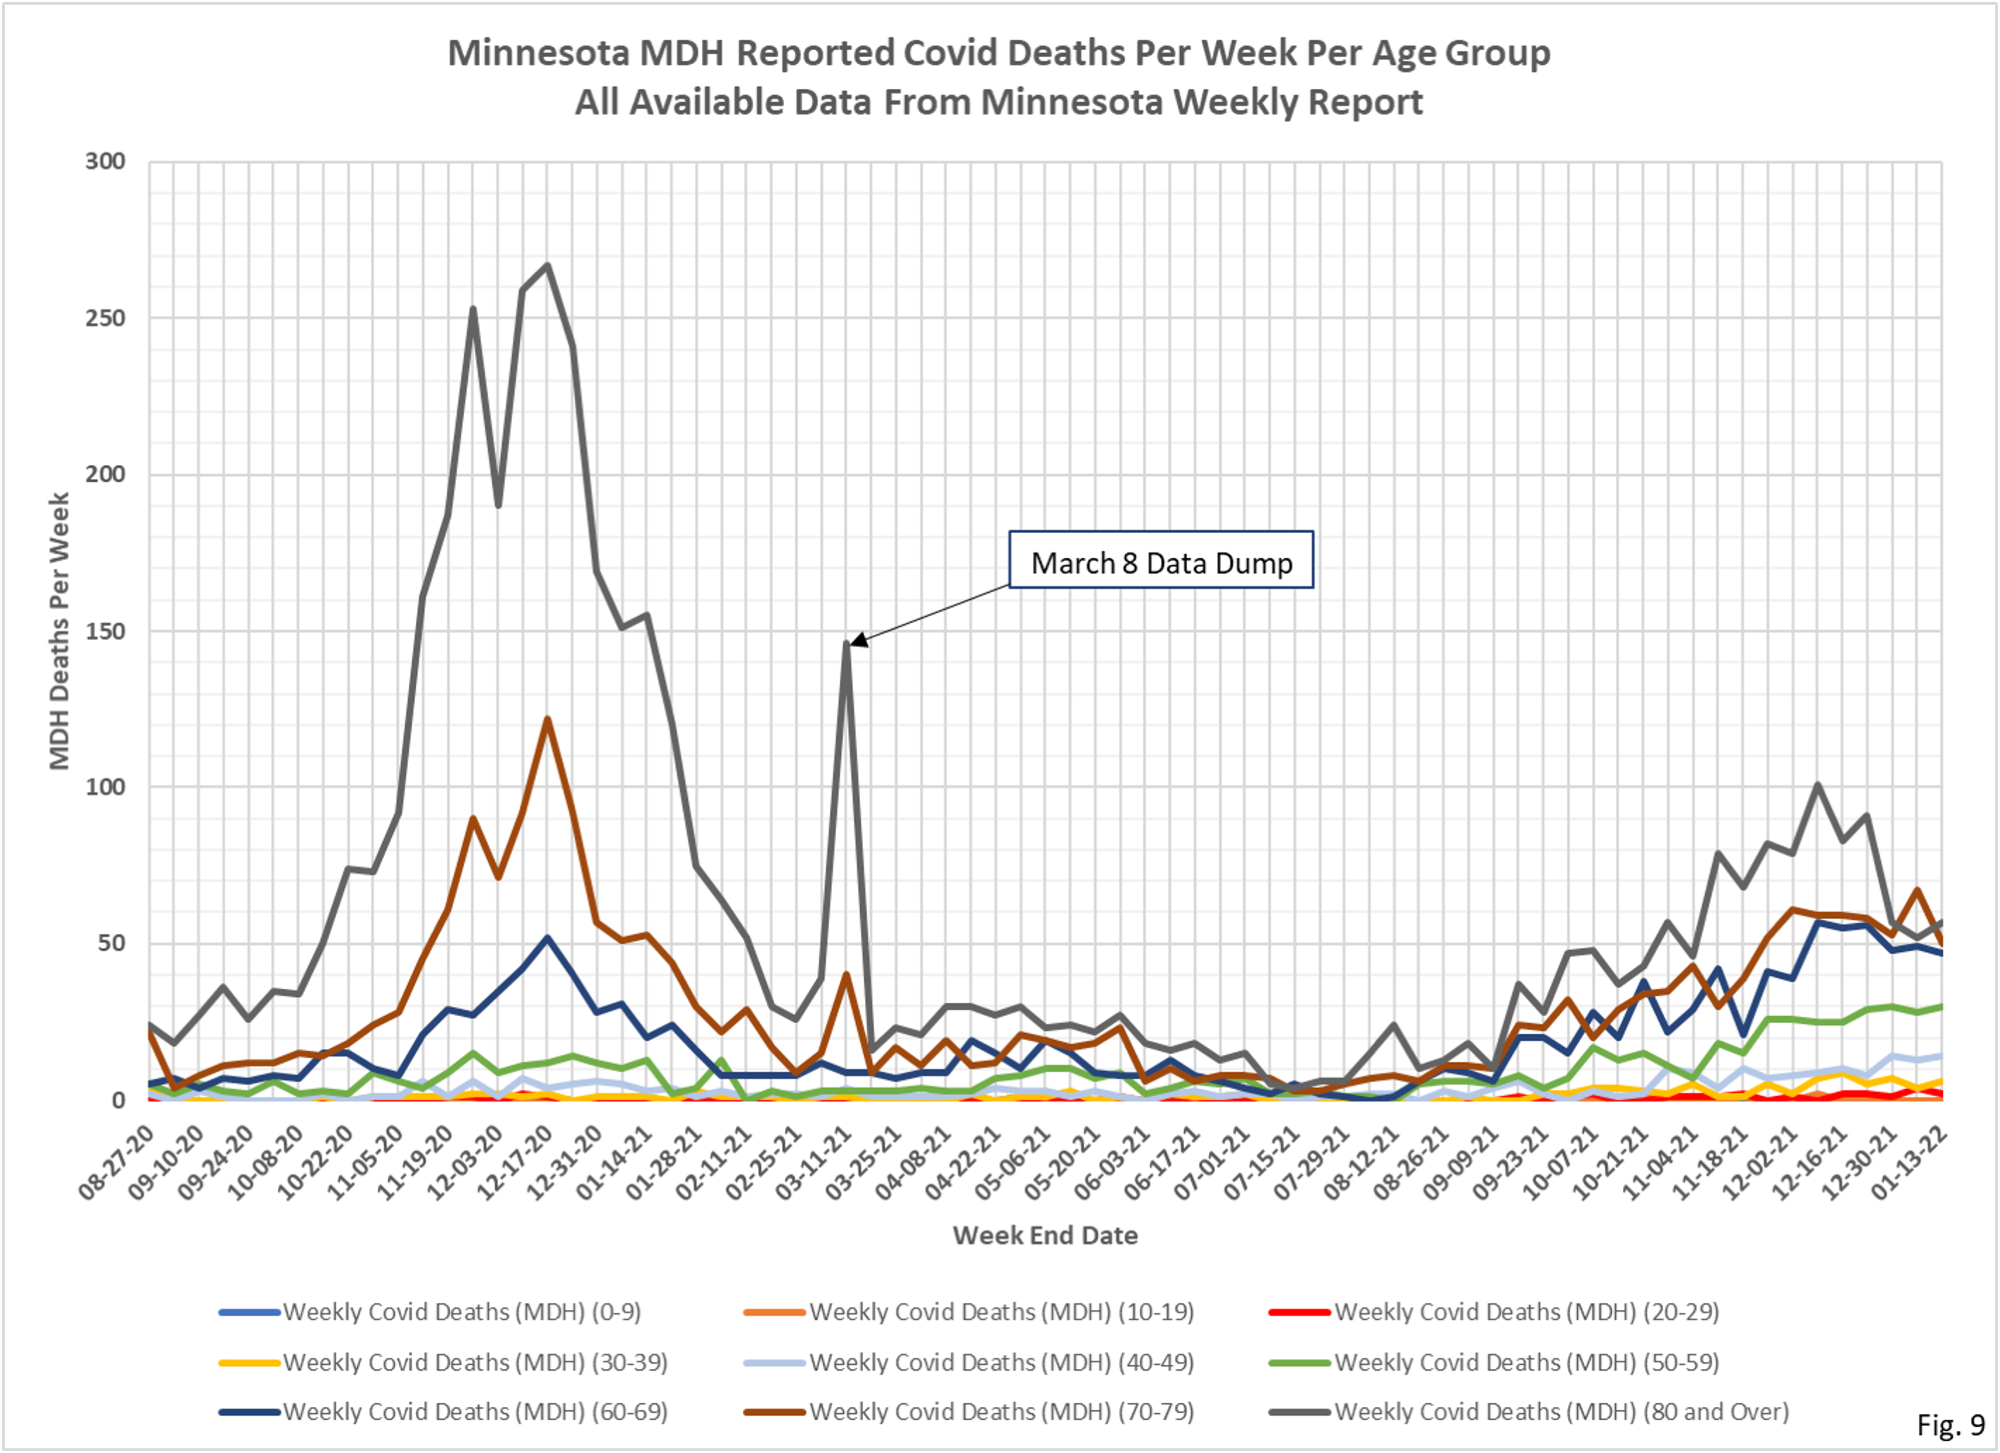
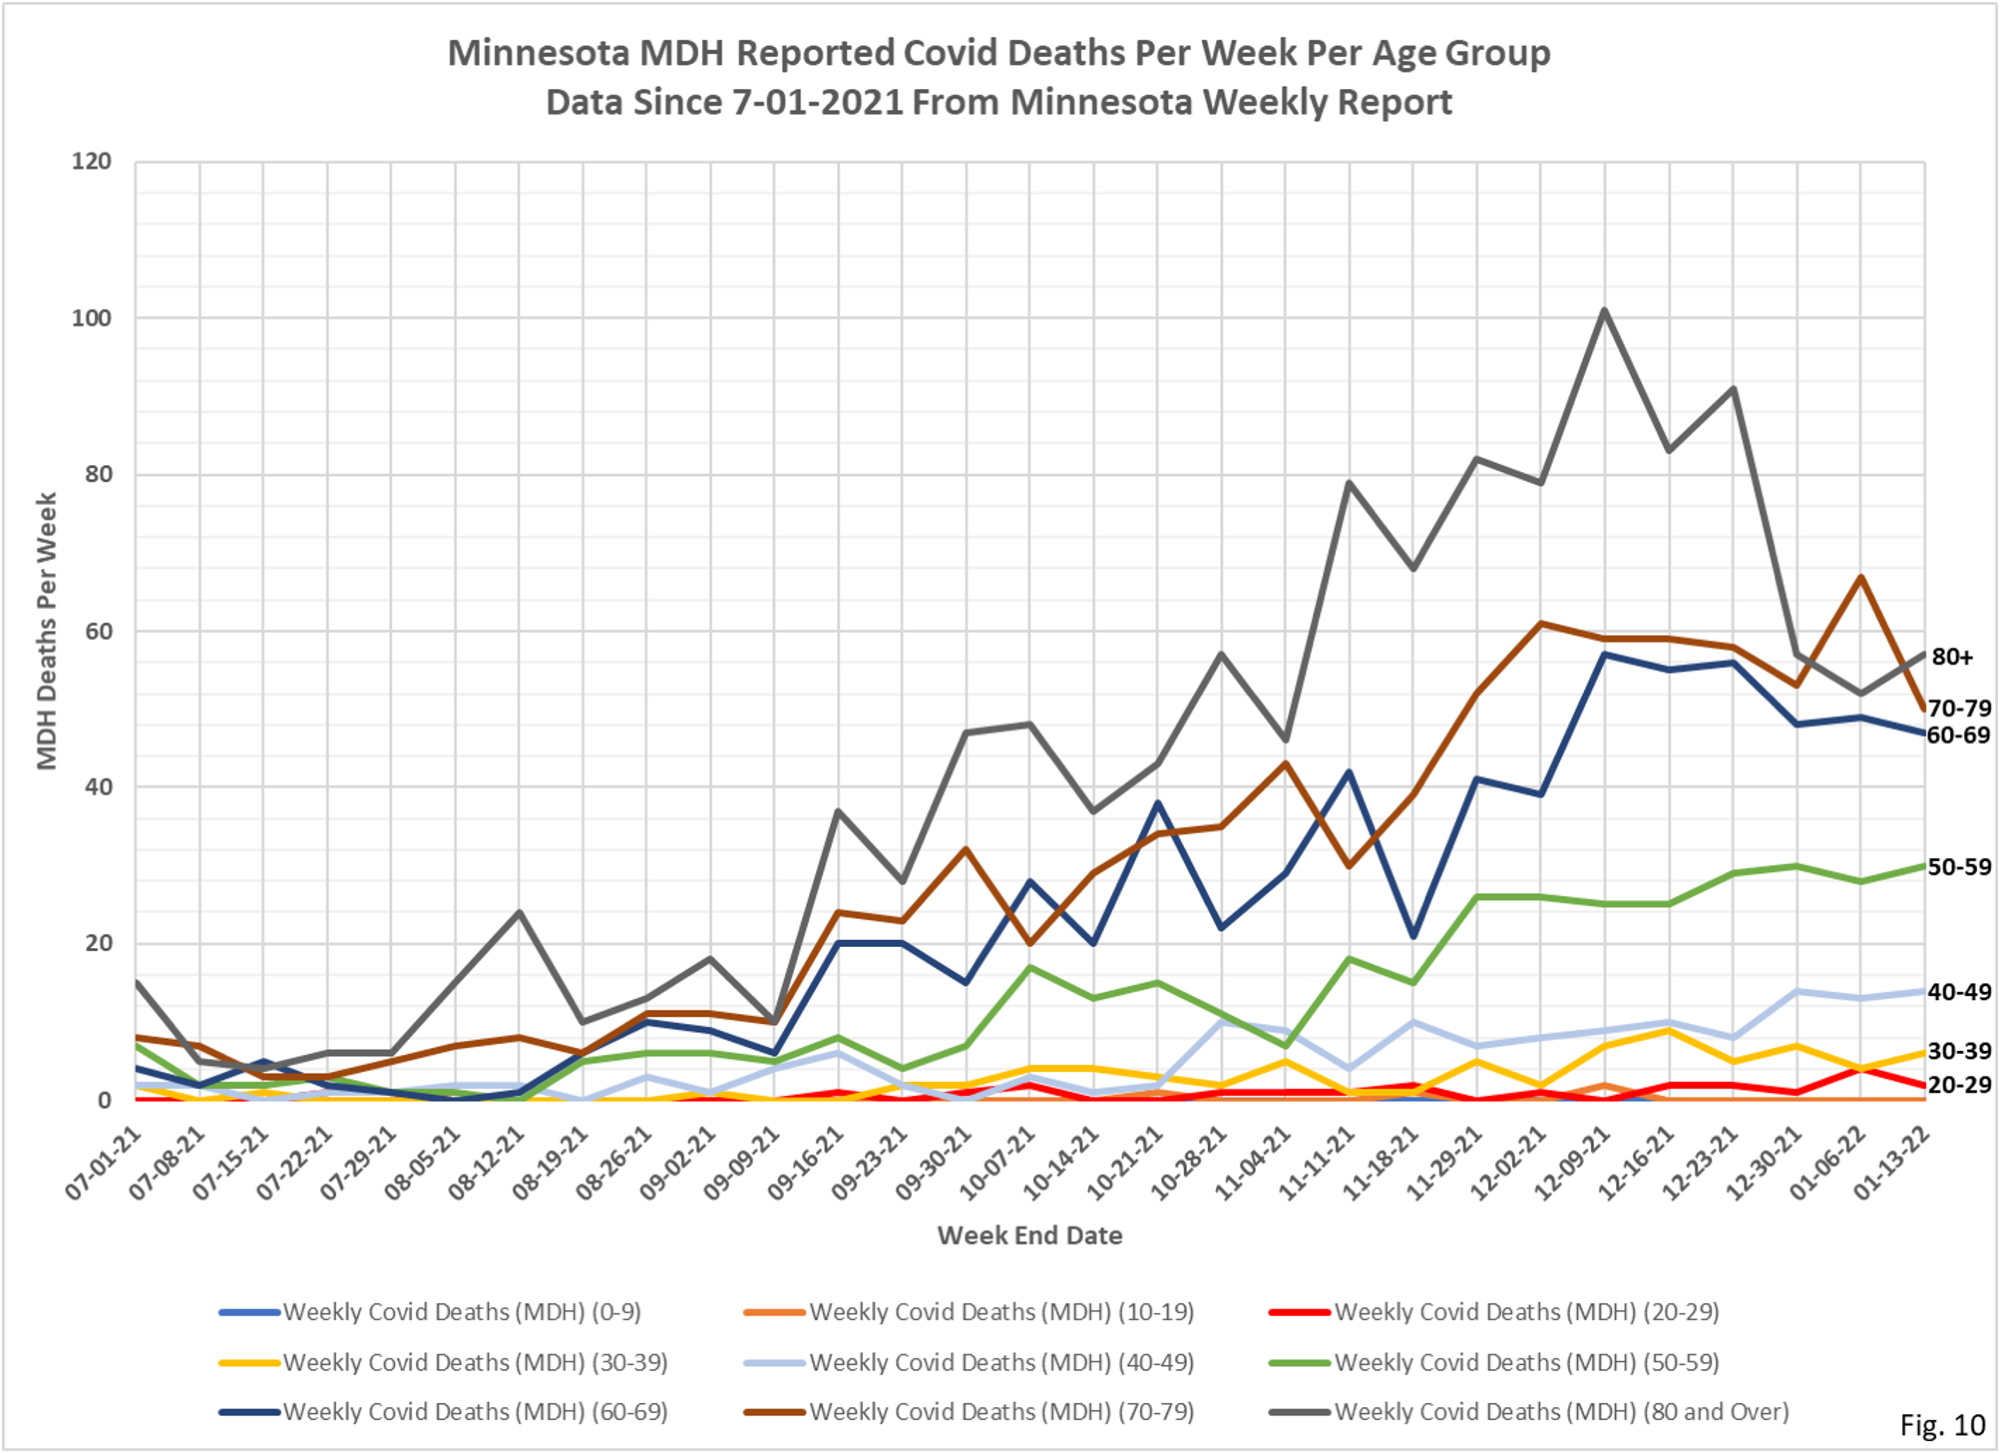
1. There are 2 slides for each set of data, one showing data for the whole pandemic and a second chart showing only data since early July, 2021. Note that the full pandemic slides have different start dates, because Minnesota Department started publishing different data on different dates.
2. The data for the charts on testing, hospital admissions, and deaths comes from the Minnesota Weekly Report (available here: https://www.health.state.mn.us/diseases/coronavirus/stats/index.html). The data in the Weekly Report is presented as cumulative totals for each data type each week. I am taking weekly differences and assembling the data into charts. This data is by date of report, meaning the charts are documenting new events reported this week, even though the underlying event occurred sometime in the past. The data is provided for 5 year age groups, and I am assembling into 10 year age groups to make the charts more readable.
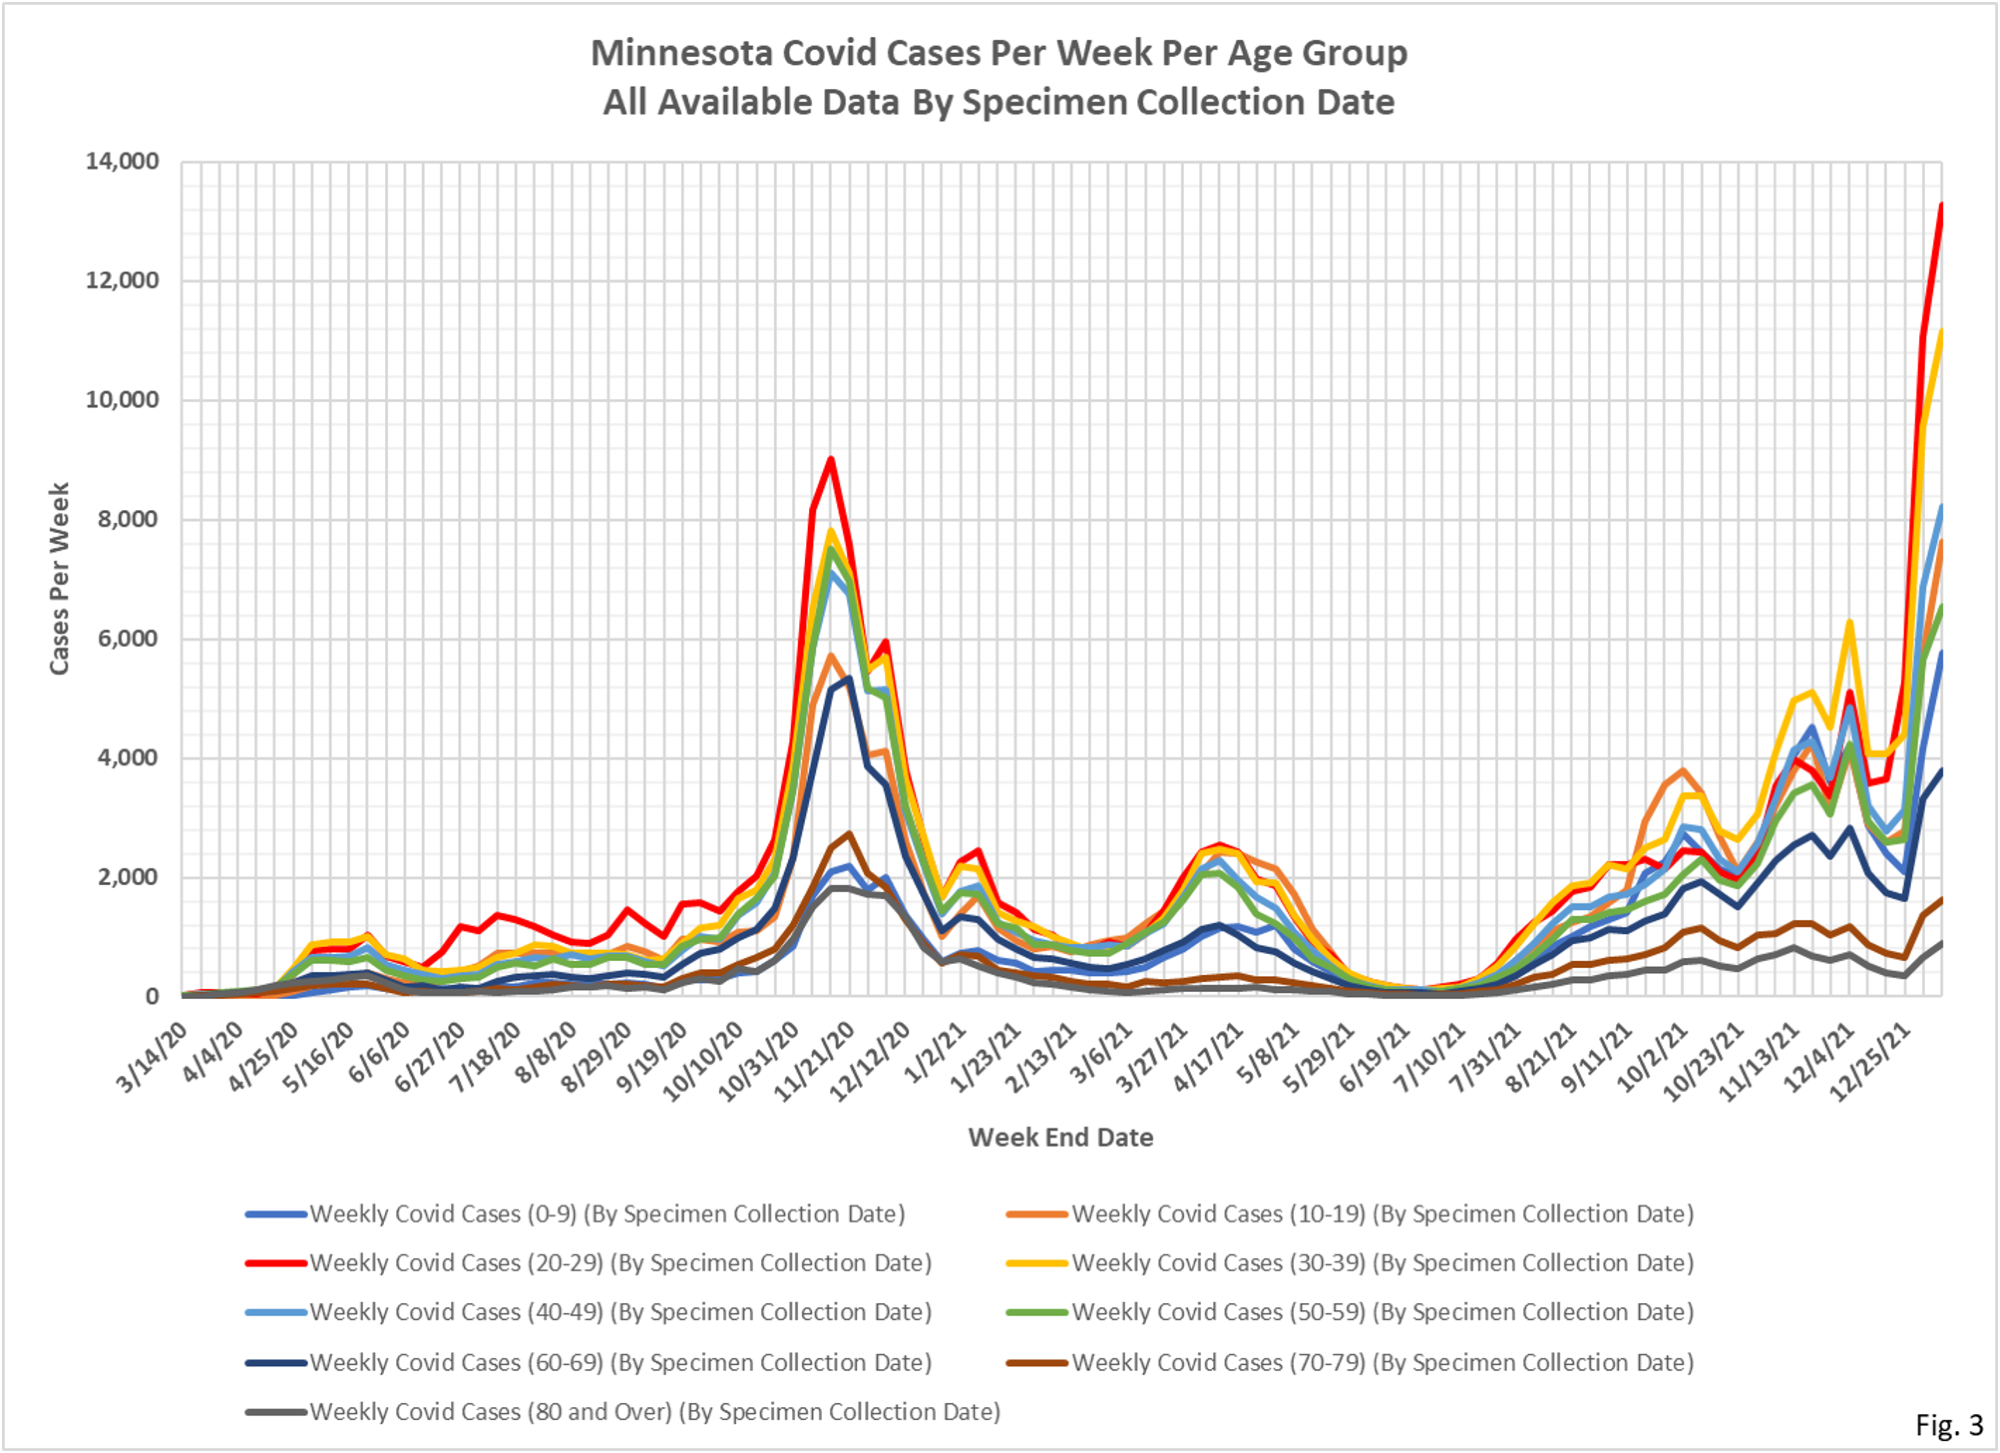
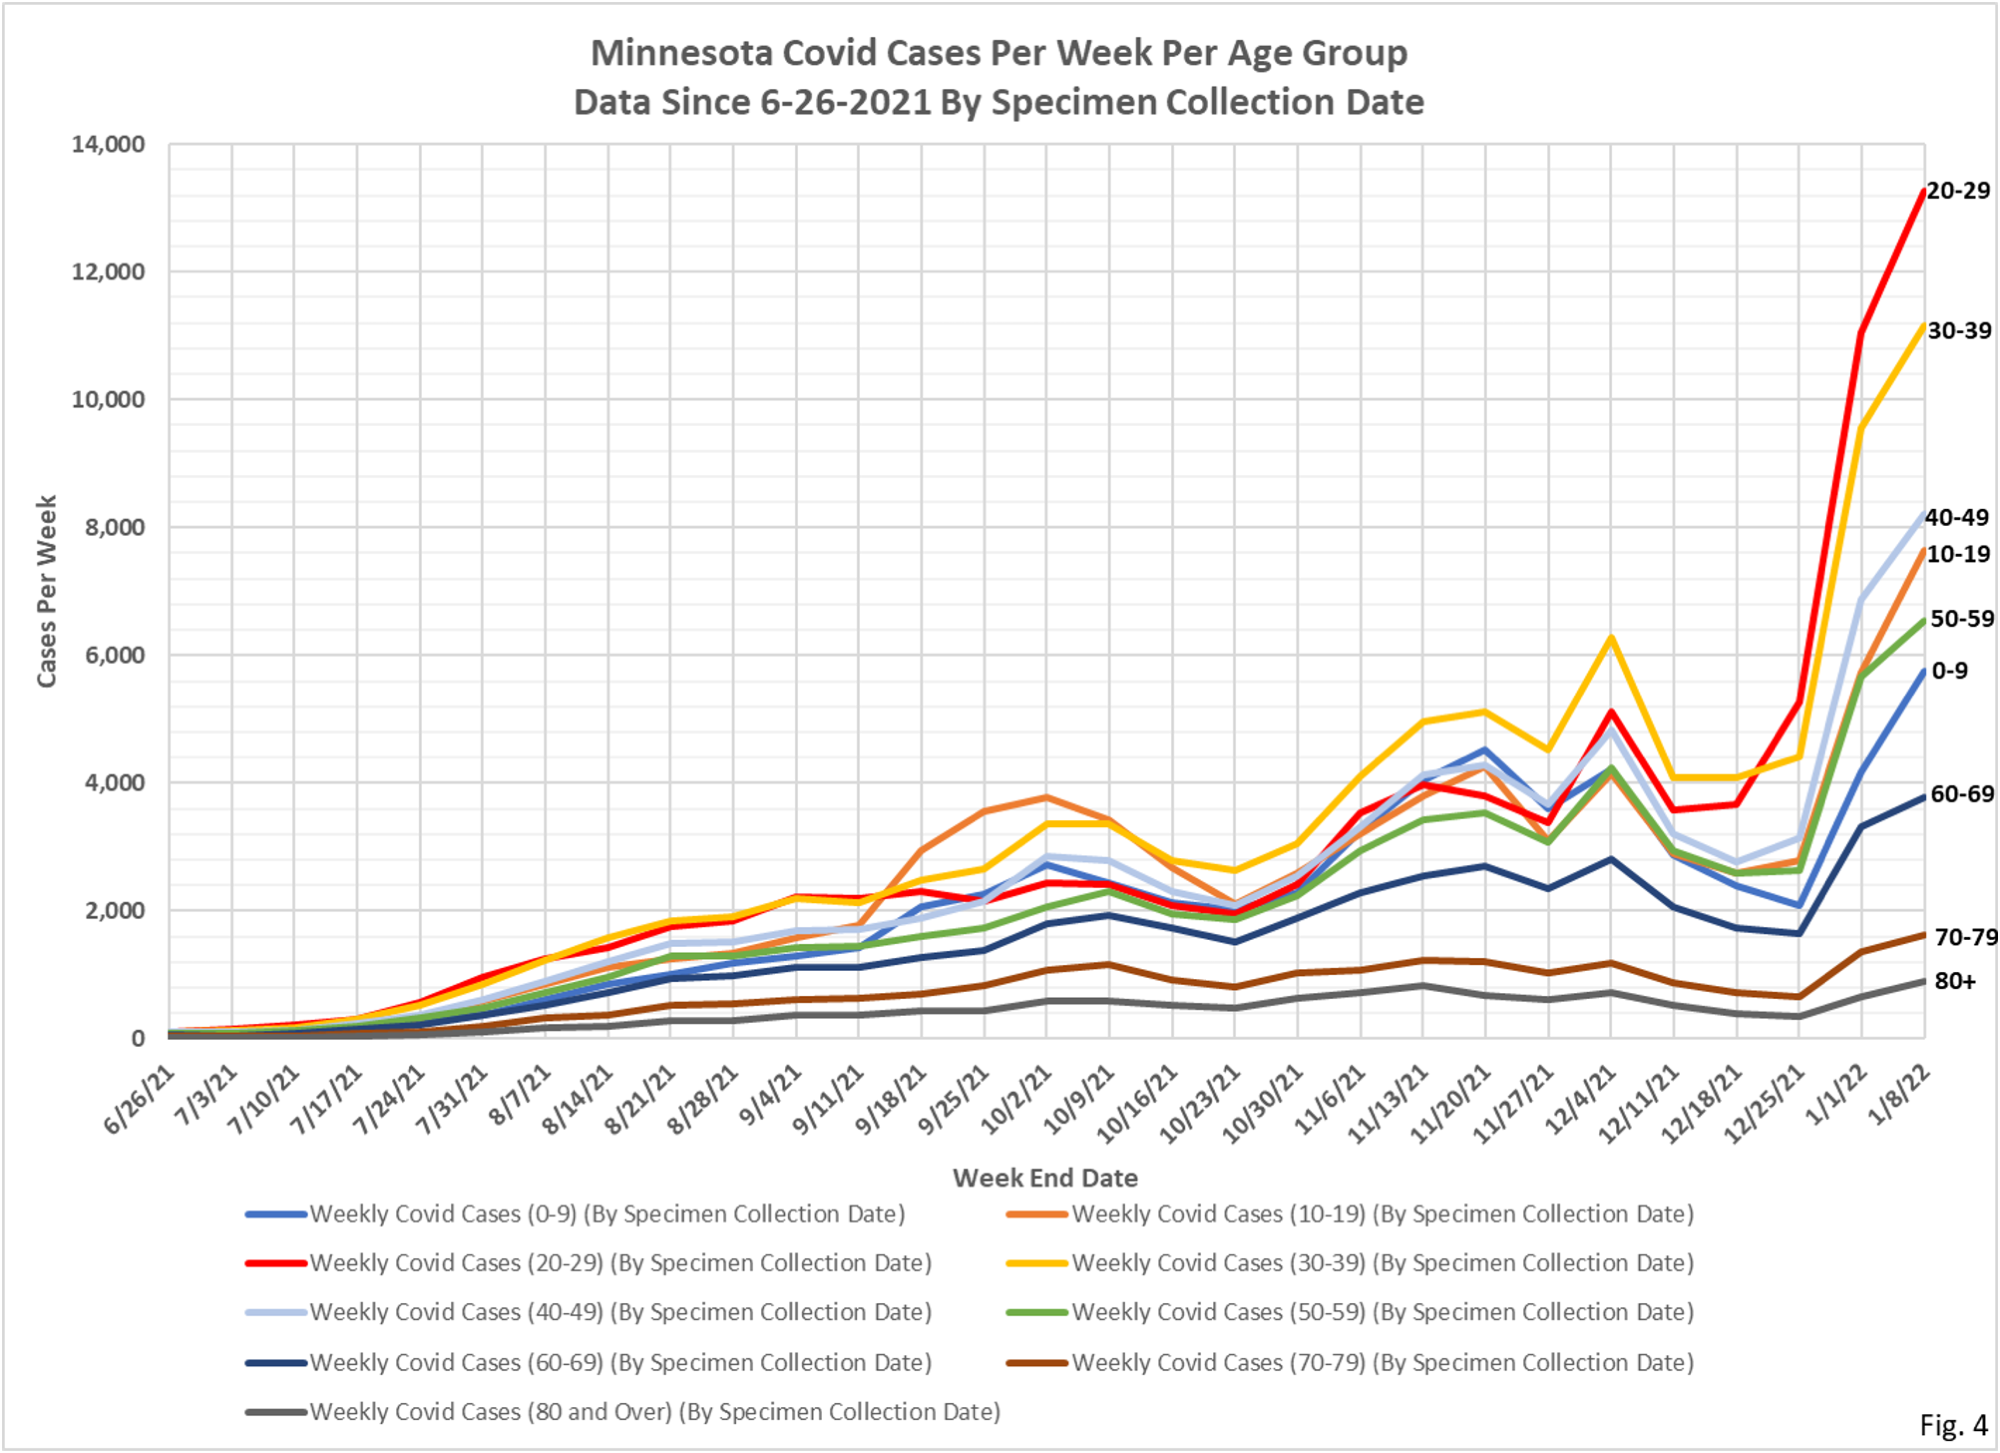
3. The data for the Covid cases per week come from a data file published along with the Minnesota Weekly Report, here: https://www.health.state.mn.us/diseases/coronavirus/stats/index.html#wagscd1 This data is published by date of specimen collection, rather than by date of report as the other data is. The data is provided as cases per week in 5 year age groups. I am compiling the data into 10 year age groups in order for the charts to be more readable. This data is updated by date of specimen collection, so it is possible that past week’s data will be updated.
4. Fig. 1 and 2: Covid Tests Per Week. Reported testing is lower this week for all age groups except the 80+ age group. Why would this group be different than all other groups this week? Real or data reporting artifact?
5. Fig. 3 and 4: Covid Cases Per Week. The Covid cases this week were higher in all age groups for the second week in a row. The rate of increase week over week has appeared to slow. The 20-29 and 30-39 age groups were much higher, despite the reduced testing in these groups. The 0-9 and 10-19 age groups stand out as having larger increases than the other groups. Total cases for the week were reported as 58,889, a 21% increase from last week’s revised total of 48,366 cases. This is the highest total cases per week reported at any time during the pandemic.
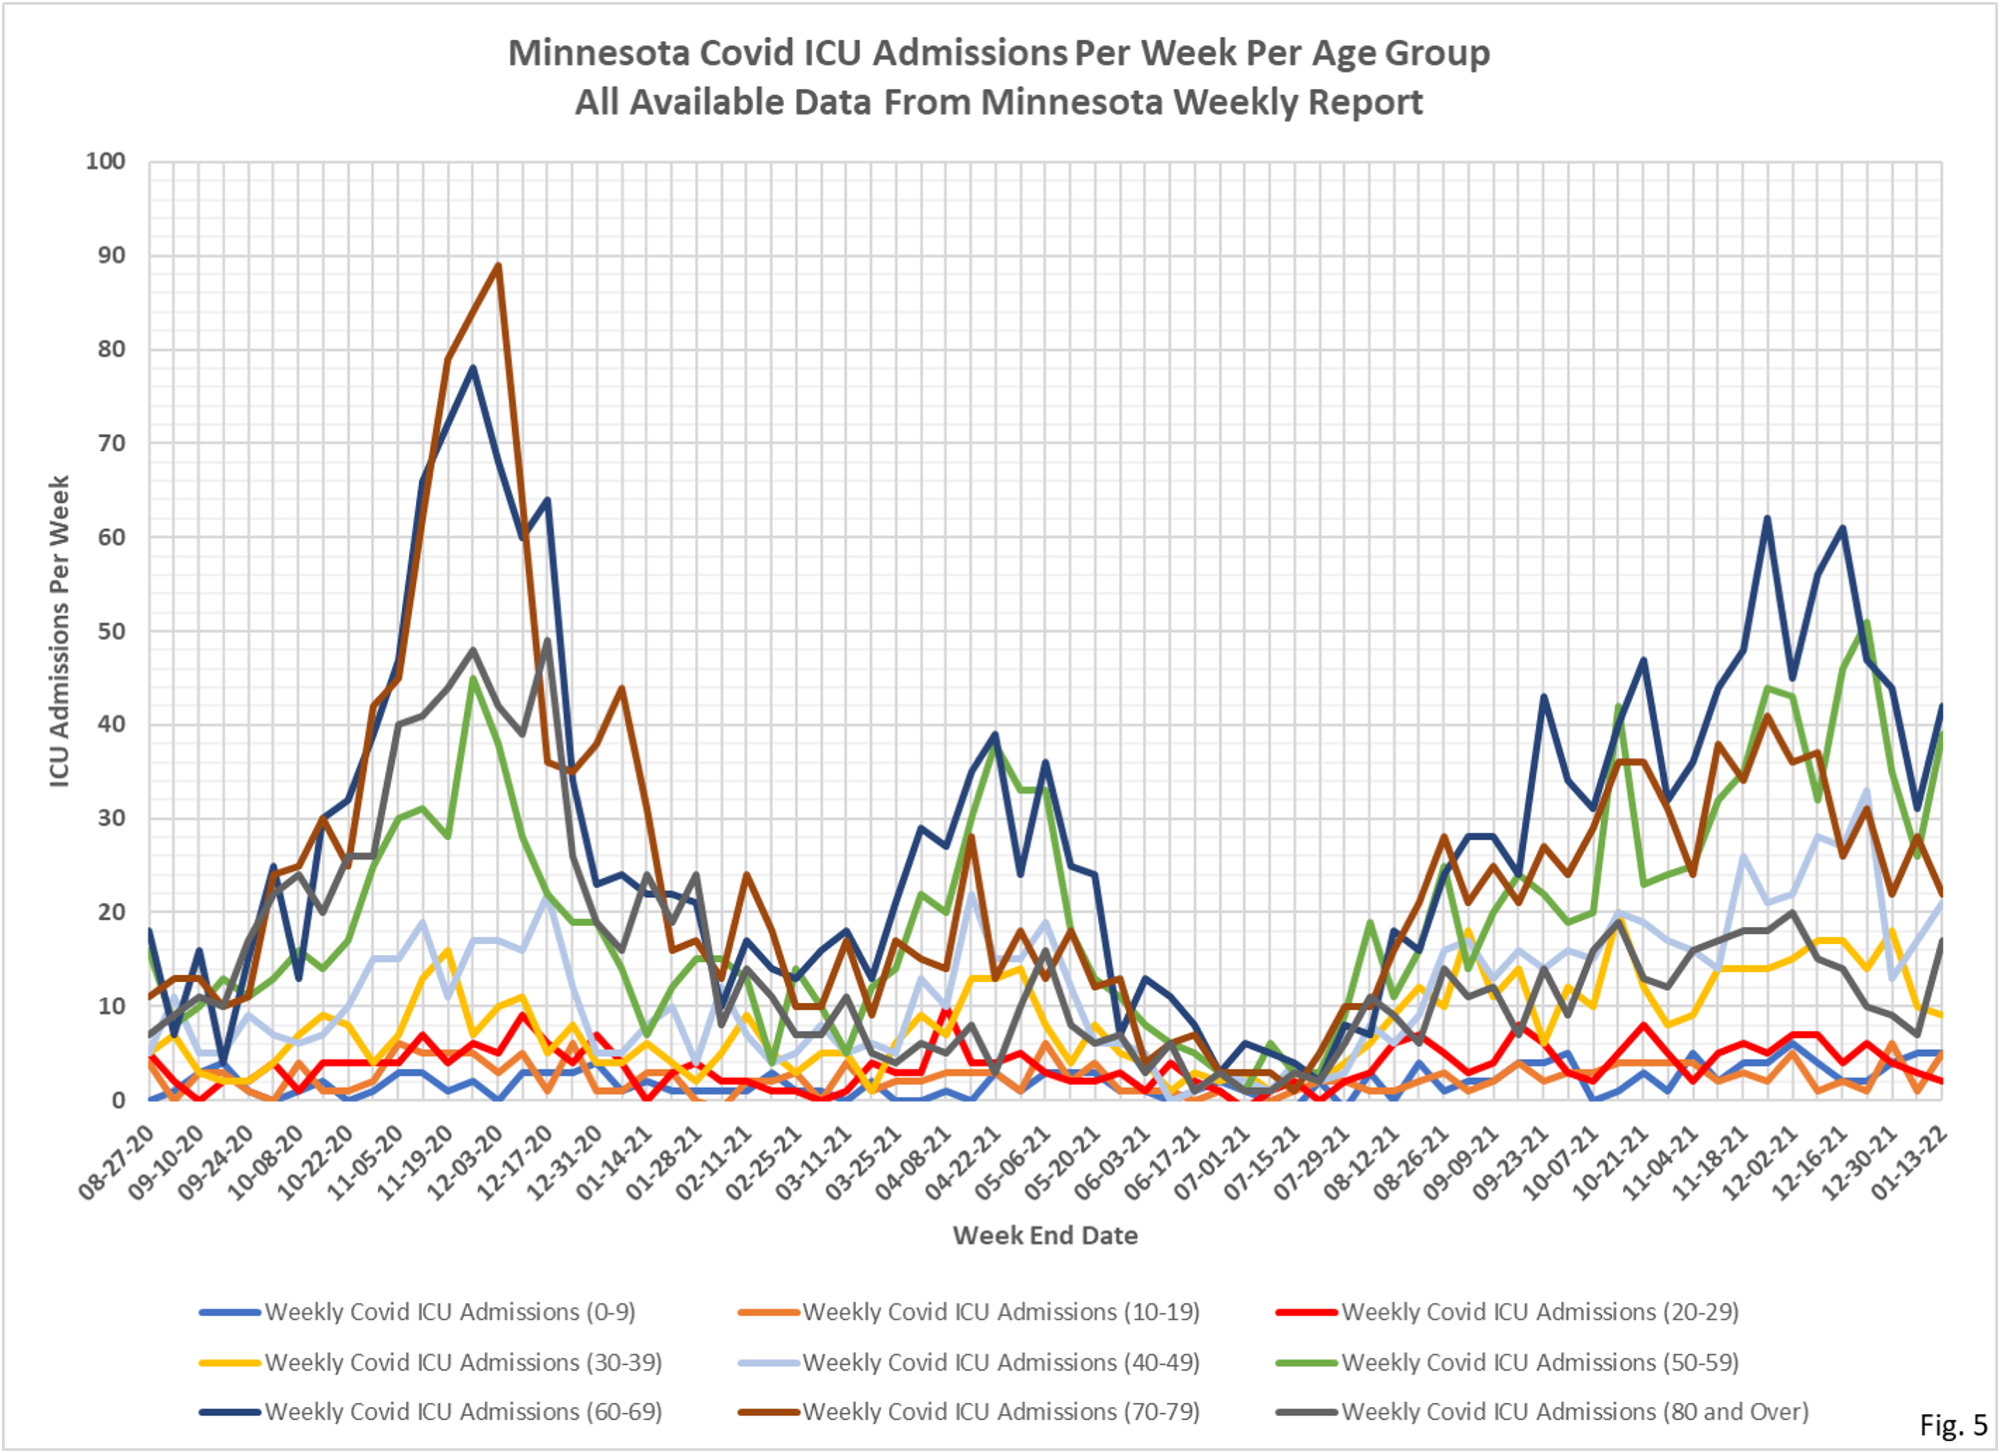
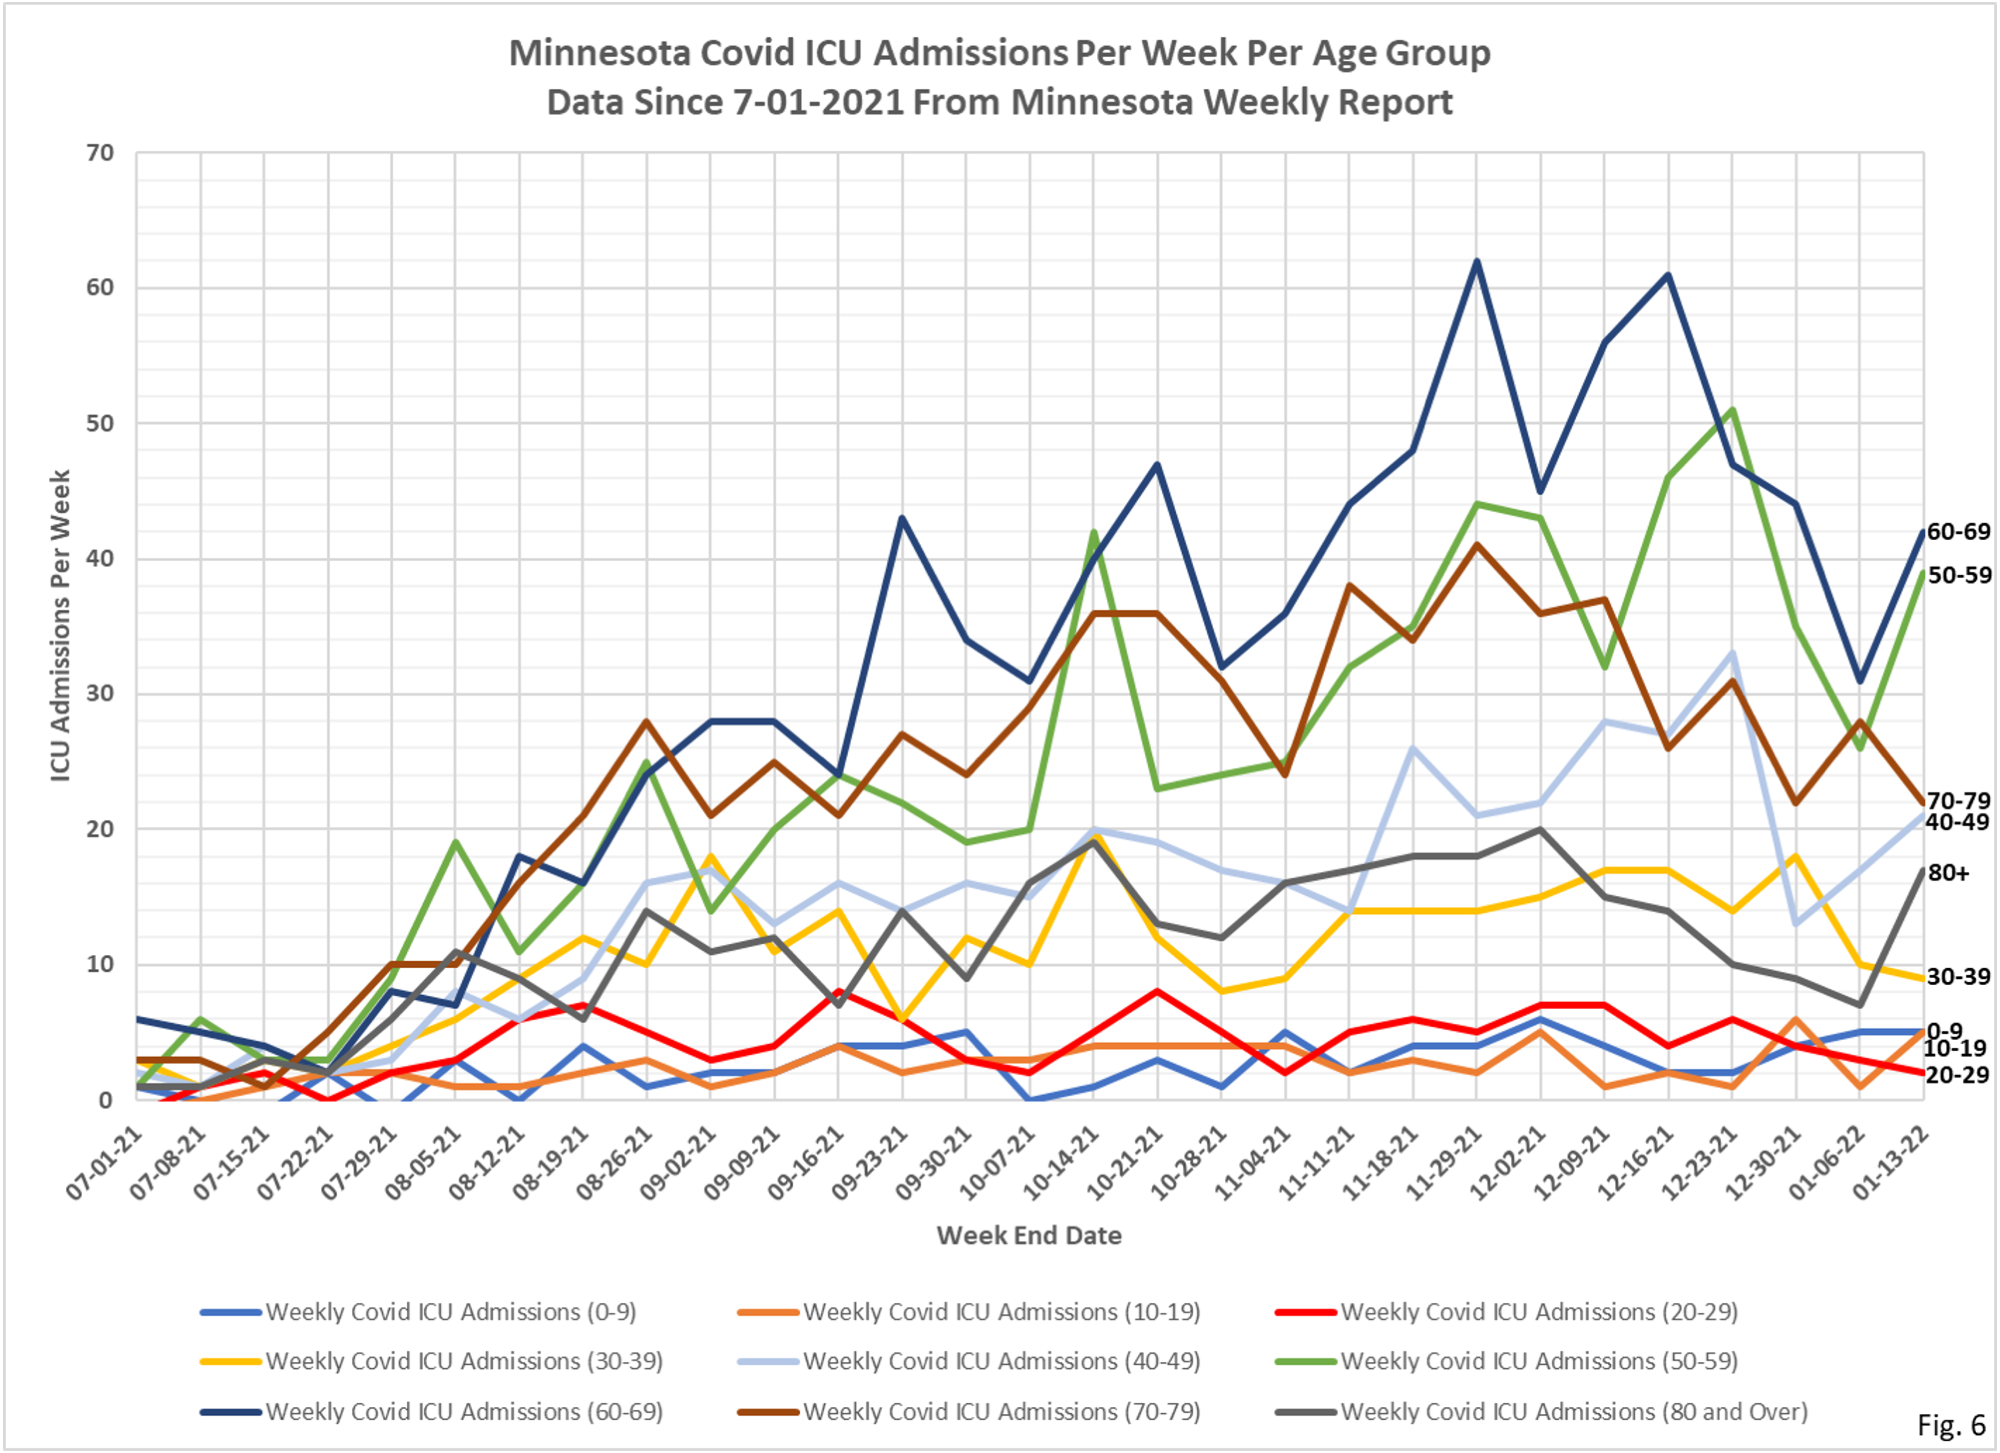
6. Fig. 5 and 6: ICU Covid Admissions Per Week. ICU Covid admissions were mixed this week, with the 20 and under age groups remaining at very low levels; the 70-79 and 30-39 age groups modestly lower, and the remaining age groups were higher, generally within the range of the past few weeks. The young age groups continue to have very low Covid ICU admissions; the 0-9 age group was at 5 admissions for the second week in a row, the 10-19 age group increased from 1 to 5, and the 20-29 age group decreased from 3 to 2. Note that the 20-29 age group especially has very low ICU admissions, significant considering the number of cases reported for this age group. Admissions in children likely reflect some incidental related to other conditions like RSV infection. Total ICU admissions for the week were 162, an increase from 128 admissions the prior week.
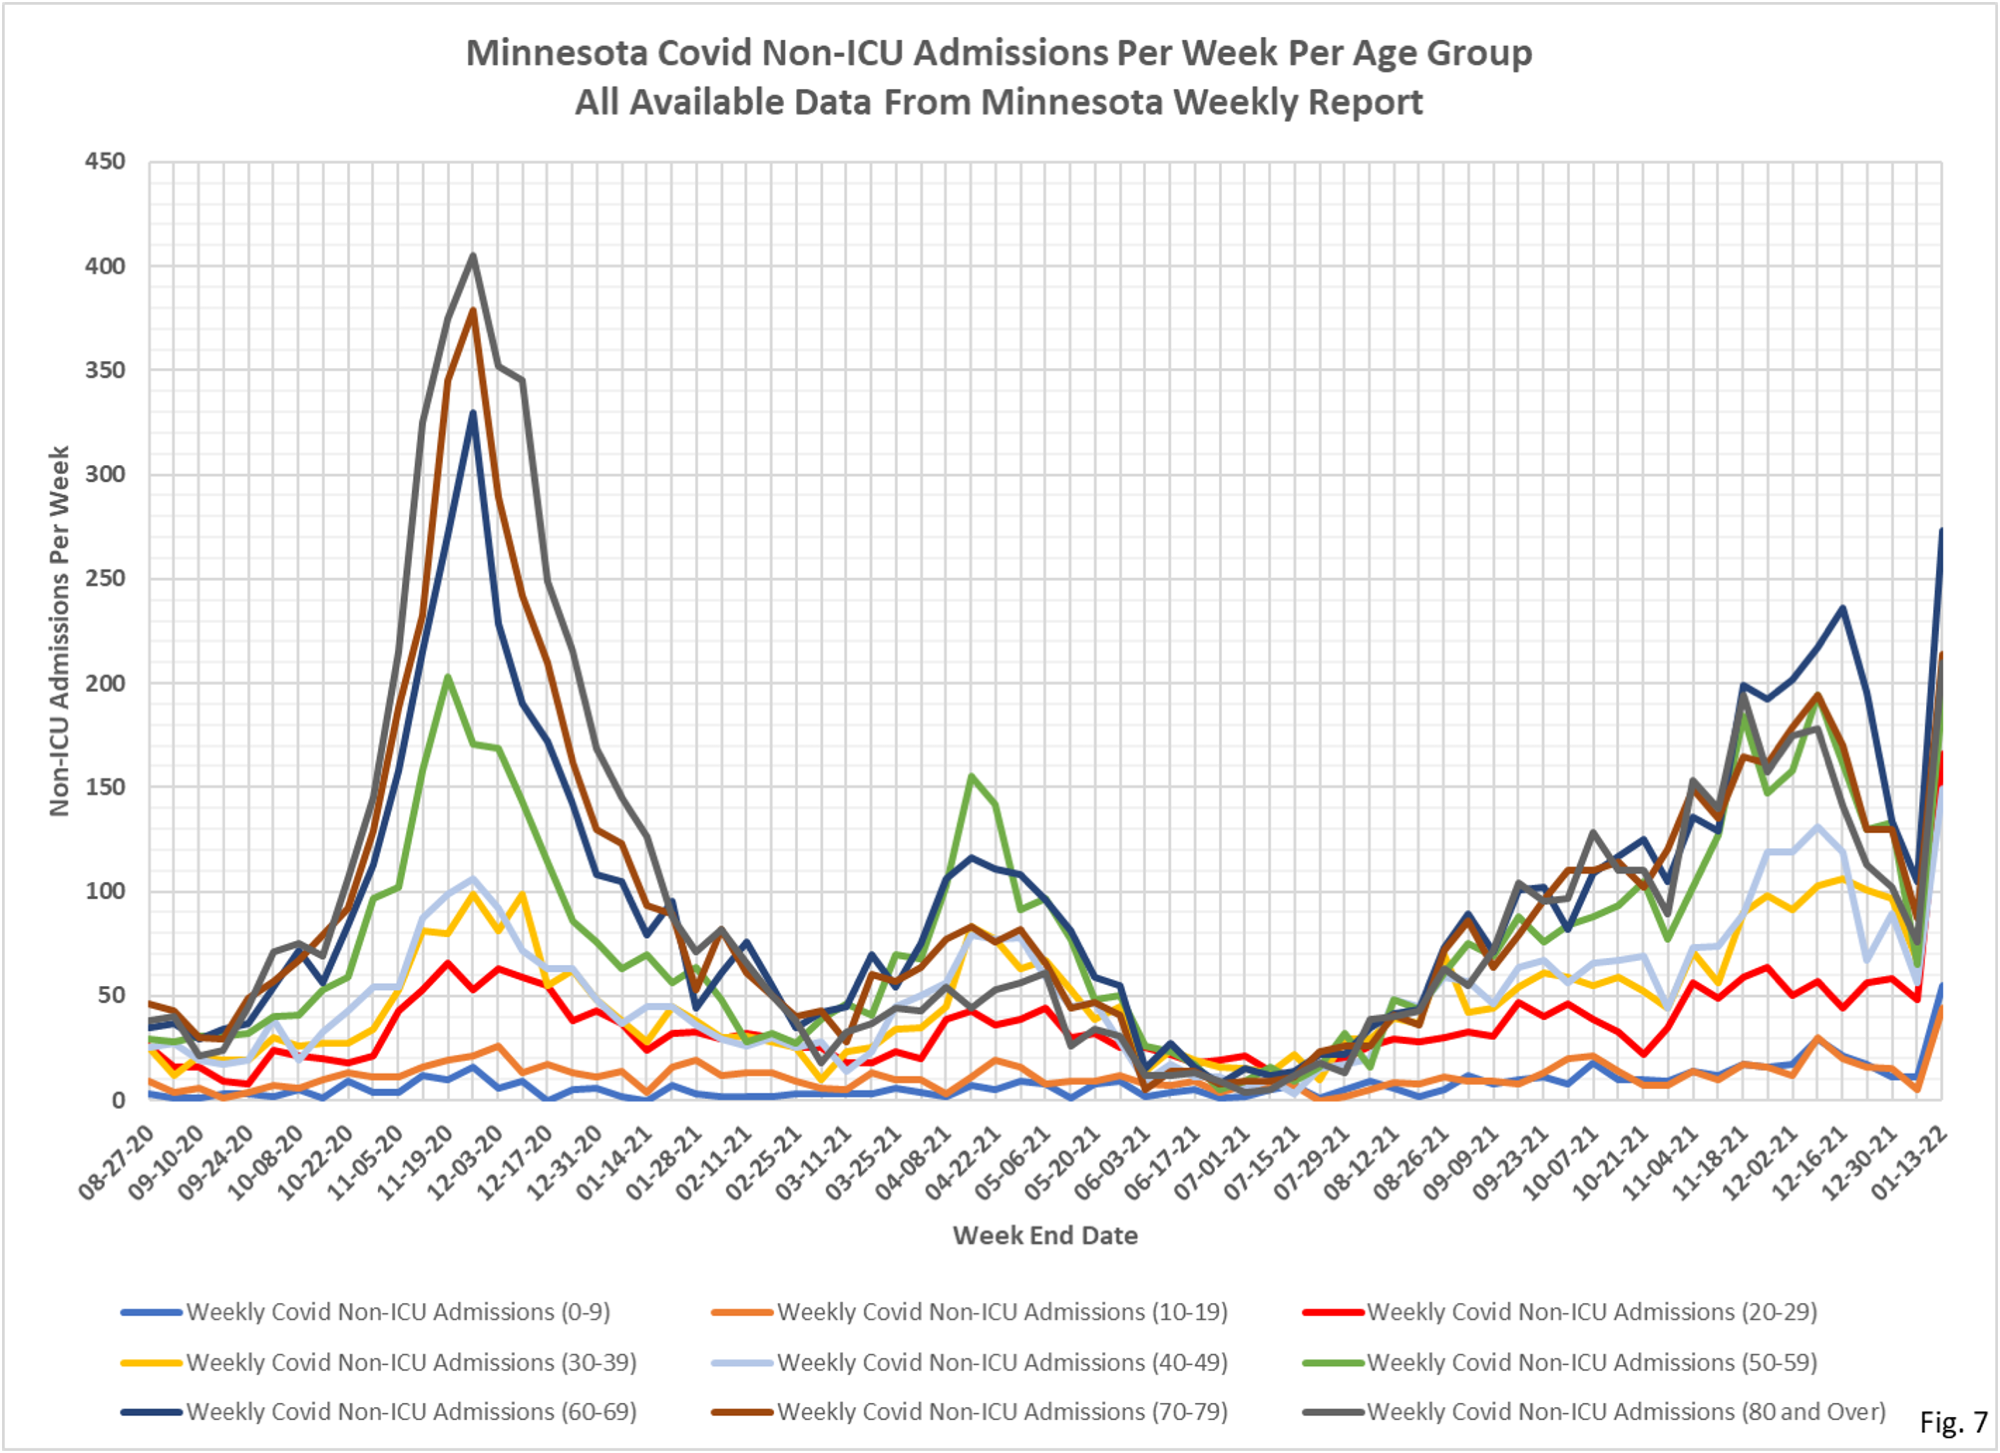
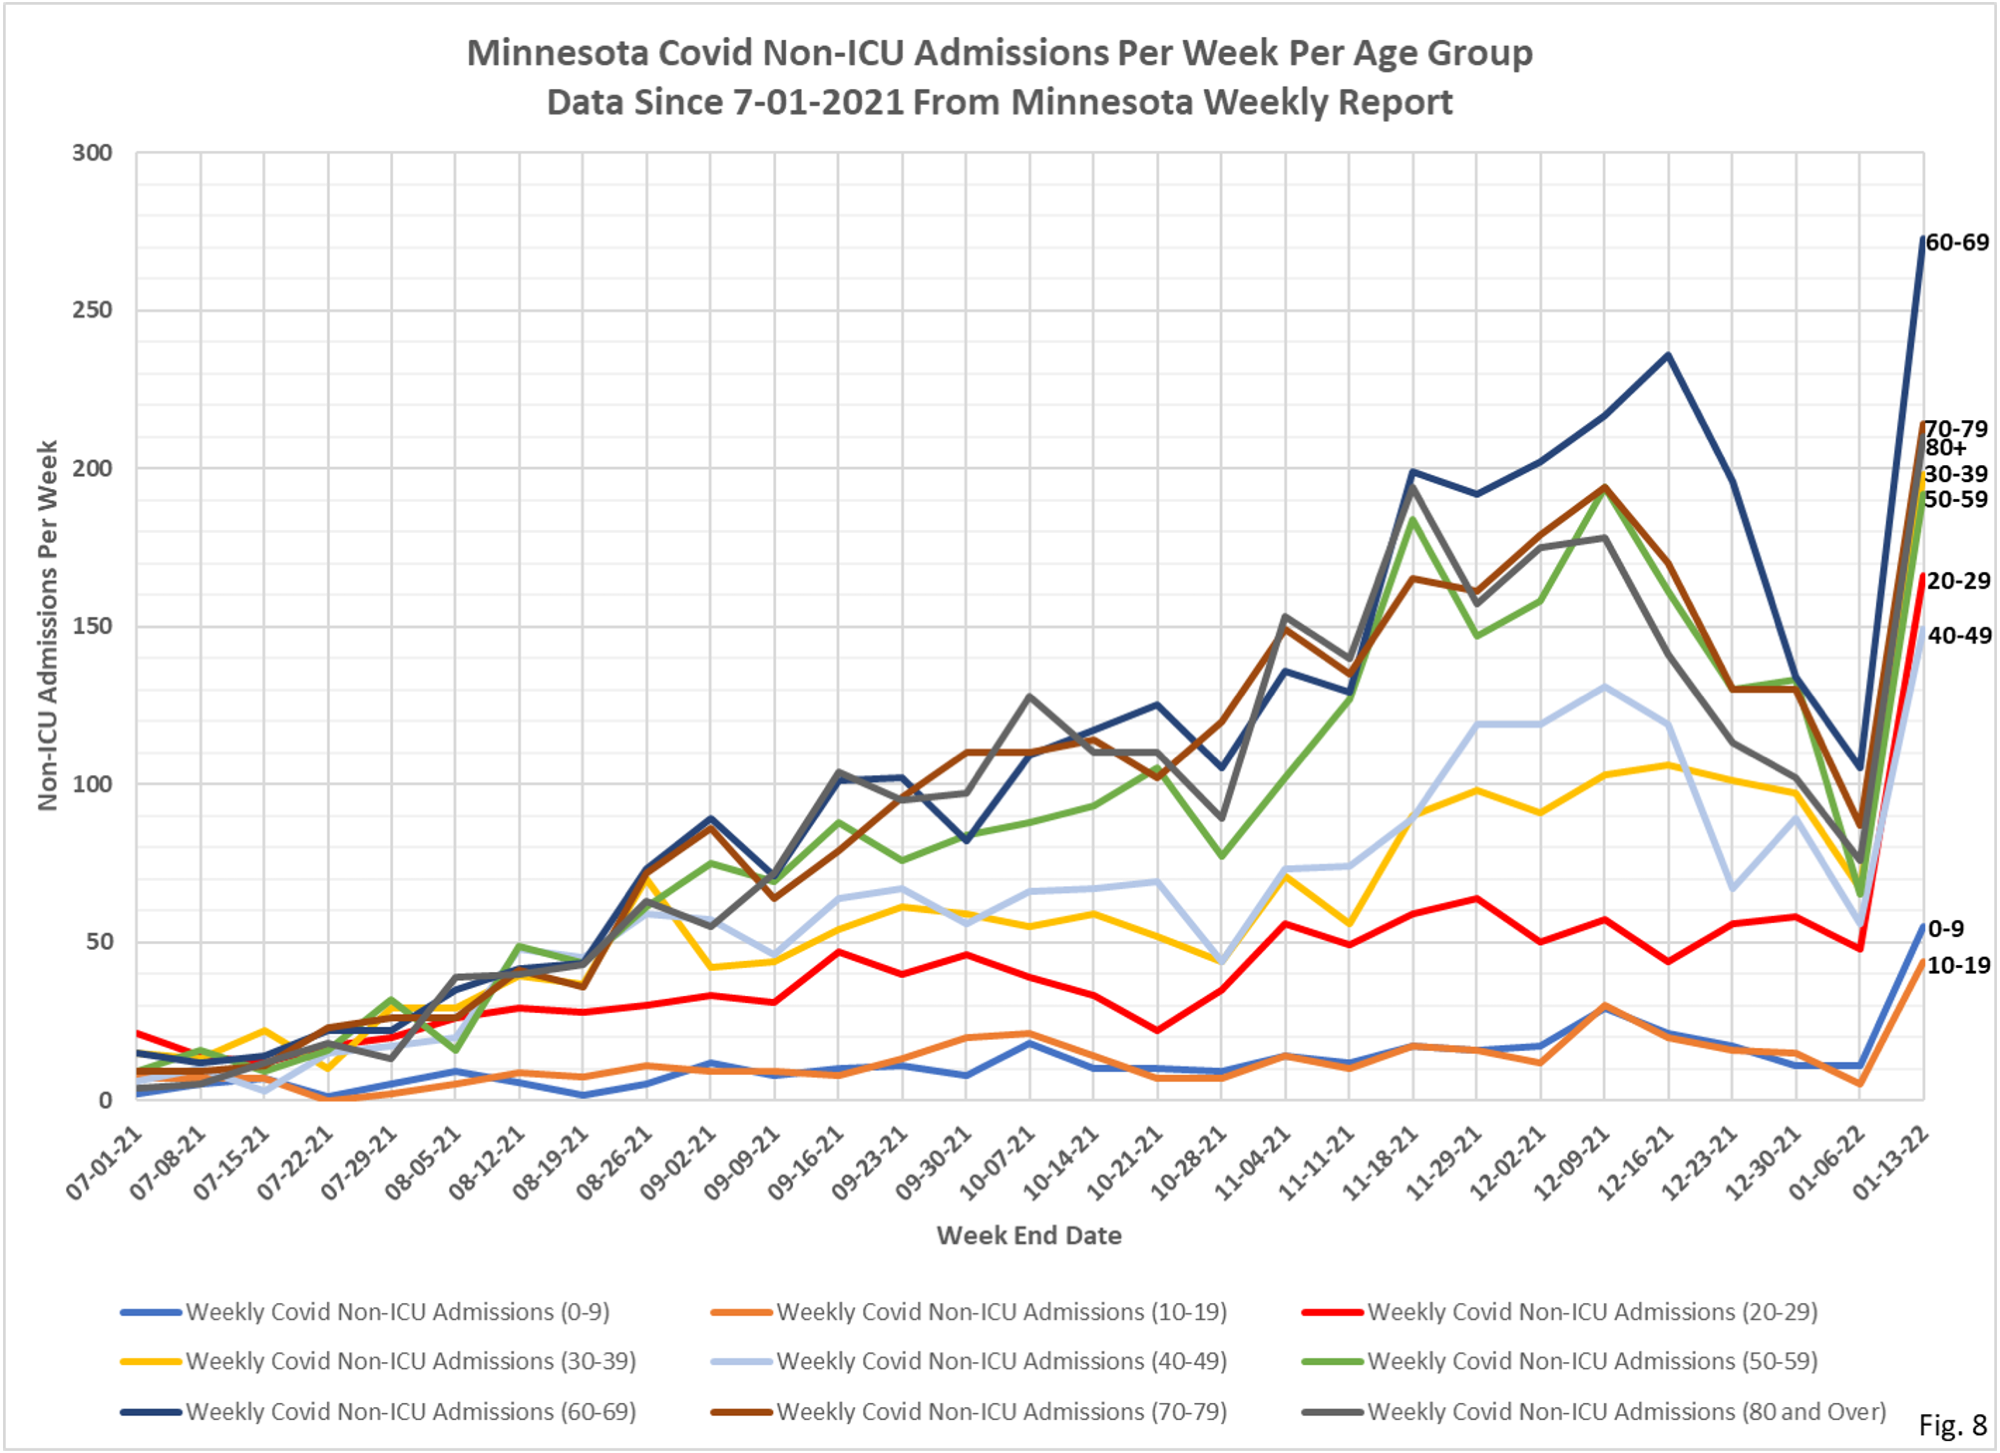
7. Fig. 7 and 8: Non-ICU Covid Admissions Per Week. Non-ICU Covid admissions were sharply higher in all age groups this week. Despite record numbers of cases overall admissions remain below the peak in admissions seen in late 2020. The younger age groups had a large increase in Non-ICU admissions, setting new one-week records for the pandemic. The 0-9 age group had 44 admissions, the 10-19 age group had 5 admissions, and the 20-29 age group had 166. Not disclosed is how many of these admissions were for complications related to Covid, and how many were incidental positive tests of non-Covid patients. As seen in hospital utilization charts, published most recently here: https://healthy-skeptic.com/2022/01/10/hospital-capacity-and-use-january-7/, whenever there is an increase in Covid patients there is a decrease in non-Covid patients. Without additional data from MDH it is impossible to know if the decrease in non-Covid patients is due to incidental positive tests, or due to deferred ‘elective’ procedures. Total Non-ICU Covid admissions for the week were 1501, nearly triple the 520 admissions the prior week. The only week in the entire pandemic with higher non-ICU admissions was the week ending 11/26/2020, which had 1580 non-ICU Covid admissions.
8. Fig. 9 and 10: Covid Deaths Per Week. Total reported Covid deaths for the week were 206, a slight decrease from 217 reported deaths the week before. The deaths per age group were in order of age, as seen throught most of the pandemic.