Hospital length of stay is kind of an important metric because it may tell you something about severity of disease and it may indicate issues about the efficiency of care or adequacy of resources. DOH could give the actual median and average length of stay for CV patients, including subgroups of true and incidental hospitalizations, but it won’t so you have to do your best to estimate. Dave Dixon has applied a couple of methods, shown in the charts below and described in the notes. It is pretty clear to me, as Dave says, that the current issue in length of stay has nothing to do with disease severity and everything to do with staff shortages caused by vaccine mandates which are making nursing home and other step-down beds unavailable and so people are just kept in the hospital.
Dave’s notes:
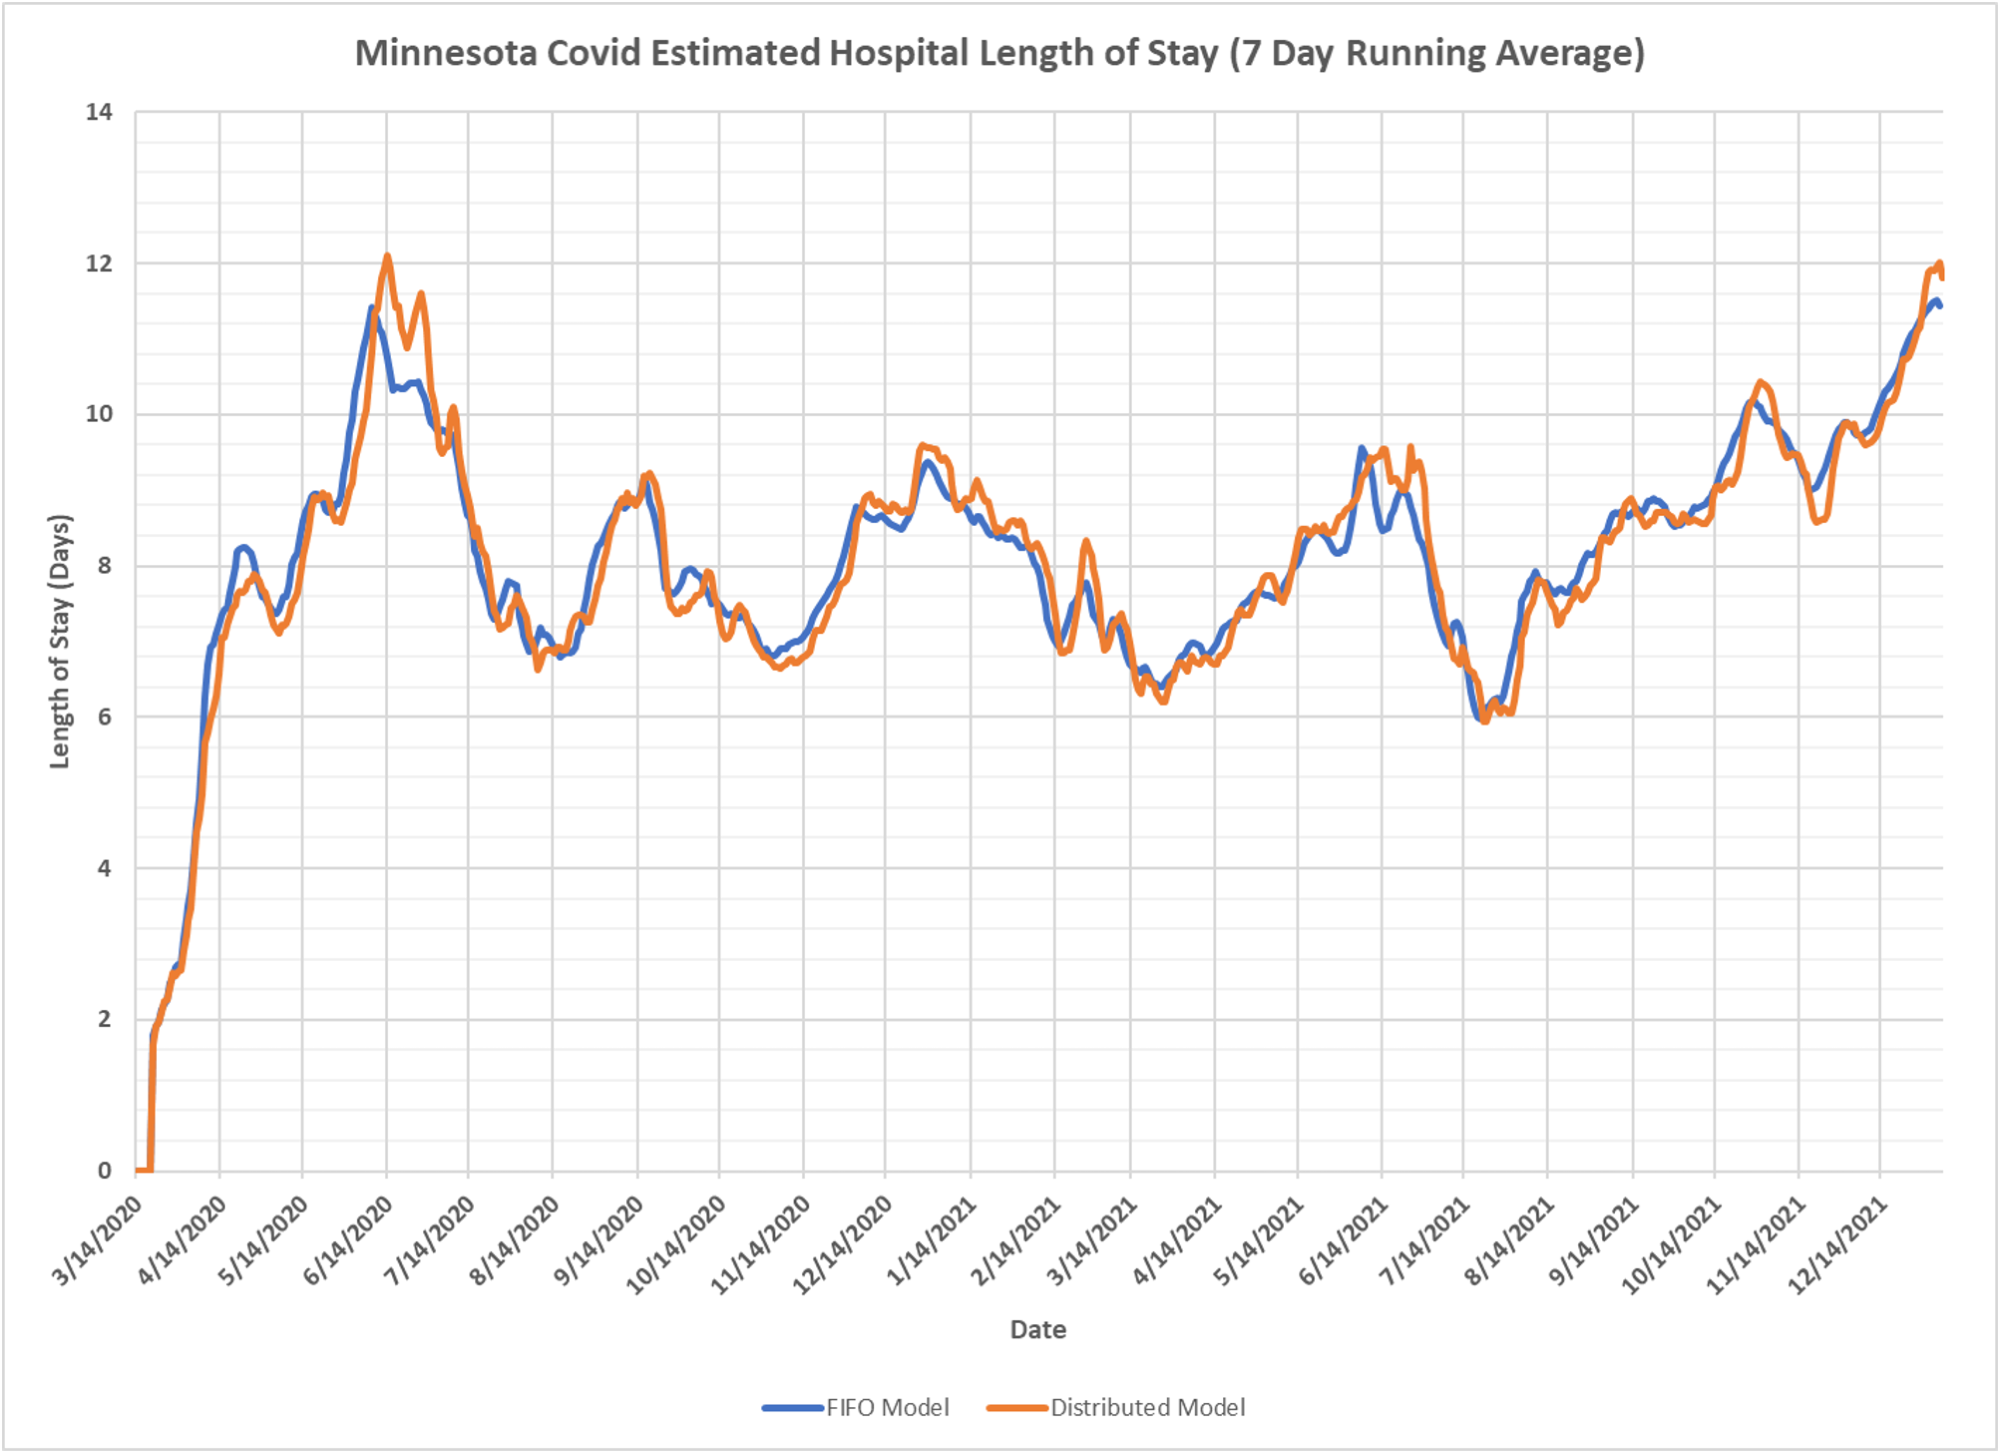
1. This chart is an update to the Minnesota Covid hospital length of stay analysis we published on 12/23/2021 here: https://healthy-skeptic.com/2021/12/23/hospital-length-of-stay/ This update extends the analysis range to 1/05/2022, and adds a second model using a distributed discharge of patients. In addition, the original First In First Out (FIFO) model has been updated using a new 7 day average calculation.
2. We have been curious about how hospital length stay has varied in Minnesota over the course of the pandemic. As explained below we have been suspicious that average length of stay might be longer now than at the peak of the late 2020 surge in cases. We recently filed a Data Practices Act request with the Minnesota Department of Health to try to get actual length of stay data, but it is unclear when, if ever, they will respond. Therefore, in the meantime, we have attempted to estimate length of stay using the data available to us.
3. MDH publishes daily Covid hospital admissions on the Situation Update web page, https://www.health.state.mn.us/diseases/coronavirus/situation.html . Although they break out ICU and Non-ICU admissions, for this analysis we are using total combined daily admissions.
MDH also publishes daily Covid hospital beds in use on the Response Capacity web page, https://mn.gov/covid19/data/response-prep/response-capacity.jsp. We are using the total of the ICU and Non-ICU beds in use for this analysis.
4. Using daily admissions and daily beds in use, we are able to calculate how many patients are released from the hospital each day, either recovered or deceased. The equation for each day’s discharges is: Today’s Covid Discharges = Today’s Covid admissions – (Today’s Covid beds in use – Yesterday’s Covid beds in use).
Using the daily admissions, we are able to construct a matrix of patients in the hospital each morning. Patients admitted that same day are in day 1 their stay. Patients remaining in the hospital from yesterday’s admissions are in day 2 of their stay, and so on.
5. The First In First Out (FIFO) Model assumes that the daily discharge of patients starts with those who have been in the hospital the longest. Patients who have been hospitalized for the most number of days are discharged first, and any discharges remain to be accounted for then the patients hospitalized for the second most number of days are discharged, and so on until all discharges are accounted for. This new matrix of patients remaining in the hospital after discharges are removed becomes the start of the next day’s matrix, with all remaining patients’ days of stay incremented one day higher.
6. The Distributed Model assumes that discharges occur evenly among all patients who have been in the hospital for 2 or more days. The algorithm starts by discharging one patient from the longest stay group, then one for the second longest stay group, and so on down to 2 days. If any discharges remain to be accounted for we start over with the longest stay group and repeat until all discharges are accounted for.
7. The 7 day running length of stay, for both the FIFO Model and Distributed Model, is calculated as the sum of the days of stay times the total number of patients discharged each day over a 7 day period, divided by the discharges over the same 7 day period. This is different from the 12/23/2021 calculation where we simply averaged the daily average length of stay for a 7 day period.
8. It is encouraging that there is relatively little difference between the two models. It suggests that the discharge assumptions do not materially affected the Length of Stay analysis. The differences between the two models appear to be caused by a lagging effect when there are large charges in the number hospital beds in use each day, either increasing or decreasing.
9. The original topic which spurred us to look at length of stay was a comparison of the peak daily admissions in Dec. 2021 and in Dec. 2020, and hospital beds in use in Dec. 2021 and in Dec. 2020. From the Year to Year Comparison charts we frequently publish, most recently here https://healthy-skeptic.com/2022/01/10/year-over-year-comparison-january-7/ we can see that daily admissions in Dec. 2021 are about 186, 68.6% of the Dec. 2020 peak admissions of 271. However, peak daily Covid beds in use in Dec. 2021 are about 1653, 91.3% of the Dec. 2020 peak of 1811. One explanation for why beds in use are comparatively higher in 2021 is that length of stay must be longer in 2021 than in 2020. With this new analysis we can see that the calculated length of stay using both models is currently equal to the longest we have seen throughout the entire pandemic. It is speculated that a lack of available Long Term Care beds is contributing to the longer hospital length of stay.

Kevin, I saw an article ( https://www.americanthinker.com/articles/2022/01/a_pandemic_of_testing.html ) that mentioned the average length of time before testing positive while in the hospital was 8 days (from time of admission). The chart here shows an average of about 8 days length of stay. @covid_clarity mentioned “Section 3710 of the CARES ACT provides a 20% ‘add-on payment’ for patients discharged from the hospital with a COVID-19 diagnosis.” It would be interesting to know why those patients were there initially and if they were admitted but were negative or what percentage of those admitted were negative versus positive and comparative length of stay for each.
It’s interesting to see the length of stay in MN. I saw a thing on TV last night (FoxNews) about the average Omicron stay in some of the “overburdened” states is like two days. Of course, that could be a result of staff shortages, too, I suppose
Nice work!
Now I would like to see an overlay of cases.
It appears injections did not do much to reduce stays or prevention. Oh, masks did a lot of good. ;(
The chart ends just about the time bad boy Delta is peaking and good guy Omicron started its run displacing it.
Isn’t 95% or more of current cases, Omicron?
Reports I’ve seen indicate hospital stay for Omicron is around 3 days, often 2 days. Almost none in ICU. I think I saw a report that nearly 40% of those who show up, are not admitted. It’s not in the lungs; breathing is good, pneumonia it’s not.
That implies the graph ought to make a waterfall decline as Omicron replaces Delta.