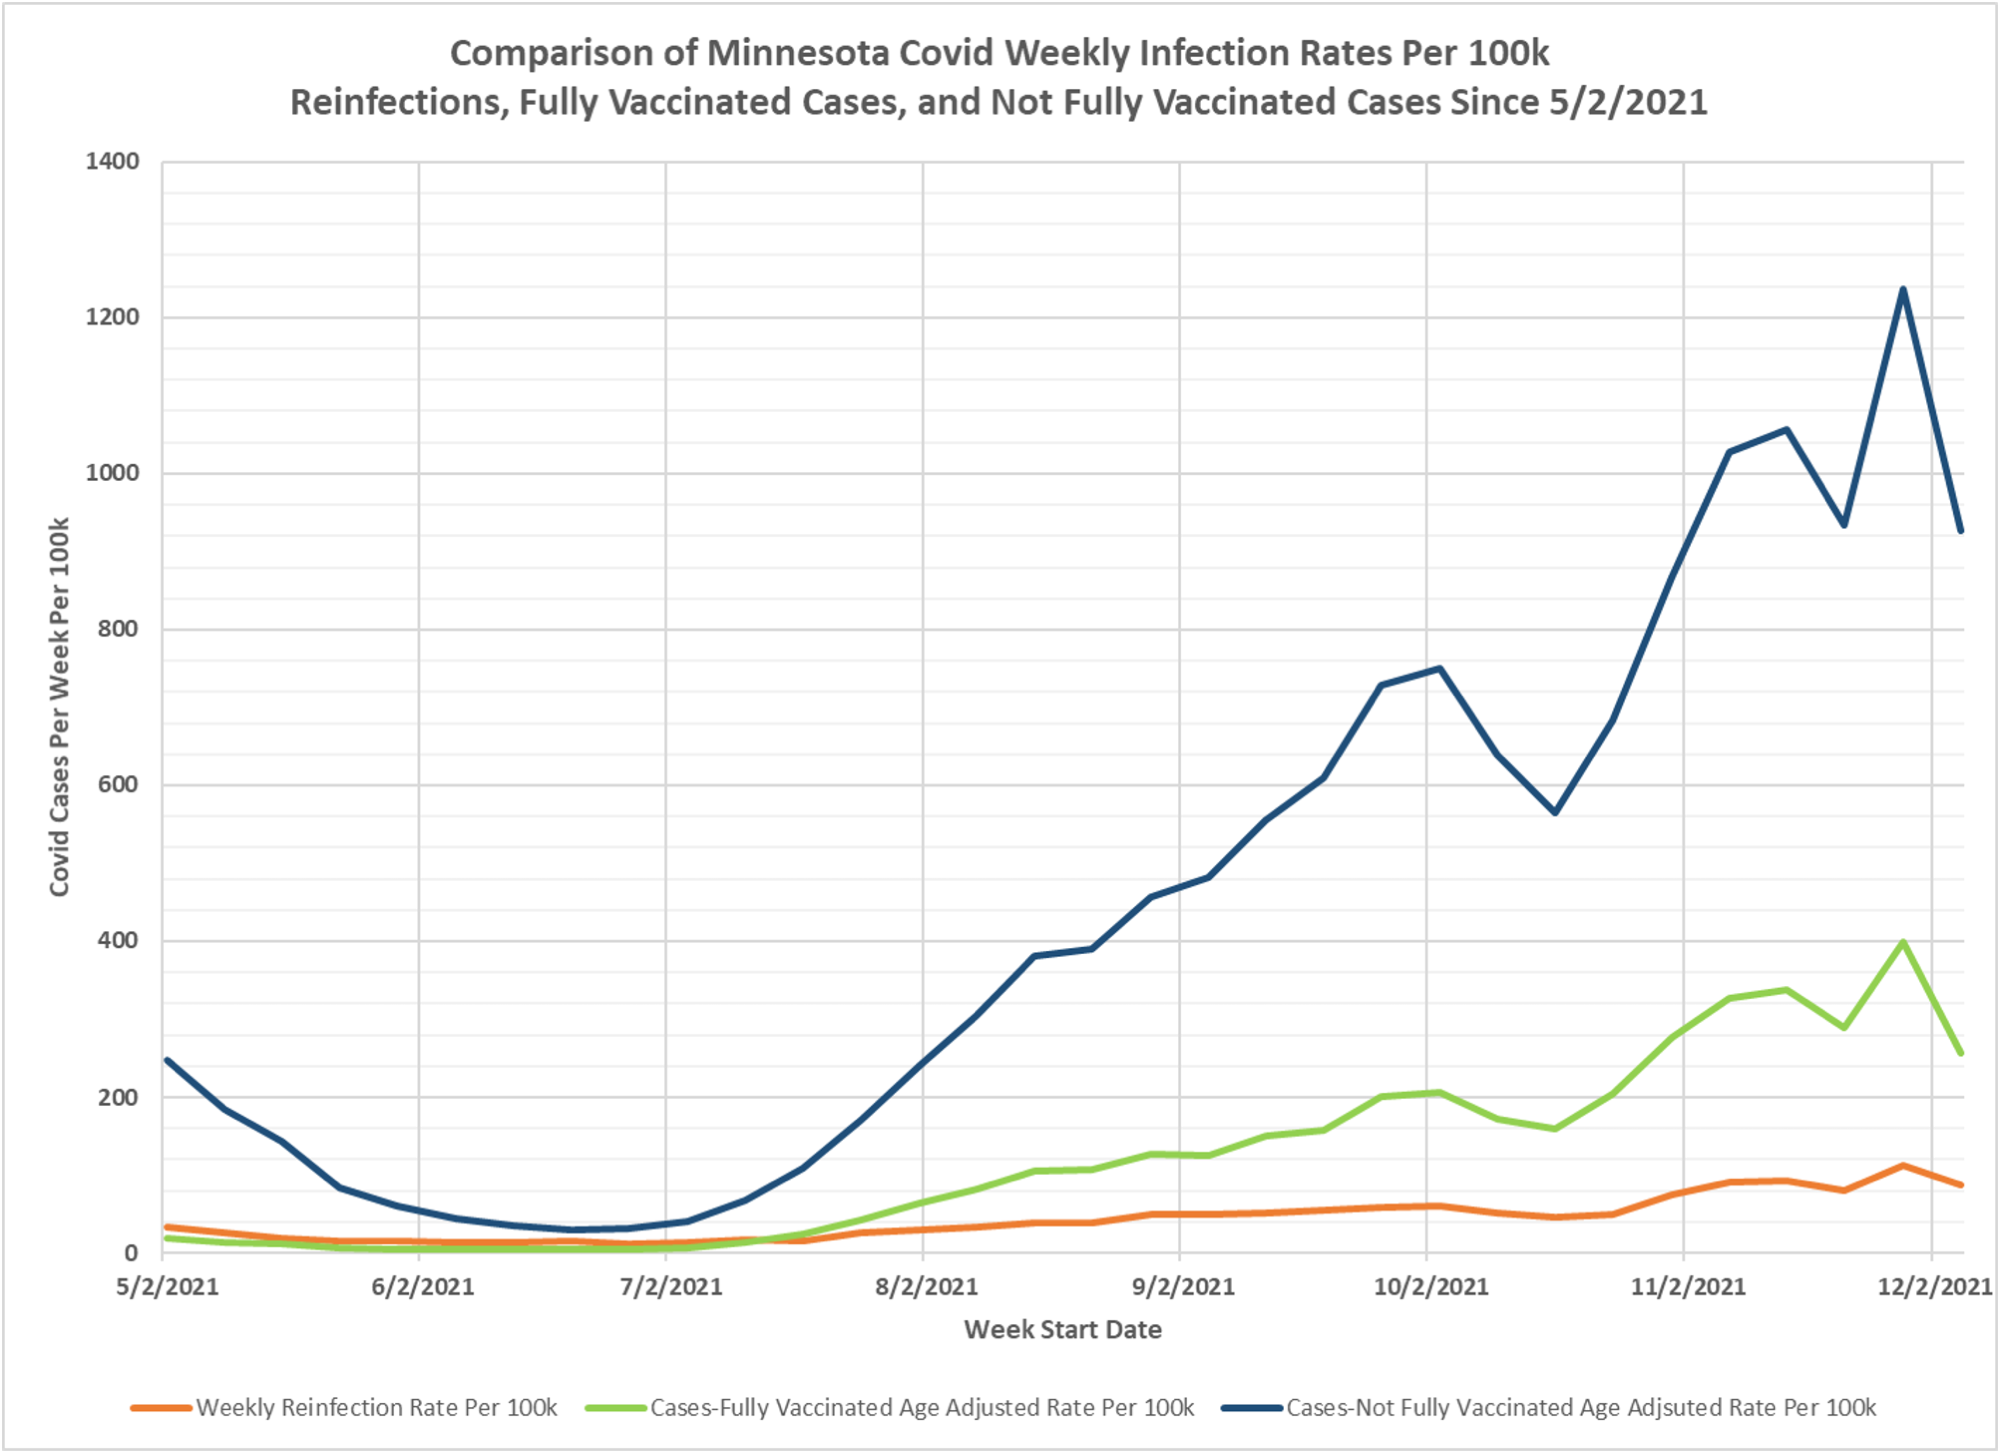
Another weekly update by Dave Dixon of the charts on the relative rates of cases in the vaxed, unvaxed, and previously infected. Please note as usual that the source DOH data has issues that the agency won’t fix, among which is the overlap between prior infection and vaccination. But you can see that notwithstanding the emergence of Omicron, both vax and prior infection appear to limit infection risk. Dave’s notes:
1. Since 11/2/2021 MDH has published Covid reinfection data on the Minnesota Situation Update for COVID-19 web page: https://www.health.state.mn.us/diseases/coronavirus/situation.html Reinfections are defined as a person testing positive for Covid more than 90 days after a prior positive test.
“Confirmed” reinfections are defined as a positive PCR test following a positive antigen test. Probable is defined as a negative PCR test following a positive antigen test. It is implied, similar to Cases, that a PCR positive test is considered “Confirmed” and a positive antigen test is considered “Probable”. For purposes of this analysis all Confirmed and Probable reinfections will be included.
2. The weekly Covid reinfection rate displayed on the chart is calculated as the number of weekly reinfections (confirmed and probable) divided by the cumulative Total Positive Cases 90 days prior to the start of the week being considered, and the result multiplied by 100k to yield the reinfection rate per 100k per week. This is the red curve on the chart.
3. The Fully Vaccinated Age Adjusted Case Rate Per Week (green curve) and Not Fully Vaccinated Age Adjusted Case Rate Per 100k (blue curve) are taken directly without modification from the Vaccine Breakthrough Report https://www.health.state.mn.us/diseases/coronavirus/stats/vbt.html from the data file for Cases, Hospitalizations, and Deaths Over Time graphic (vbtaarates.xlsx linked on this page).
4. Data is plotted starting 5/2/2021, the earliest date we have breakthrough data. Reinfection data goes back to 6/28/2020, but the earlier data is more variable possibly due to the smaller population of previously infected people.
5. We have no knowledge of what age adjustments DOH performs in order to calculate the Age Adjusted Rates, and we have not yet submitted a formal query to MDH for this information.
6. It is likely that there are people who may have contracted a mild enough Covid infection that they did not seek medical attention or get tested, causing an undercount of the true number of breakthrough infections, non-breakthrough infections, and reinfections. We do not know how thorough and comprehensive MDH’s process is in identifying reinfections or breakthrough infections.
7. The main purpose in generating this chart is to try to compare the relative infection rates for previously infected people to vaccinated people, and then to unvaccinated people. We can see that throughout the Summer of 2021 the three rates were all low, during the time period in Minnesota when Covid cases were very low in general. However, unvaccinated infection rates were always the highest of the three, and for several months the reinfection rate was higher than the vaccinated breakthrough rate. For the week starting 12/05/2021, the most recent date where we can be considered to have complete breakthrough case data, the reinfection rate was 86.6 per 100k, the vaccinated infection rate was 257.1 per 100k, and the unvaccinated infection rate was 927.3 per 100k. From these rates we might say that the vaccinated are 3.0 times more likely to test positive than someone who previously recovered, and the unvaccinated are 3.6 times more likely to be infected than the vaccinated.

given that 50-70% of all Covid infections are asymptomatic … once a person is vaccinated they simply won’t get tested if they don’t feel sick … stating that vaccination prevents infection at any level is simply un-verifiable in the data you have (positive tests) … you have no control group and no data that PROVES the vaccinated are not getting infected … your data shows they aren’t getting sick enough to get tested (which is not a bad thing) … but in no way shows the vaccine reduces community spread …
the “vaccine” is at best a therapeutic treatment …
the exact same rasoning applies to the vaxed and unvaxed
It’s interesting that even in the relatively small dataset from MN, you can see the dual effects of a mismatched vaccine (i.e. a wt vaccine when delta is spreading) and fading antibody levels. For the first 6-7 months after the vaccine became available it was clear that being vaccinated provided superior protection to being recovered. Then came delta and that switched. Now we have omicron and a booster is needed to provide good protection. It’s time for the FDA to get serious about providing clear guidance about what will constitute sufficient difference to require a variant-specific vaccine. Otherwise, by the time one is available, it will be too late.
It is so hard to tell with the data sheets from the State, but I think prior infection provided at least as good, if not better protection at all points, doing the correct age adjustment and considering time from event–date of prior infection, or date of vax.
It seems logical to assume the NIH has given guidance and instruction to the states on how to present public statistical Covid information. Specifically, Breakthrough and age adjusted data. Most states that present breakthrough data do it in a similar fashion. There was a live informative webinar put on by NIH for state heath departments shortly before states began posting breakthrough data. NIH Age-Adjustment definition is vague https://www.nlm.nih.gov/nichsr/stats_tutorial/section2/mod5_age.html.
It would not be unreasonable to assume that useful breakthrough data is being actively suppressed. Overall vague breakthrough data correlates with the CDC no longer posting general breakthrough case numbers starting in May (at the start of the Delta wave). As Kevin has eluded to, without the complete metric for Age-Adjustment, the data may have little meaning. Simply put, data suppression erodes public trust. Pure speculation, but I suspect DOH personal have been told and feel they are suppressing data for the “greater good”. DOH is assuming the greater public lack intelligence to make what the DOH have deemed the correct decisions otherwise. Freedom and democracy at its finest.
From a spread perspective, perhaps vaccines help to a degree, but not a degree that matters.
Ireland has over 90% of the population vaccinated and yet currently has triple the amount of cases than the peak they had prior to vaccination.
So the more important part regarding spread is:
If no one is vaxed, everyone is going to get it, and if EVERYONE is vaxed, everyone is still going to get it.
It’s purely academic to argue it reduces spread.
You made the same point on Power Line, where maybe the vaccine prevents you from getting it with an encounter today, but you will still get it tomorrow or the next day.