You may recall that a couple of days ago I wrote a post about a Strib article on hosps in children. While I respect the writer, the overall tone of the story was inflammatory and fear-provoking and the content was misleading. The truth is that hosps in healthy children for actual CV-19 treatment are basically non-existent. Dave Dixon prepared some more detailed charts (at the end of this post, with Dave’s notes) on the under 20 age group and here is what I wrote to the reporter in regard to the story and the truth in Minnesota:
“Look at the attached chart, which takes the under 20 groups exactly as reported by DOH in the weekly report. This weekly report started in late summer of 2020 so it goes all the way back to that time. Now for reasons known only to DOH in their infinite wisdom although they clearly have date of event data and that is what is used in the daily situation report tables, for the weekly report they use date of report. Maybe you understand that. In any event, the median lag to hosp. report from case is about 5 days and to death is around 12 days, so over long stretches the reported data gives you the trend.
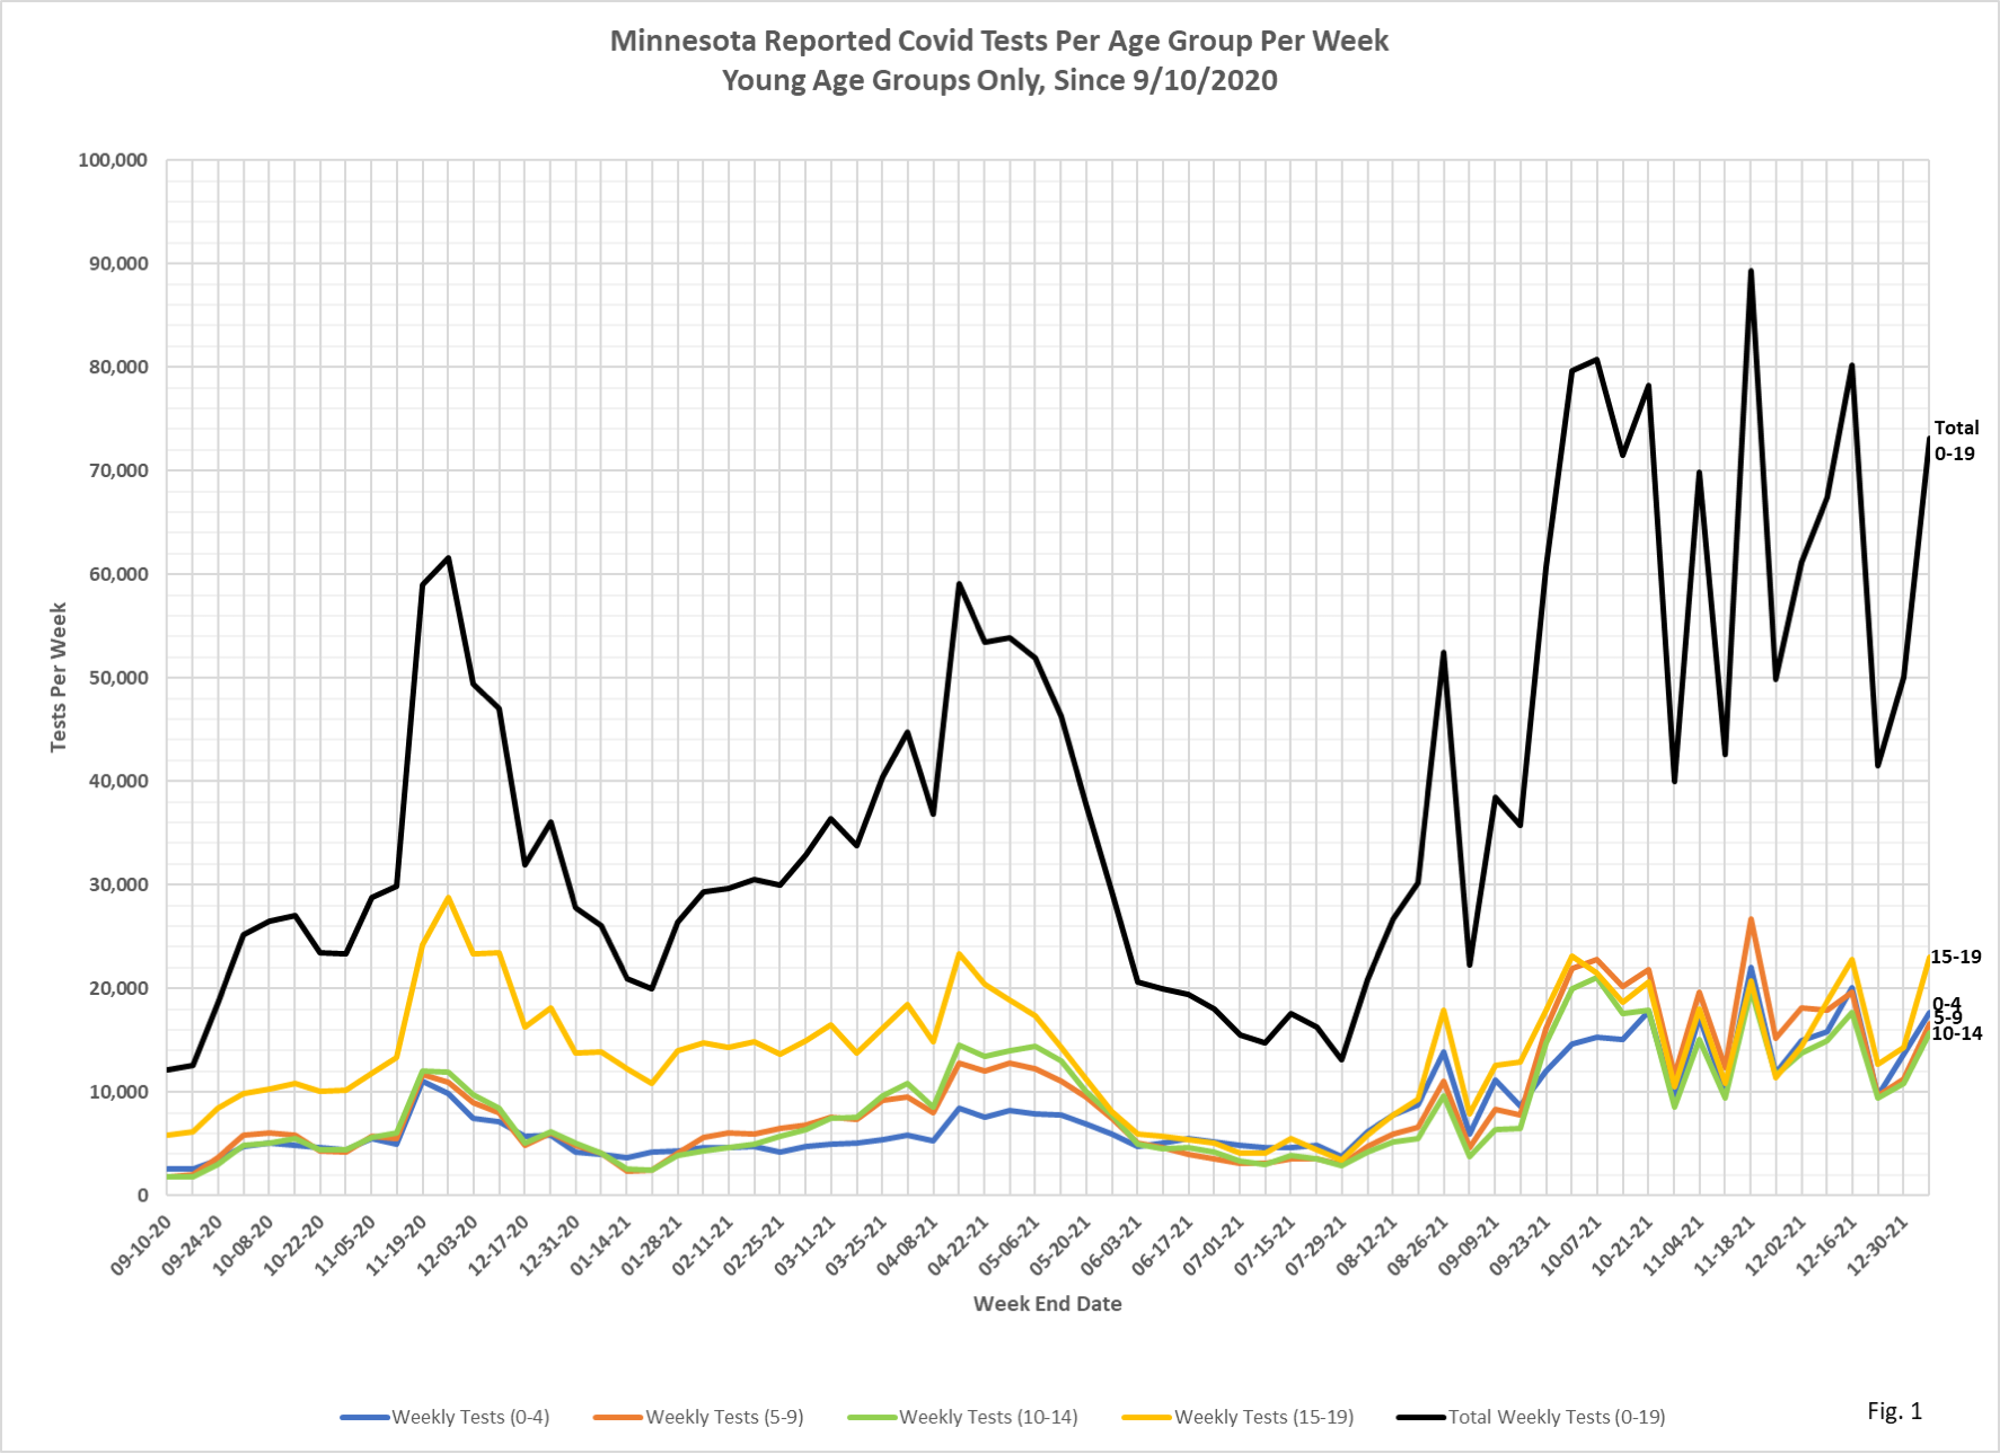
So if you look at these five year age groups, a number of things should immediately stand out. If you look at testing this fall, there was a large jump from any previous wave, related to school testing, this jump predated Omicron. It is fairly evenly spread across all subgroups, with somewhat greater concentration in the 15 to 19 year olds. And you see how arbitrary the school testing is, by the massive dips at holidays.
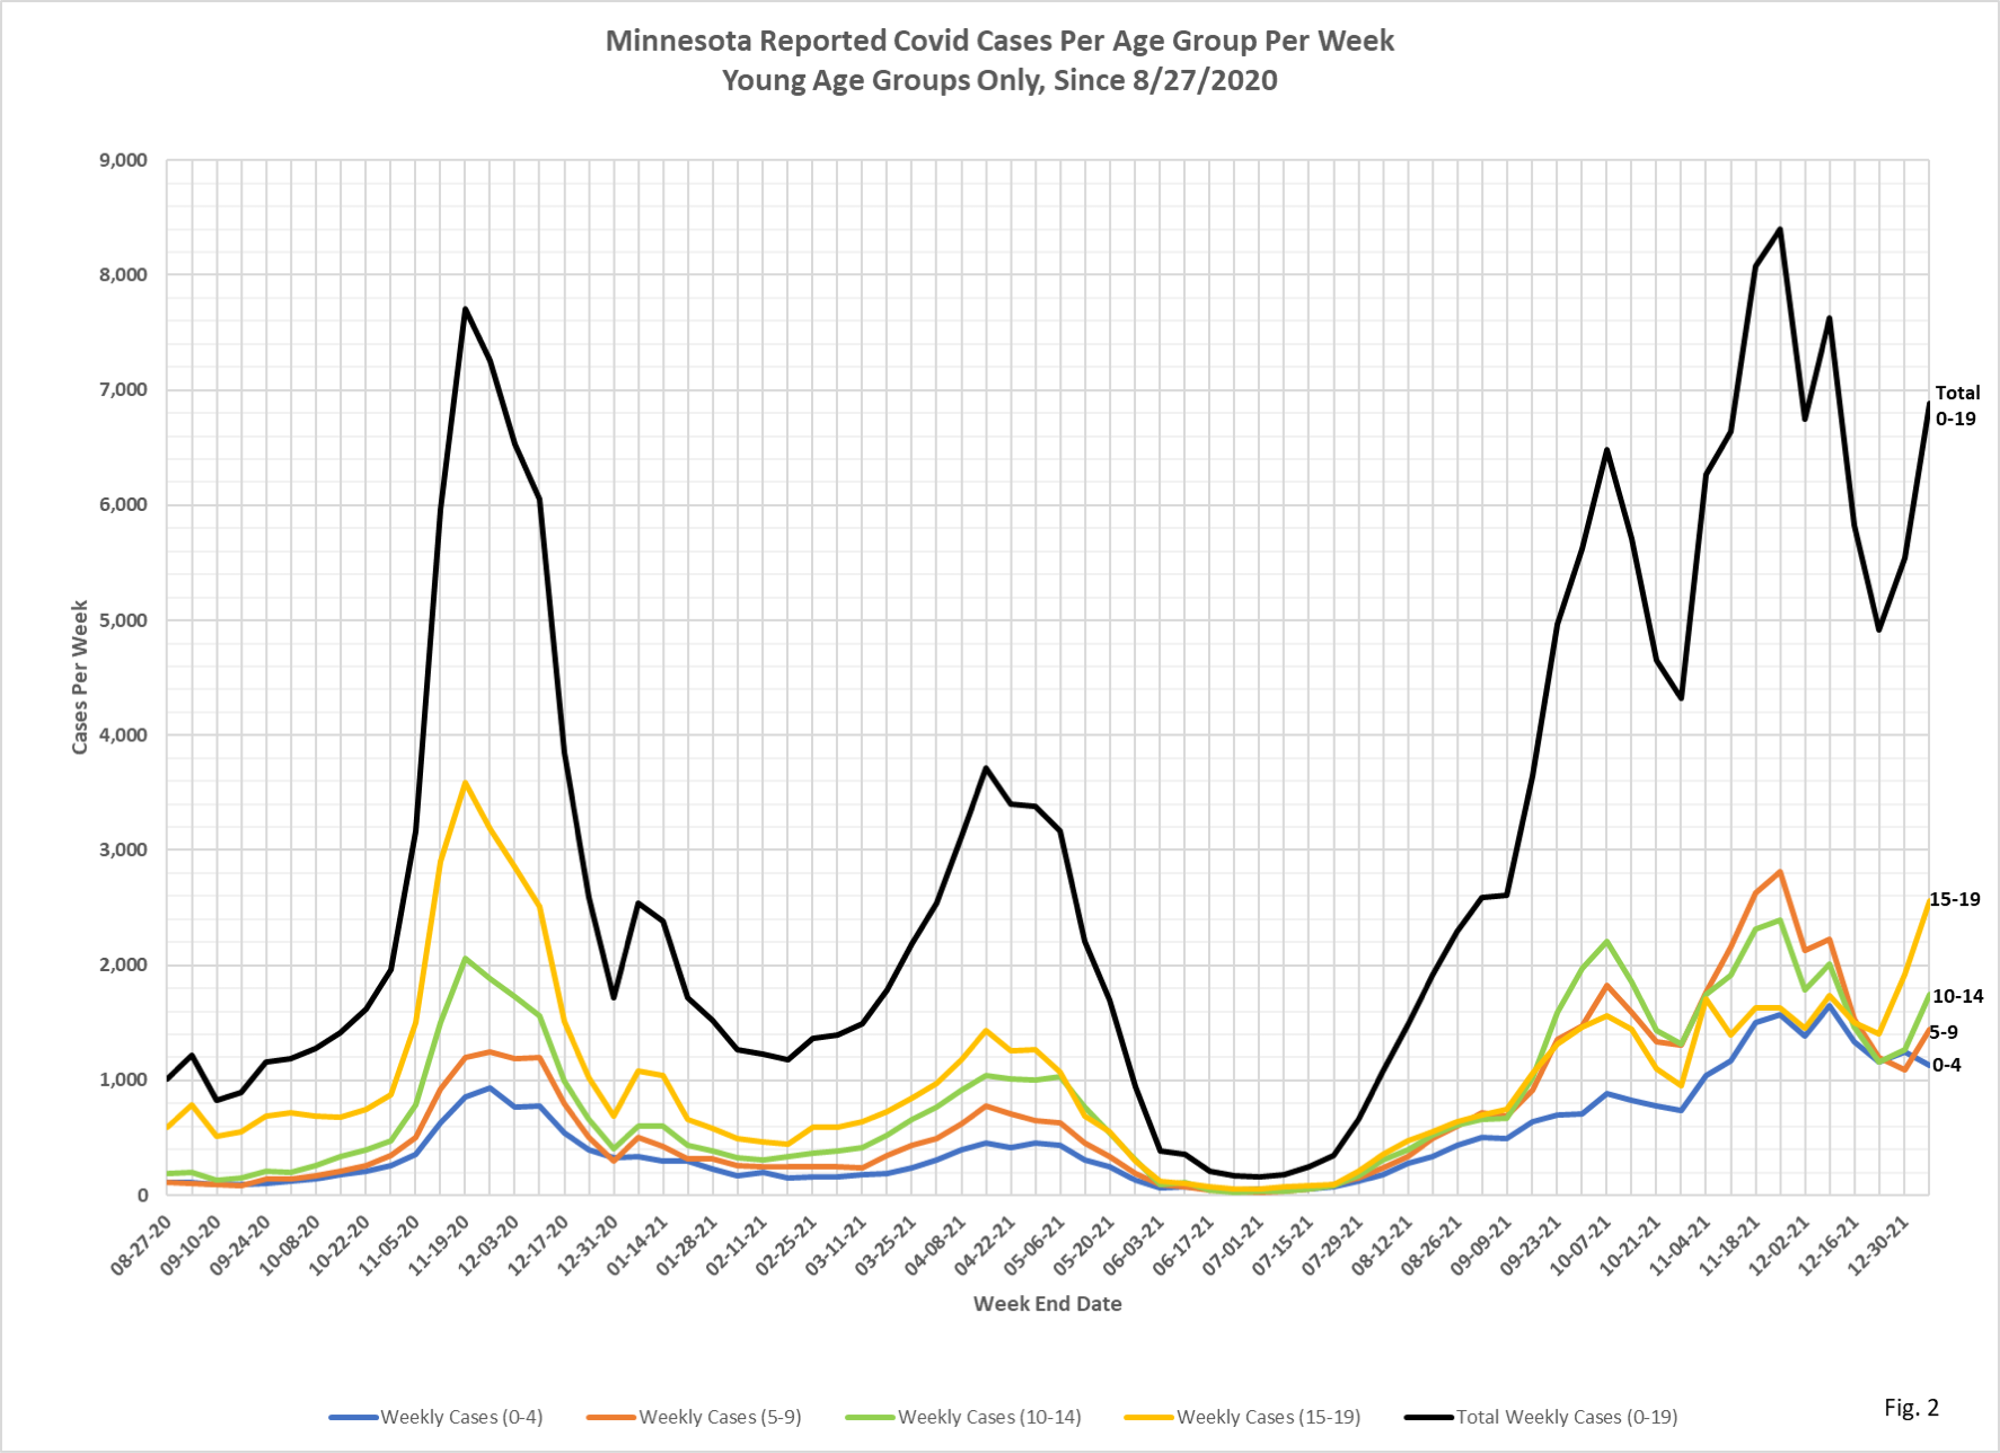
Now look at cases, and you do indeed see a rise over the fall, which completely tracks testing. You can argue which comes first, but I think the fall at holidays when young people are just as interactive and likely not in as mitigated an environment as school, tells you it is testing driving case identification. Now Fauci, Walensky, et al are telling us school is the safest place for children, a statement supported by research in regard to household transmission.
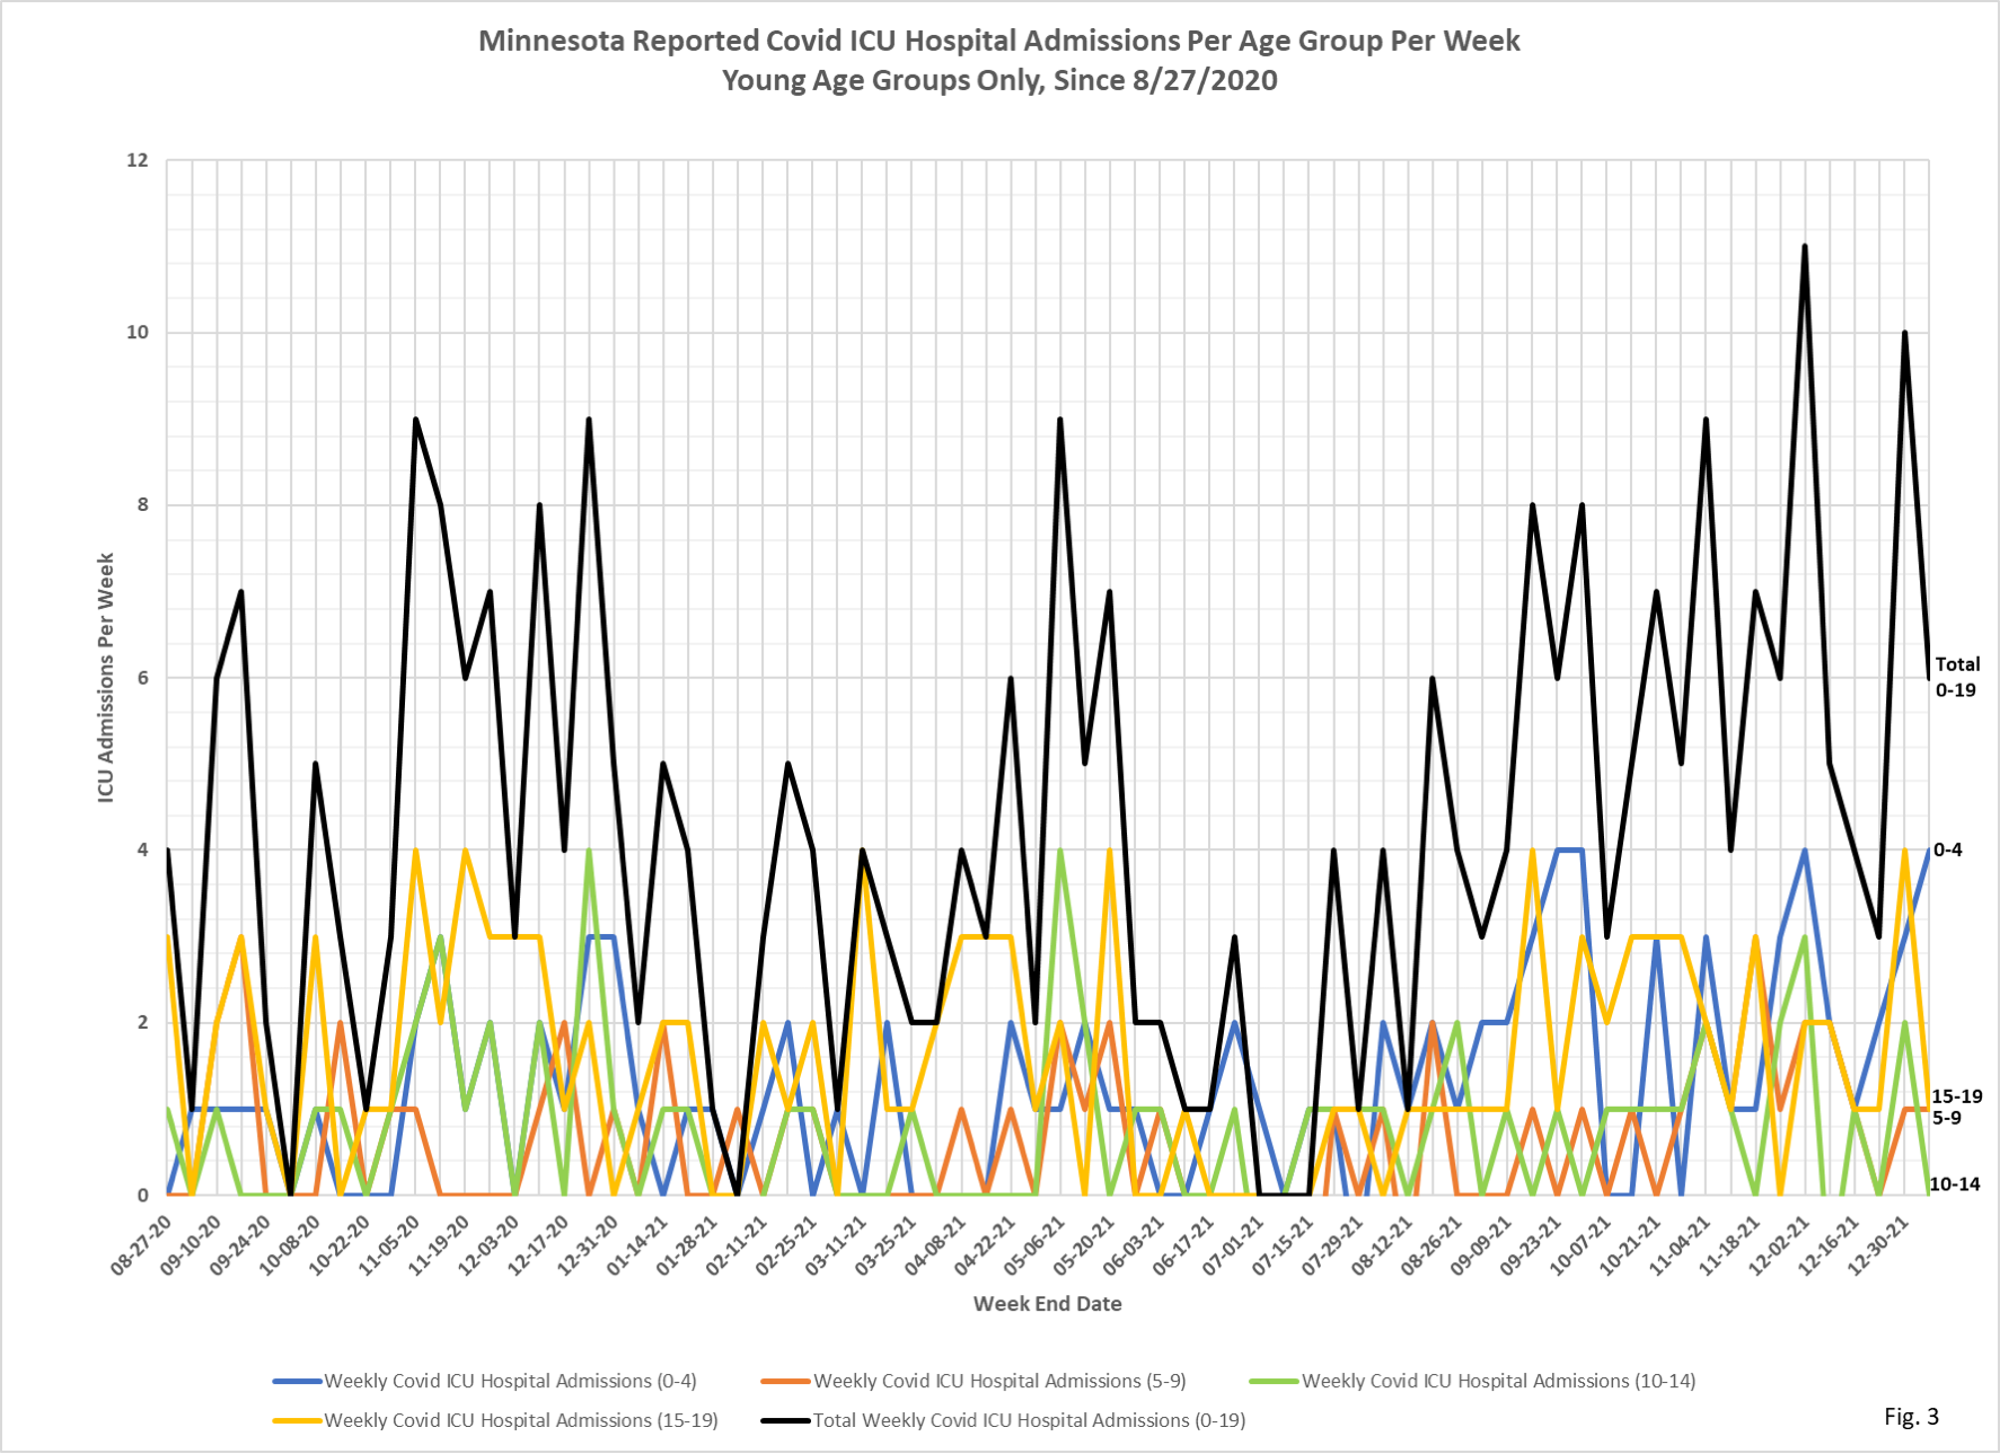
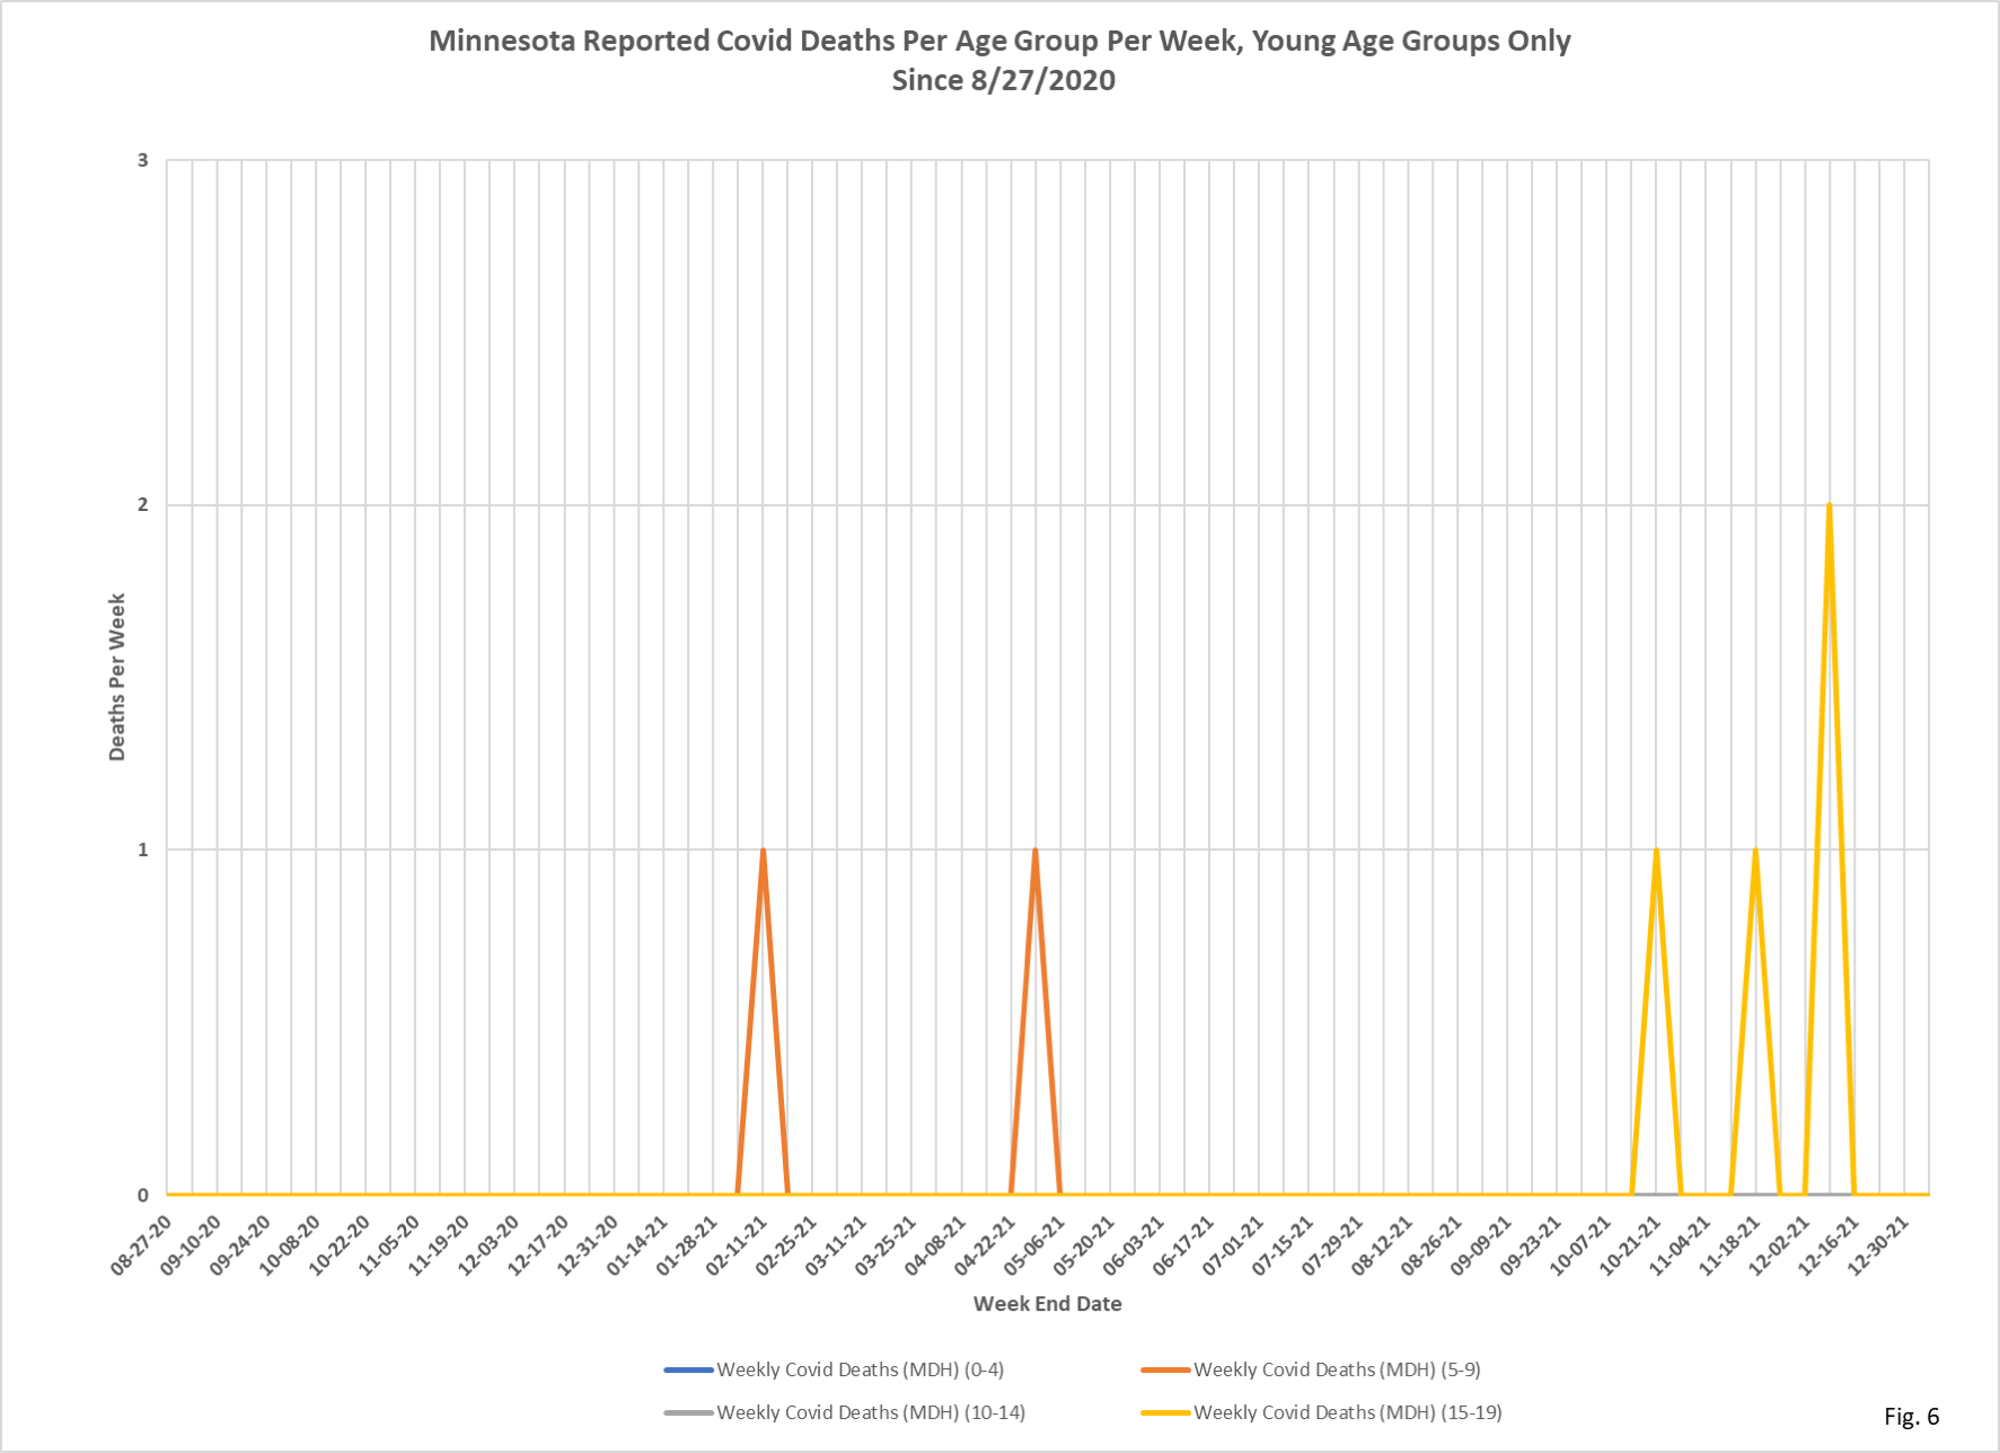
Now we get to hospitalizations, which as you know have an obvious flaw that was not, I believe, dealt with at all in your story. But just look at the numbers. The ICU numbers are extremely small, and if you remember your basic statistics, when you are dealing with very small numbers, any change is likely to be random. But let us say that in the total there is a tracking increase corresponding to the case increase in the fall. But it clearly preceded Omicron. And look at the subgroups, you see very clearly the random nature of changes within those subgroups. Look back to the time of the first weekly report, and you see that the subgroups are not hitting any higher peaks than they have at several other times in the epidemic.
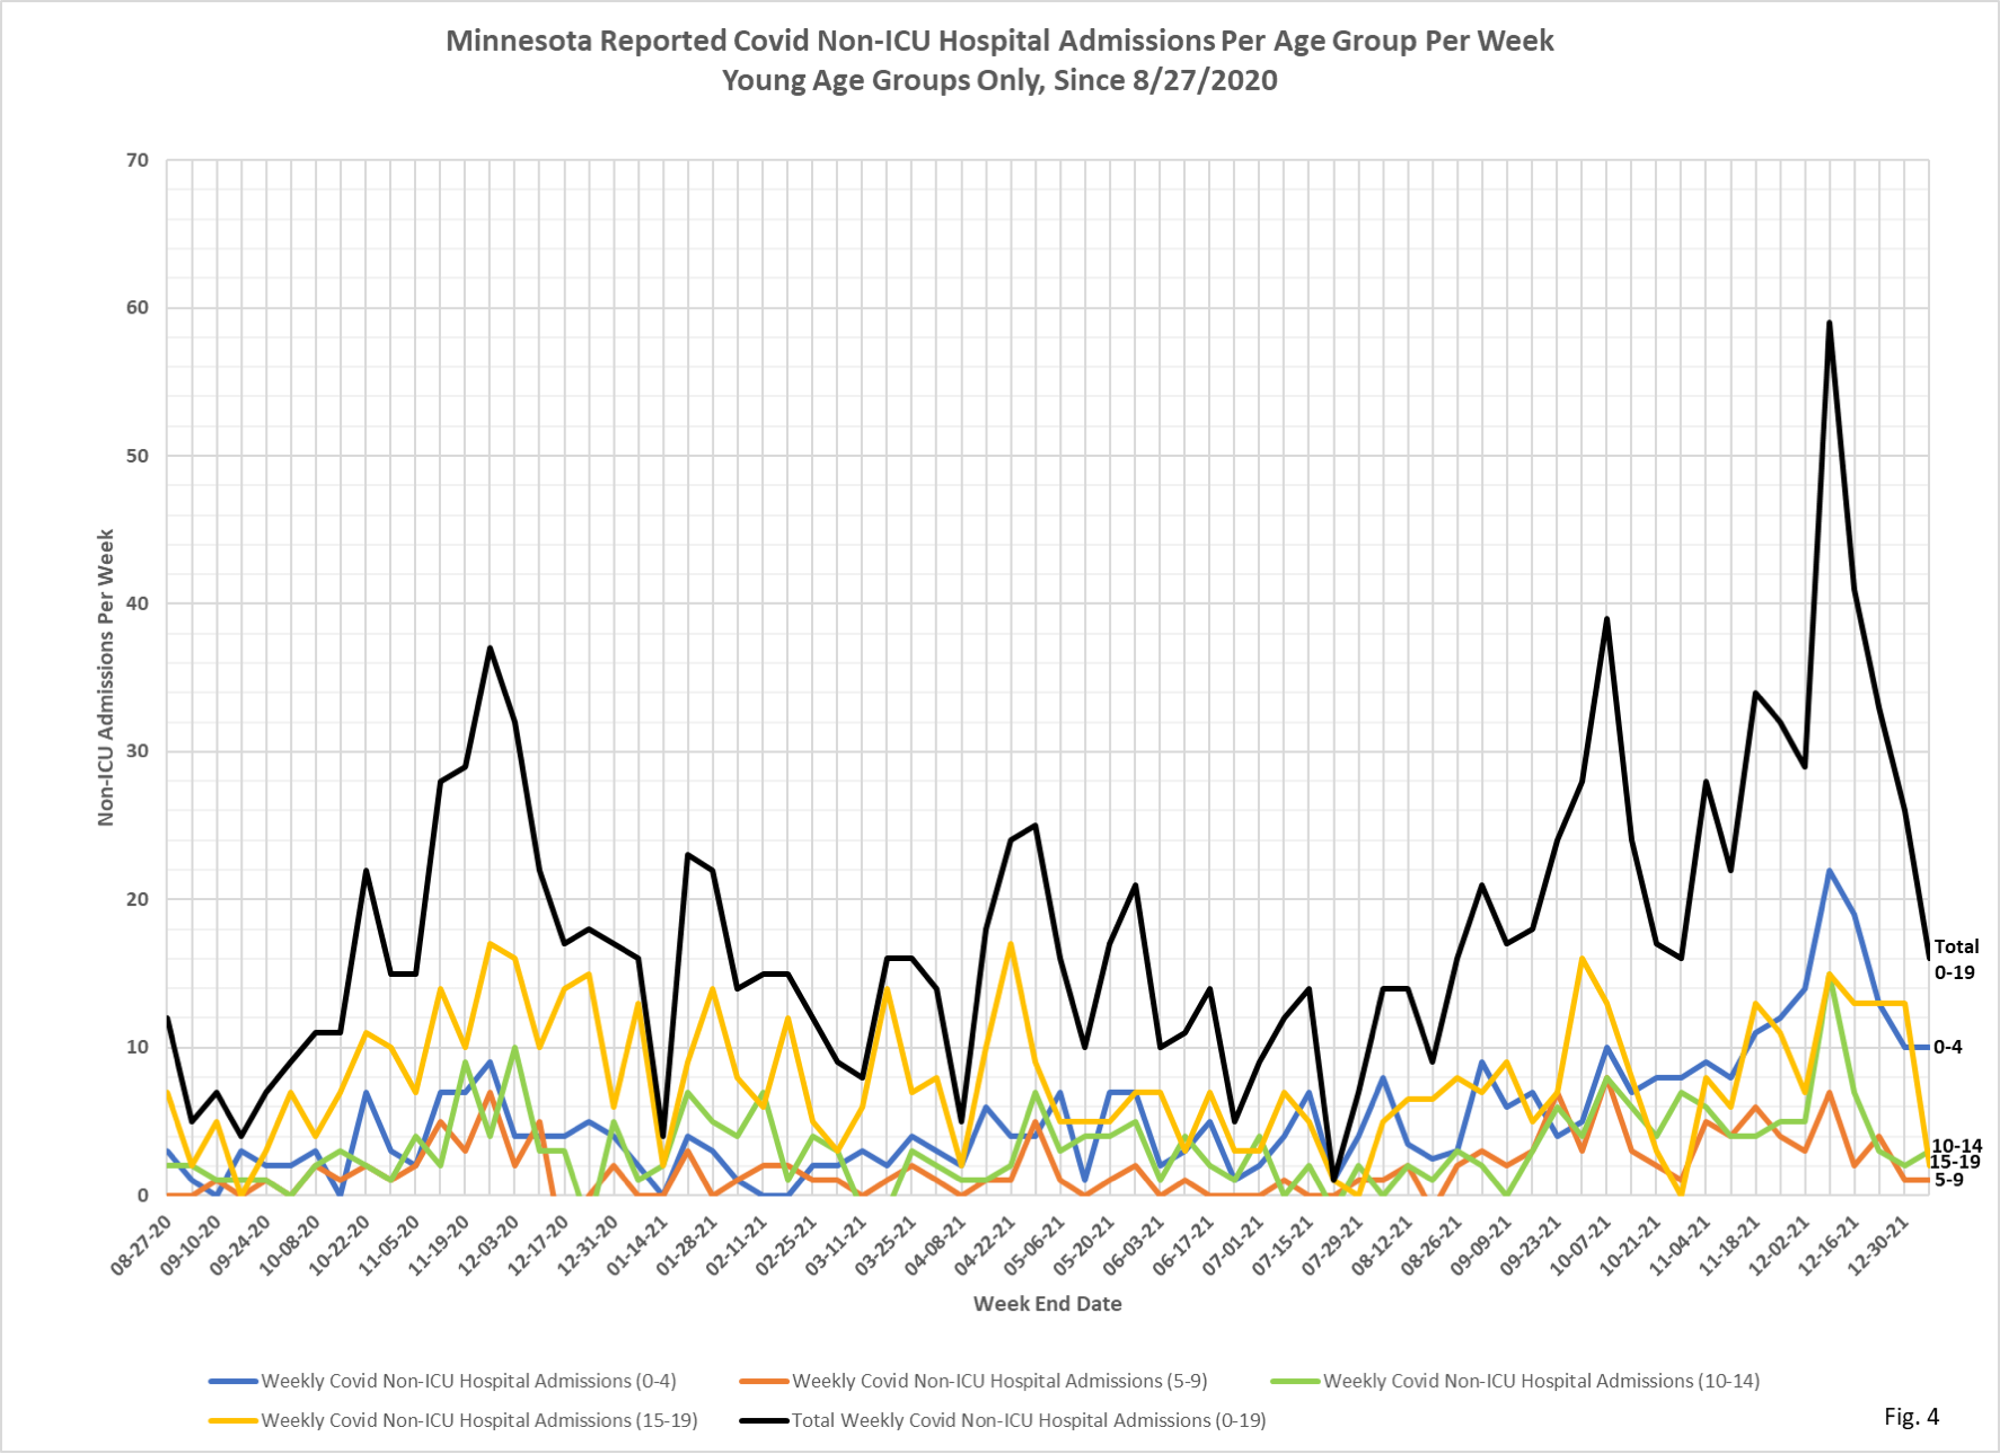
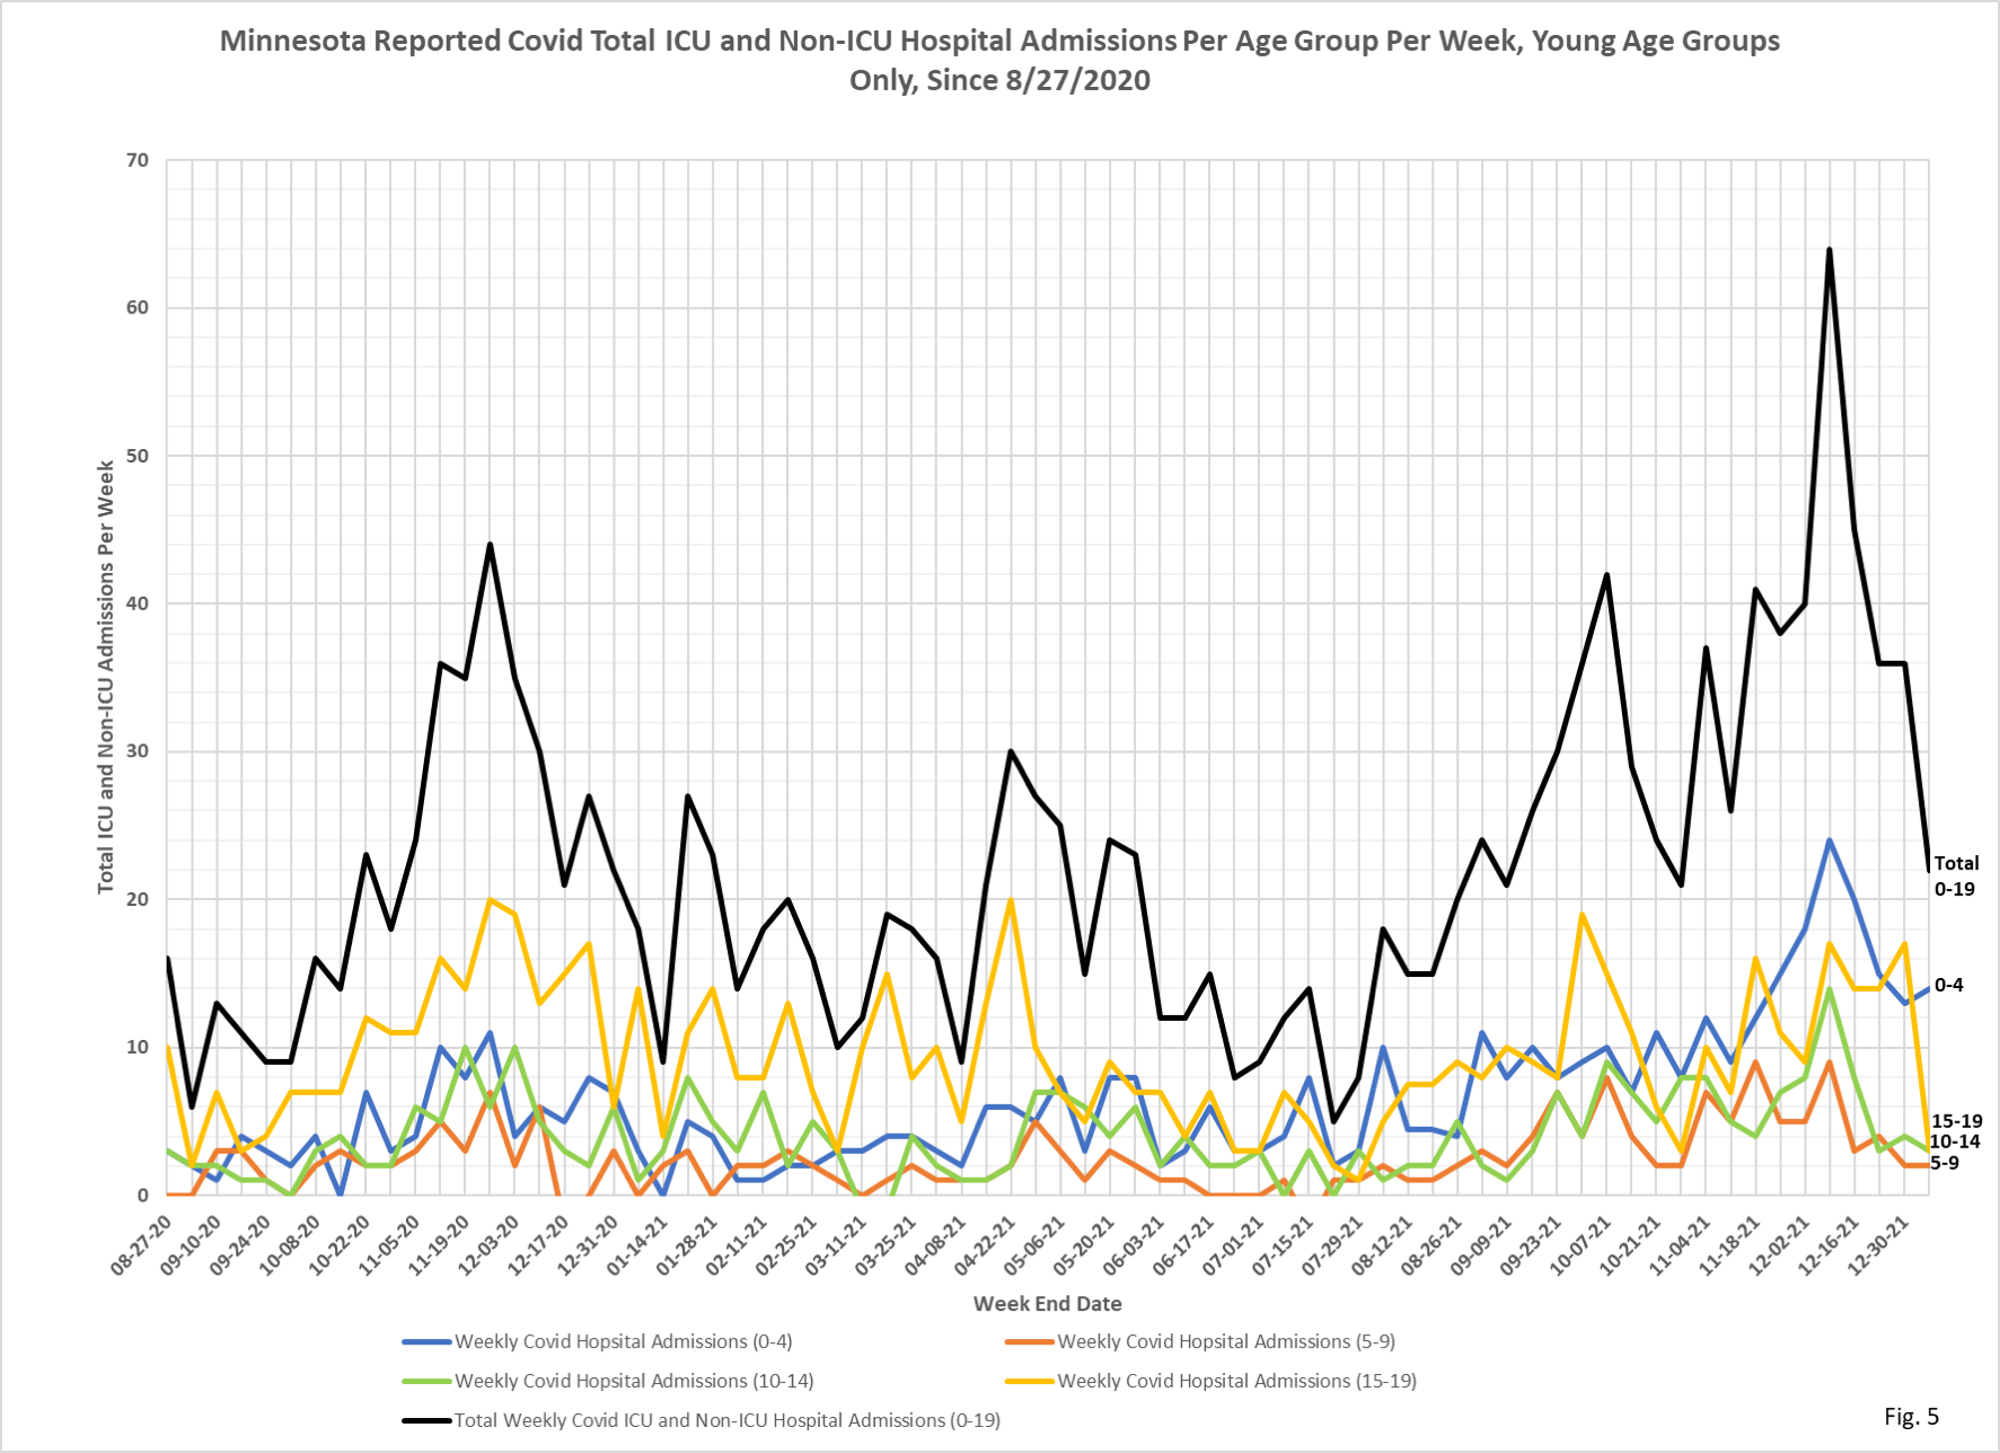
Now non-ICU hosps, and this is the only place you may have a point in regard to one subgroup, with the major caveat I mentioned above and will discuss below. The zero to 4 group and only that group appears to have hit a peak above any previous peaks. No other group does, and the increase in the total line is solely due to that zero to 4 group. So what is going on specific to that group is the question. And the answer likely is RSV which is in season, and other data suggests is highly present in Minnesota and which most significantly targets this very young group and is often co-infectious with CV-19. But even more generally, everyone now, Fauci, Walensky, et al included, have said and acknowledged that many, perhaps a majority of child hospitalizations are not for treatment of CV-19, so why would Minnesota be any different? And the start point is relevant for the claimed huge percent increase, because it isn’t Omicron, no other group is showing that spike and there is absolutely no suggestion that Omicron targets zero to 4 year olds. Why not also talk about the change from mid to late December, the huge plunge? And even those these numbers are somewhat larger, that statistical point I made before applies as strongly, changes in small number events are highly likely to be random.
So an accurate statement would be that we may have experienced a spike in hospitalizations attributed to CV-19 among zero to 4 year olds, but not in any other group, and that should cause a substantial push to insist on an understanding of why. And it would also note that the spike appears to be over, which would also suggest that it was not due to Omicron or CV-19, but to something else.”
Dave’s notes to the charts below:
1. There have been many recent statements in the press and by public officials raising concern about Covid hospitalizations of children. While these reports have tended to emphasize the national rise in young hospitalizations, there is concern that Minnesota will see or has seen the same rise. The stories on national child hosps have been shown to be misleading. For this reason we are plotting this series of charts focused solely on the age groups under 20 years of age. In addition, in order to provide more detail, the data is published using 5 year age groups rather than the 10 year age groups we typical publish.
2. All data is taken from the Minnesota Weekly Report, available here: https://www.health.state.mn.us/diseases/coronavirus/stats/index.html. The Minnesota Weekly Report lists cumulative totals for tests on Page 9, and for cases, hospitalizations, and deaths on Page 22. These cumulative totals are tabulated each week and differences are taken to plot the weekly changes. All data is on a date reported basis, rather than an actual date of event basis, because in its infinite wisdom, while the state has date of event and uses it in the Situation Report it doesn’t use it in the Weekly Report.
3. Fig. 1: Testing shows the large changes from week to week in recent months, as we have noted in our Age Structure posts many times. It is unknown if these differences represent real changes in testing, or changes in reporting, or both.
4. Fig. 2: Cases in children reached a weekly high on 11/29/21, exceeding the 2020 peak, before receding again. The recent weekly low case count on 12/23/2021 may be partly due to disruptions in testing around the holiday season.
5. Fig. 3: ICU hospital admissions in children due to appear to be increasing at an accelerating rate, but are so low that any change is as likely random as due to any other cause. The highest weekly admissions seen for any of these age groups is 4, seen in the 0-4 and 15-19 age group in recent weeks. Extremely low numbers.
6. Fig. 4: Non-ICU admissions peaked on 12/09/2021 with the 0-4 age group having the highest weekly admissions of the entire series at 22, before decreasing sharply in recent weeks. Very low numbers of hosps in the young.
7. Fig. 5: Total ICU and Non-ICU admissions largely mirror the Non-ICU admissions curves, due to the larger numbers of Non-ICU admissions.

Our kids attend a university in Seattle, and I’m in a facebook group for parents. The majority seem to be decrying any in-person classes (except parents of science majors, who understand their kids’ degrees will be worth nothing, if they never see the inside of a lab.) When I posted actual government statistics on the complete non-existence of risk for healthy college-age kids, the push back was strong enough, and the insults flying against me so fast, that the moderator shut down the thread. People react strongly if you attempt to pop their fear bubble. When someone asked how could I post something so evil! I replied: “Ralph Waldo Emerson: Knowledge is the antidote of fear.” I will say, though, that I also had many positive reactions to my posts–likely outnumbering the fear-wallowers.
So, just for the fun of it today, I looked at the King County (Seattle) statistics for covid deaths and for opioid deaths.
In the entire 2-year period of the pandemic, there have been 14 covid-tagged deaths in 20-29 year olds.
In a single year, 2021, there were 61 opioid overdose deaths, and 98 if you include those that also had alcohol or another sedative in their system.
So between 4 to 7 times more young adults died of opioids in a single year than covid has killed in two years. A search of the parent’s board turns up no posts warning about the risk to our students from opioids.
the lack of balance and consideration for the whole of public health in the epidemic response is astounding. And a lot of those drug and alcohol abuse deaths are caused by what we have done to children and young people during the epidemic.
Some context: there are about 1,700,000 20 and under in MN. The chart numbers are tiny, relatively and absolutely.
Kevin previously analyzed the young and deaths attributed to CV-19:
“CV-19 Deaths in Young Minnesotans”
Kevin Roche, December 29, 2021