And the last of our regular updates based on breakthru data put out each Monday. This shows relative case rates of hospitalizations and deaths for vaxed and unvaxed persons. Note that this is just if you get infected, what are the relative rates. To figure the total difference in risk, you would also have to take into account difference in risk of getting infected in the first place. Dave’s notes:
1. The case hospitalization rates and case death rates are simply the percentage of those who test positive for Covid in a given period of time who go on to be admitted to a hospital or die.
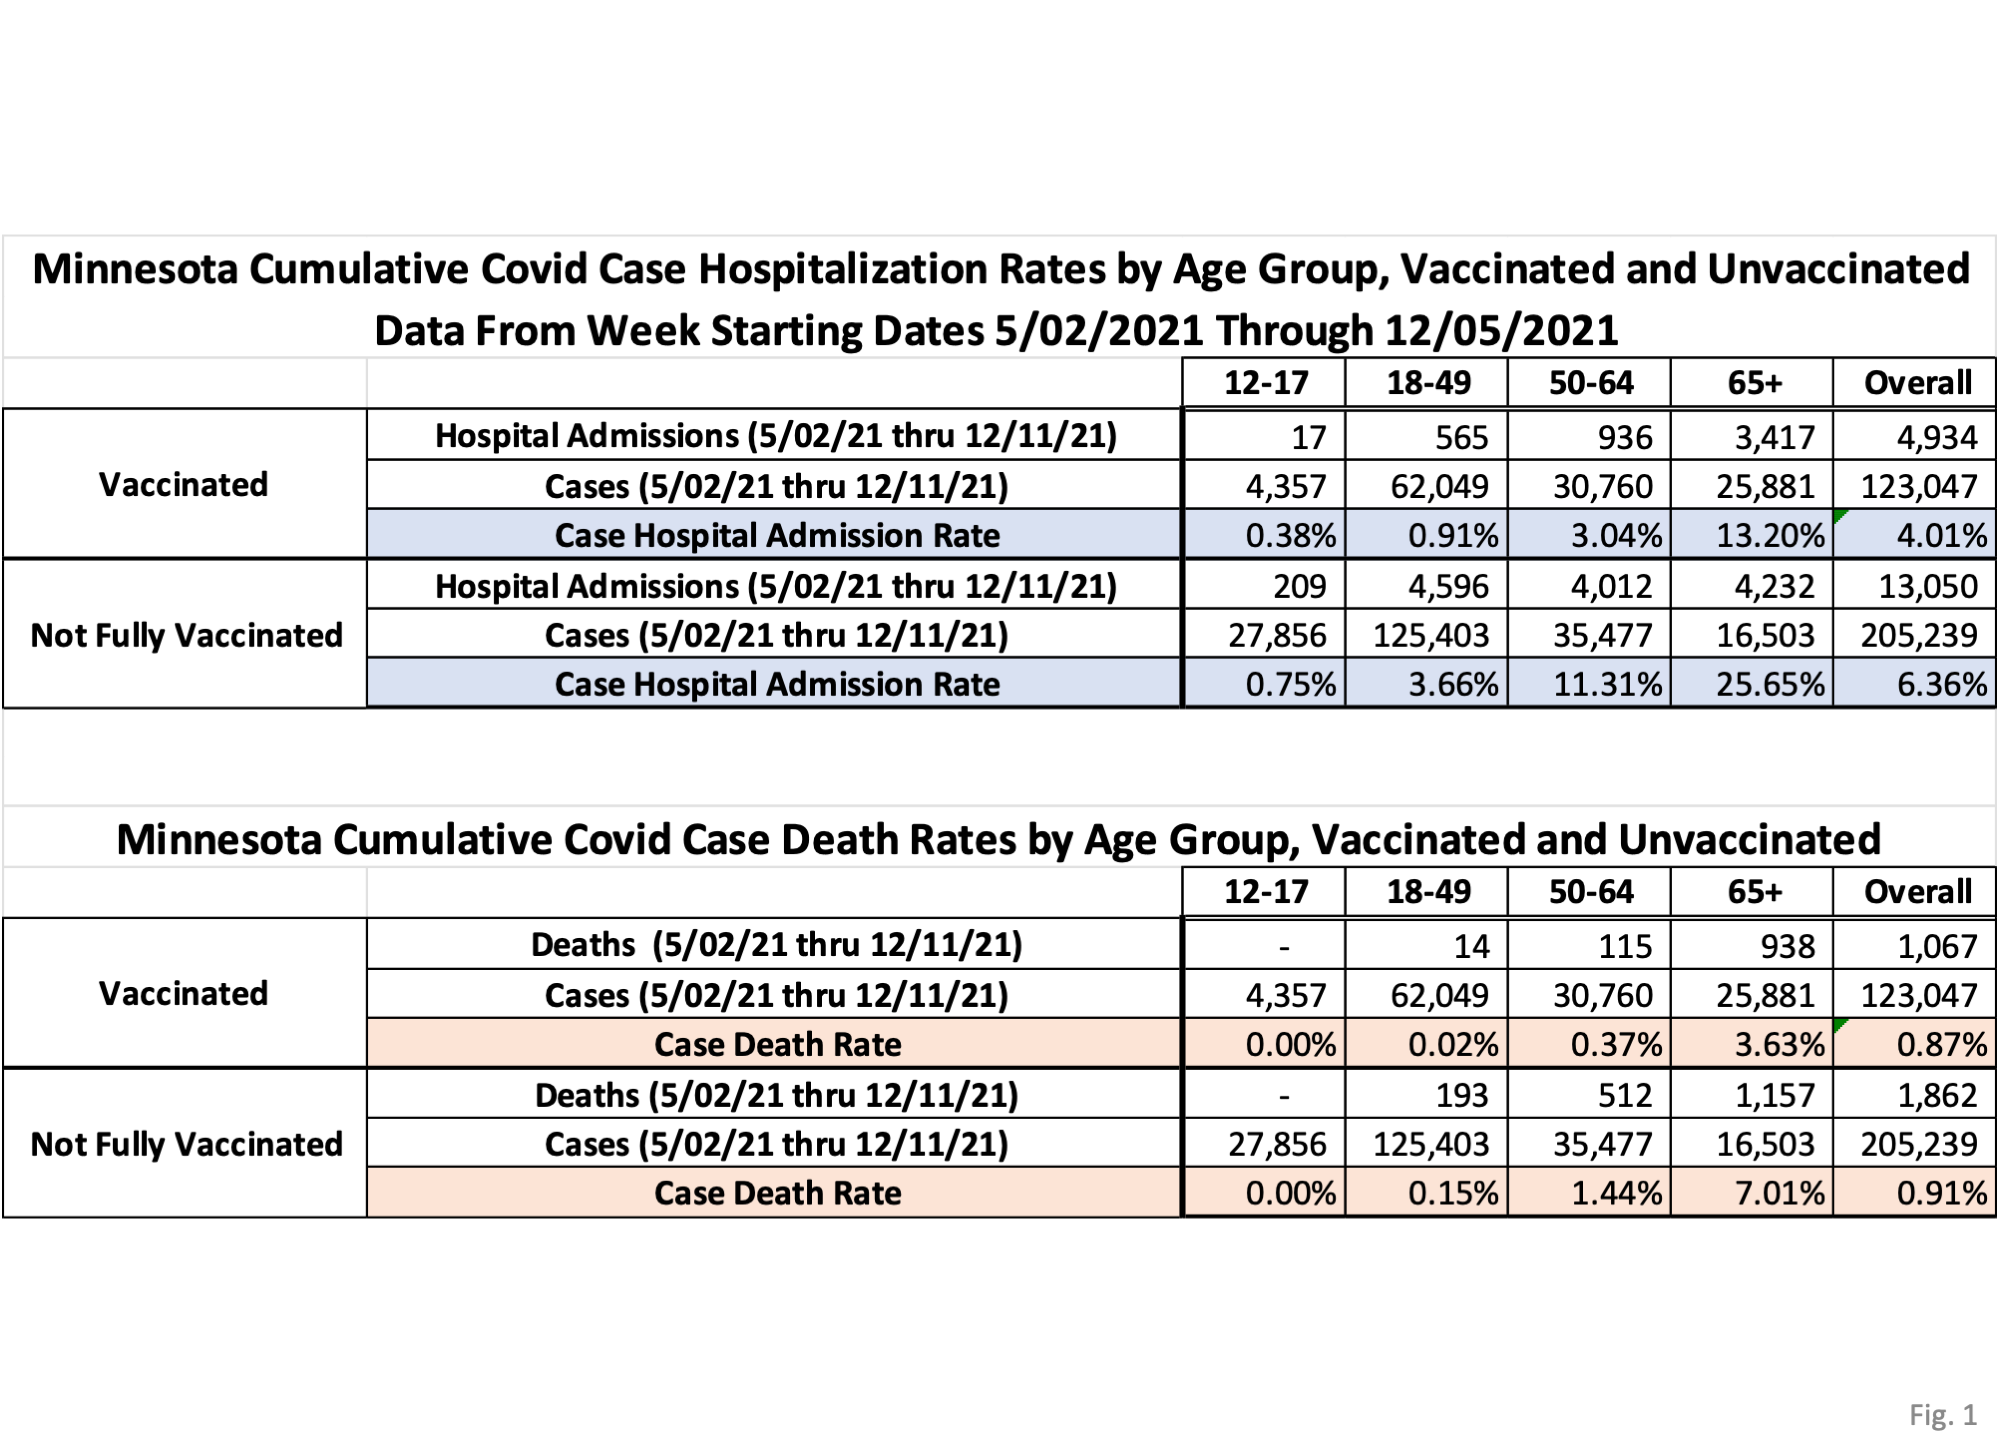
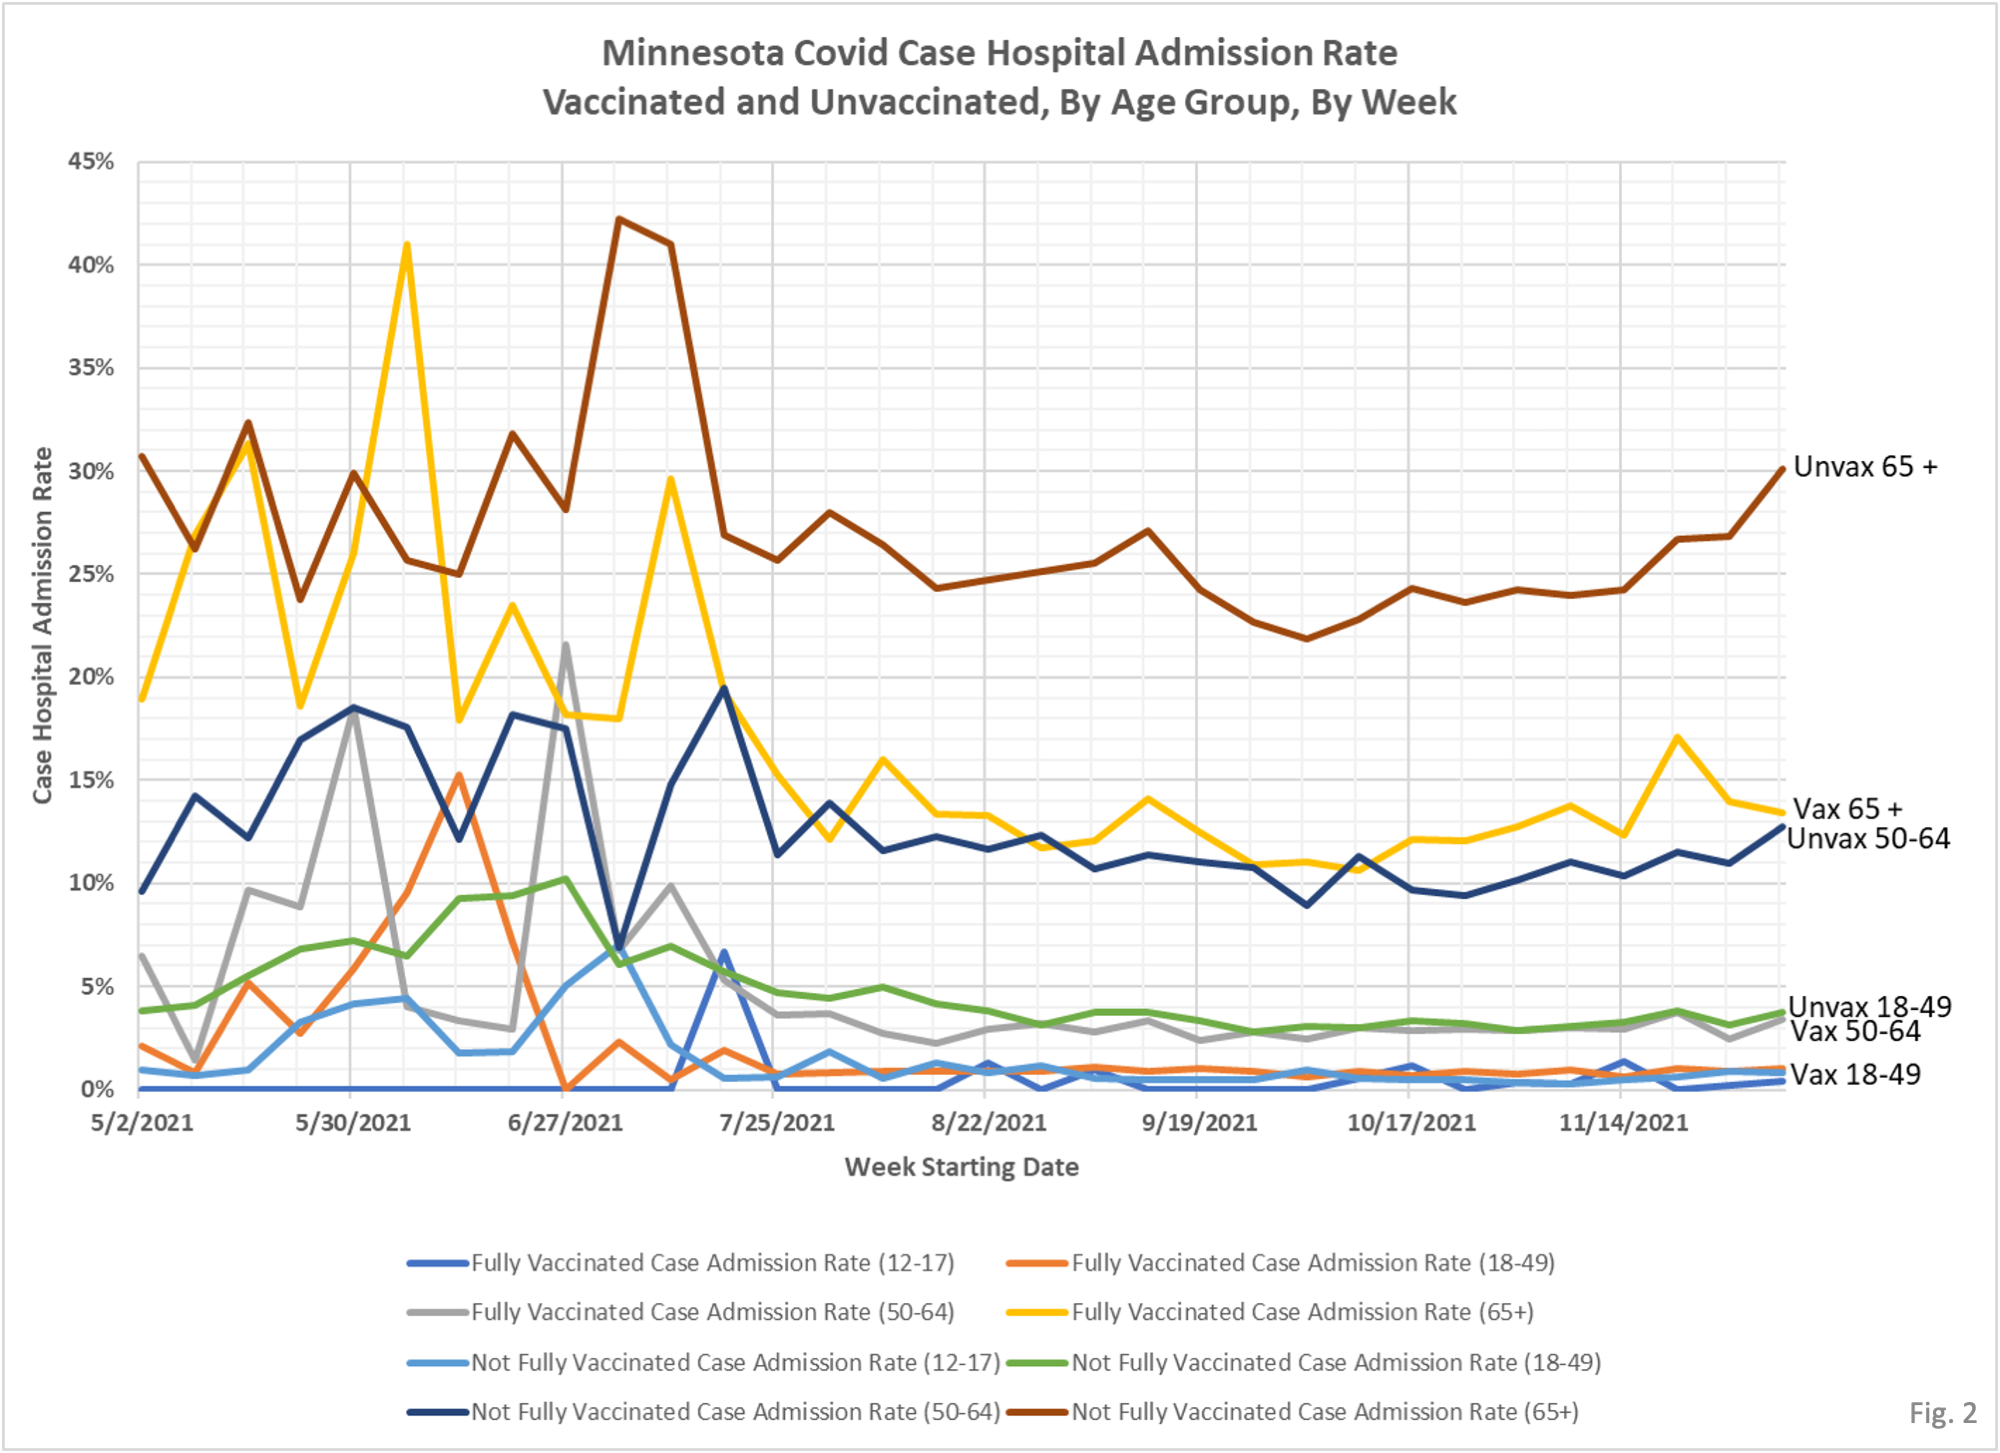
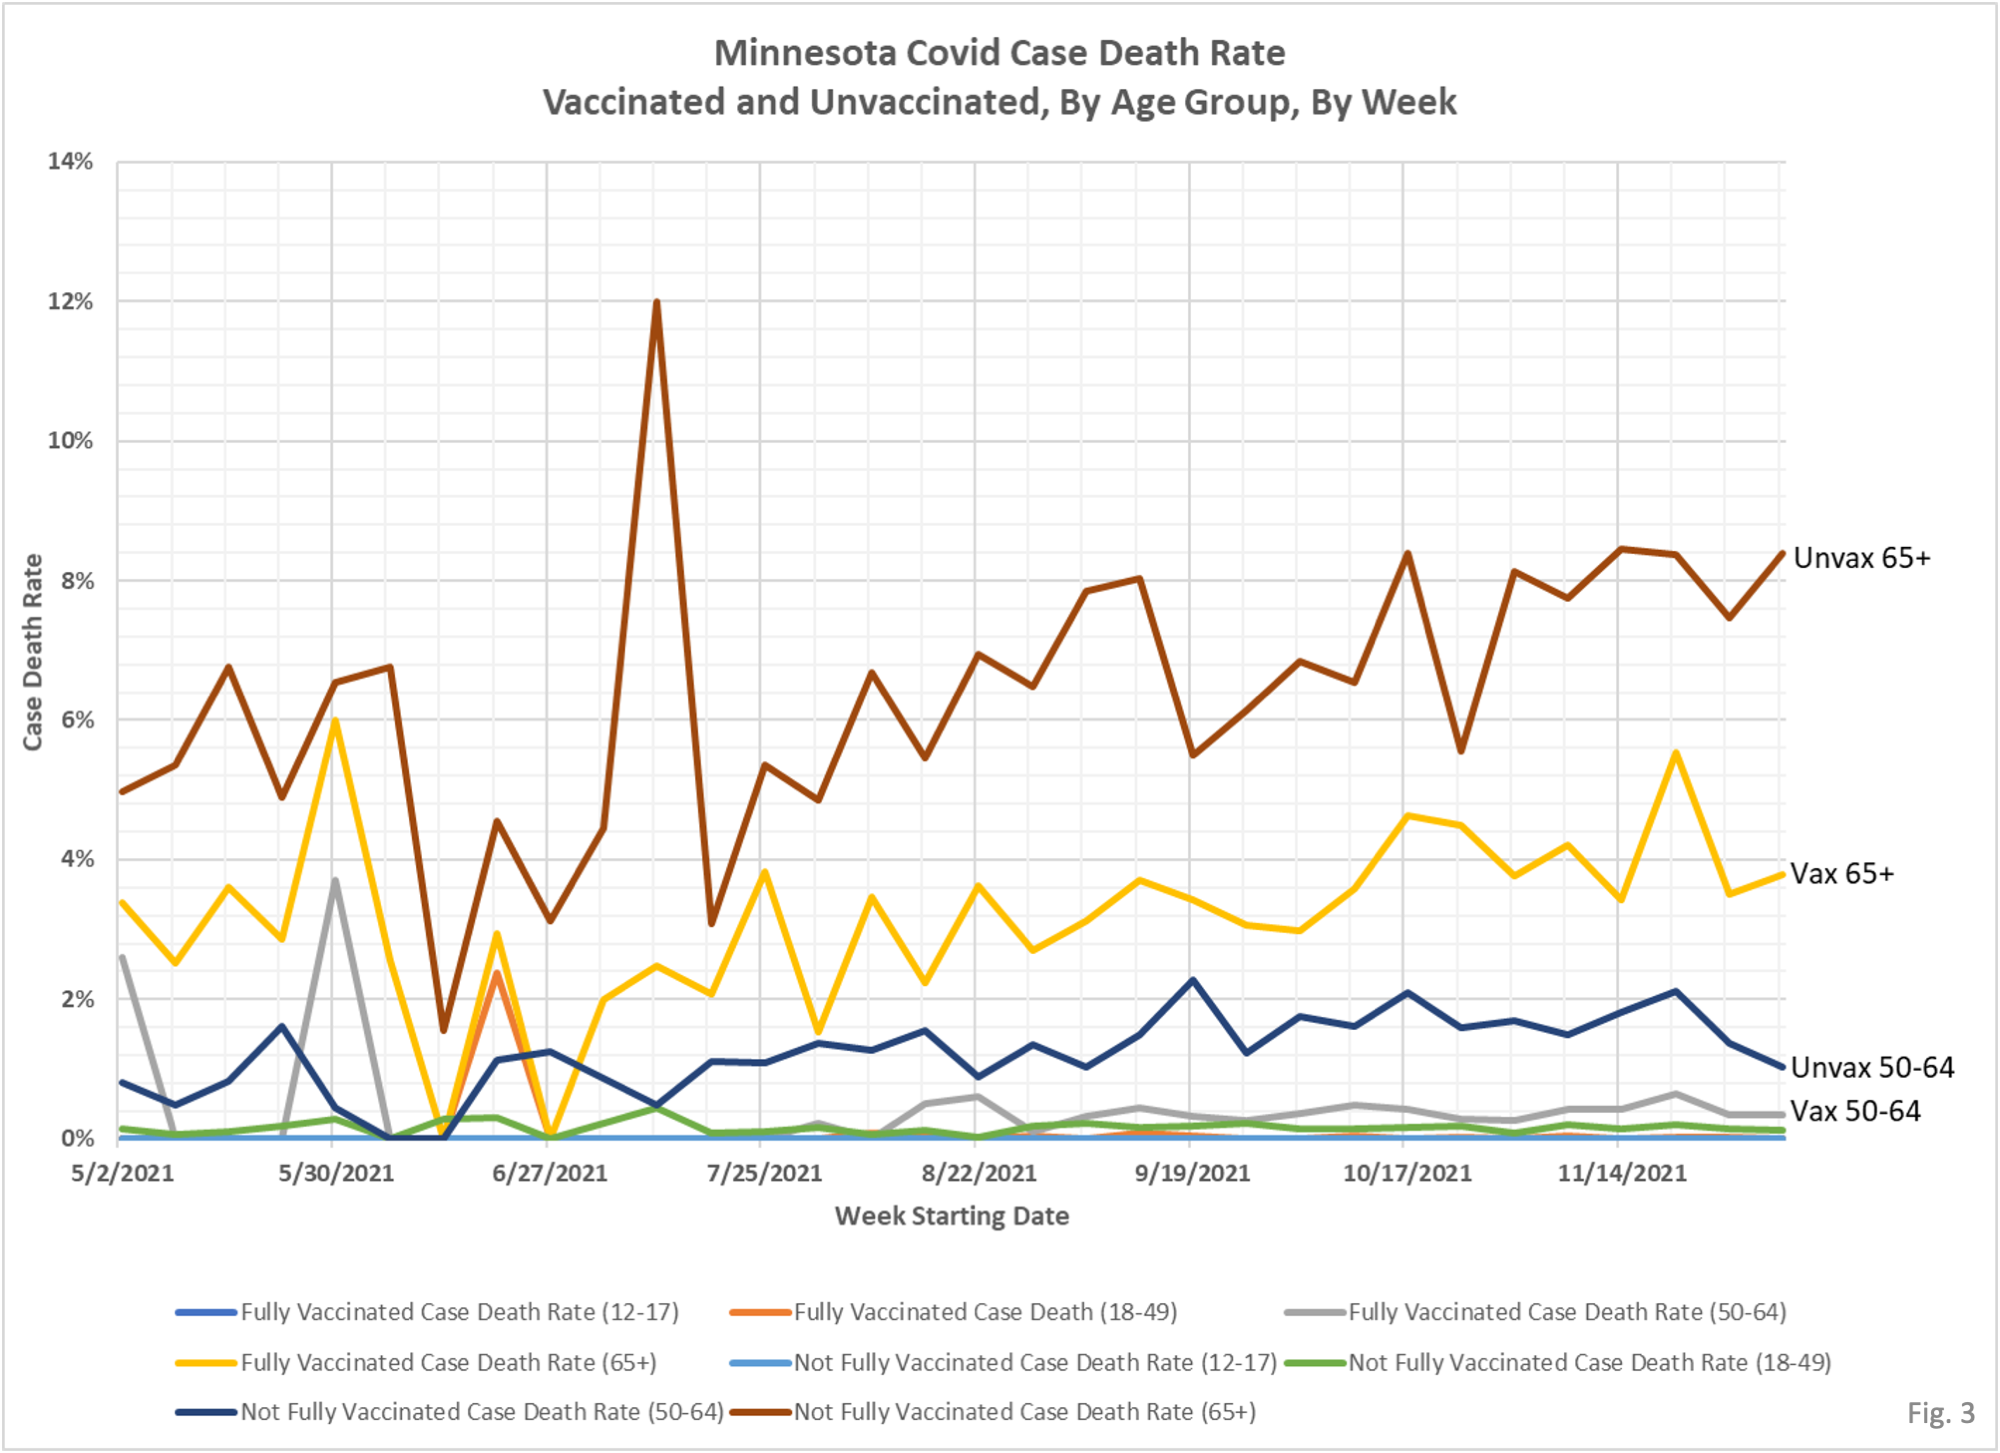
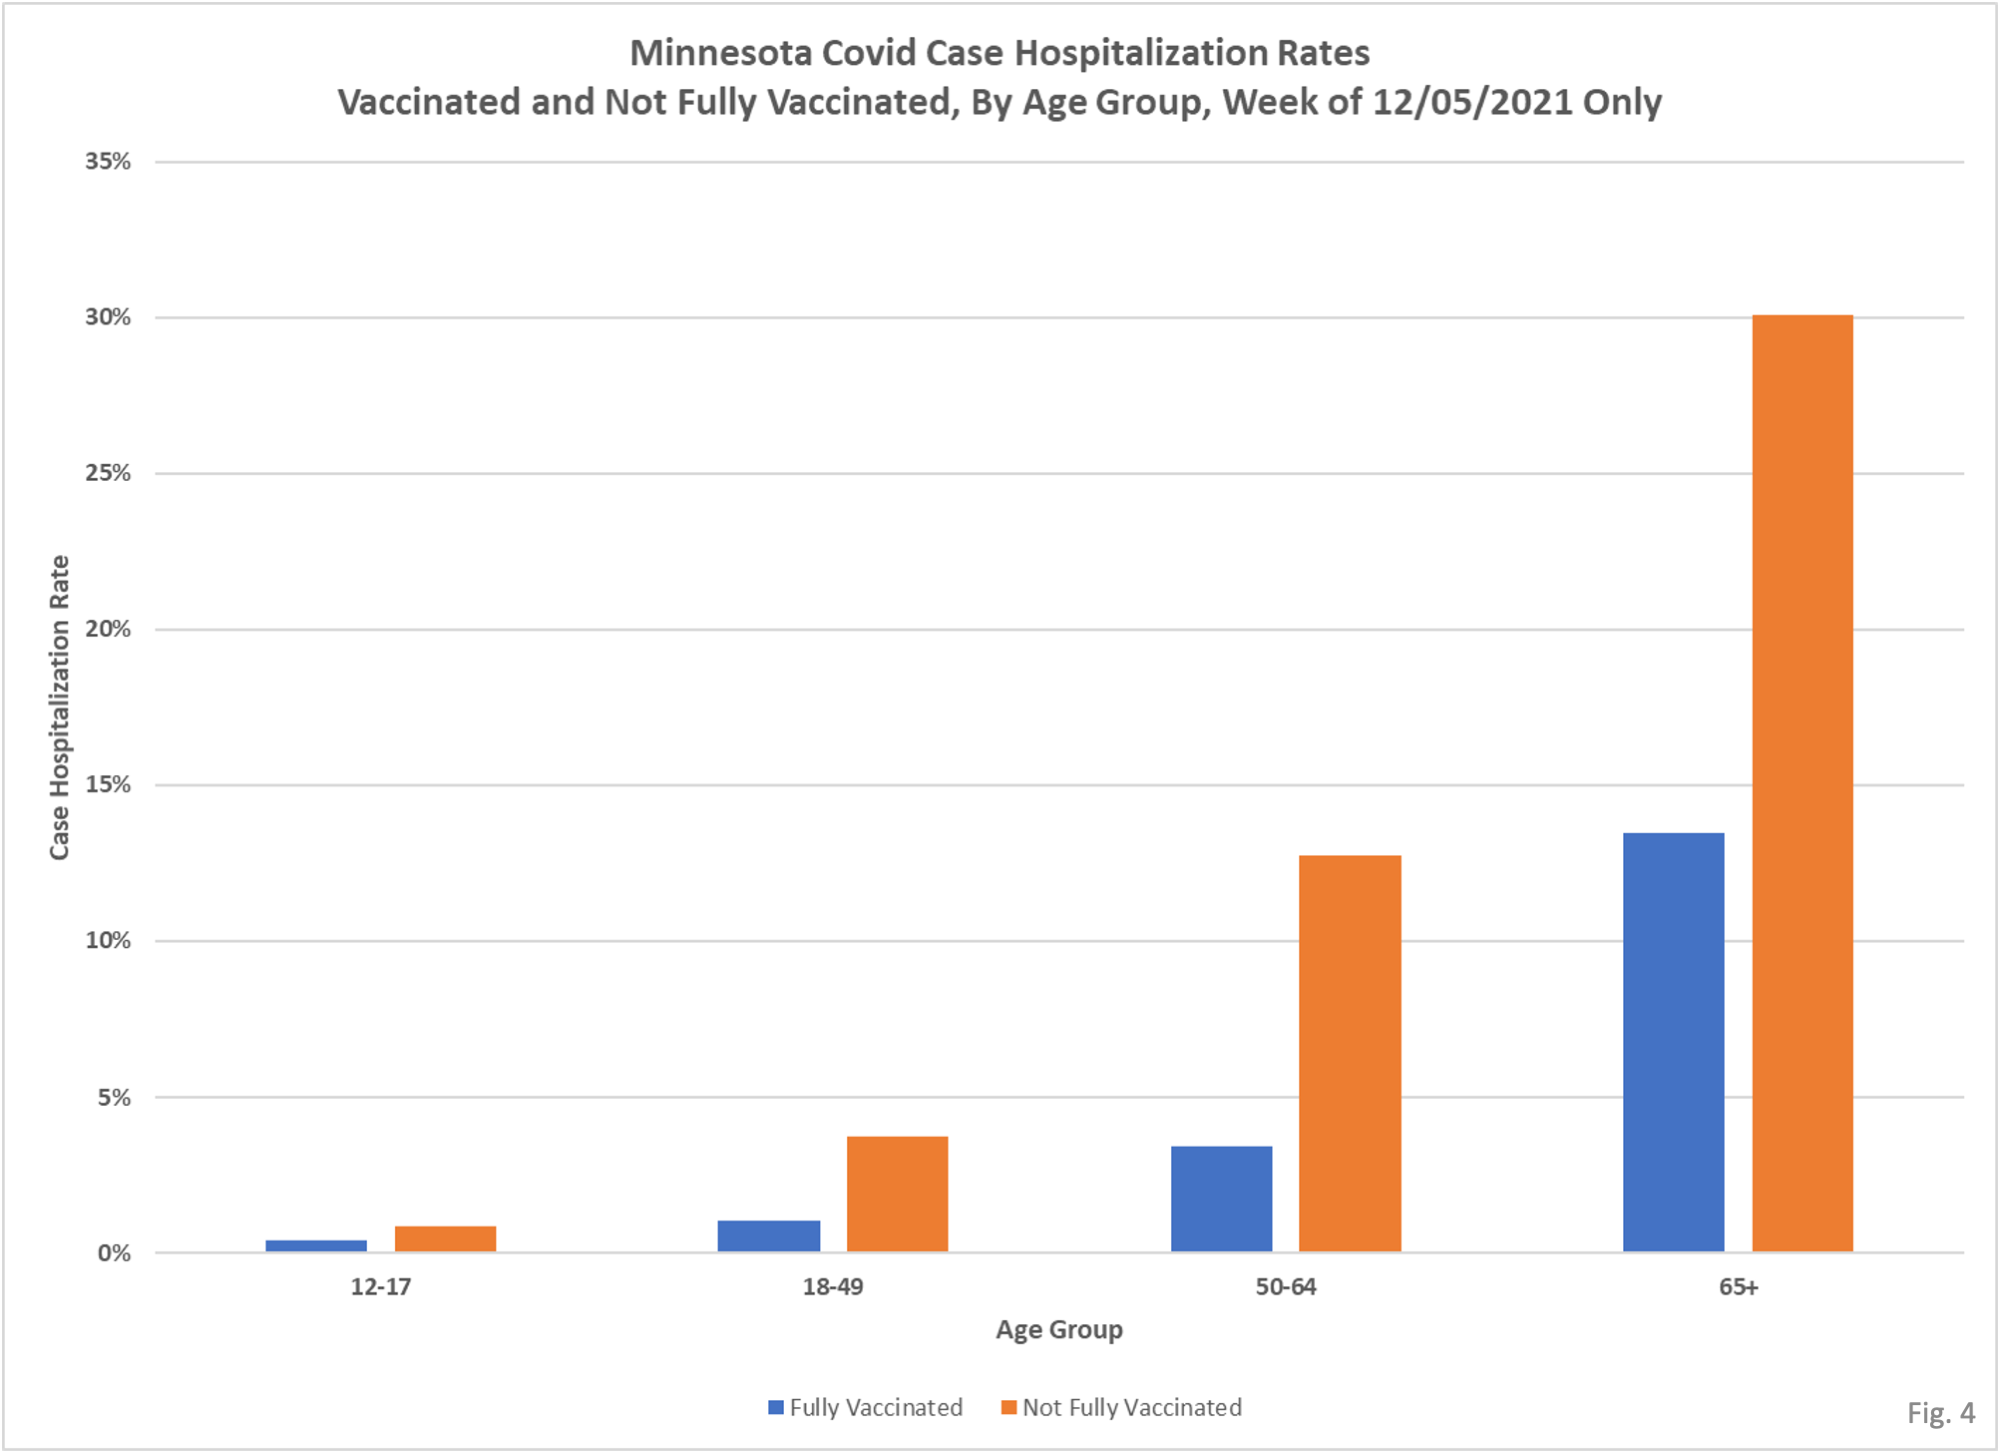
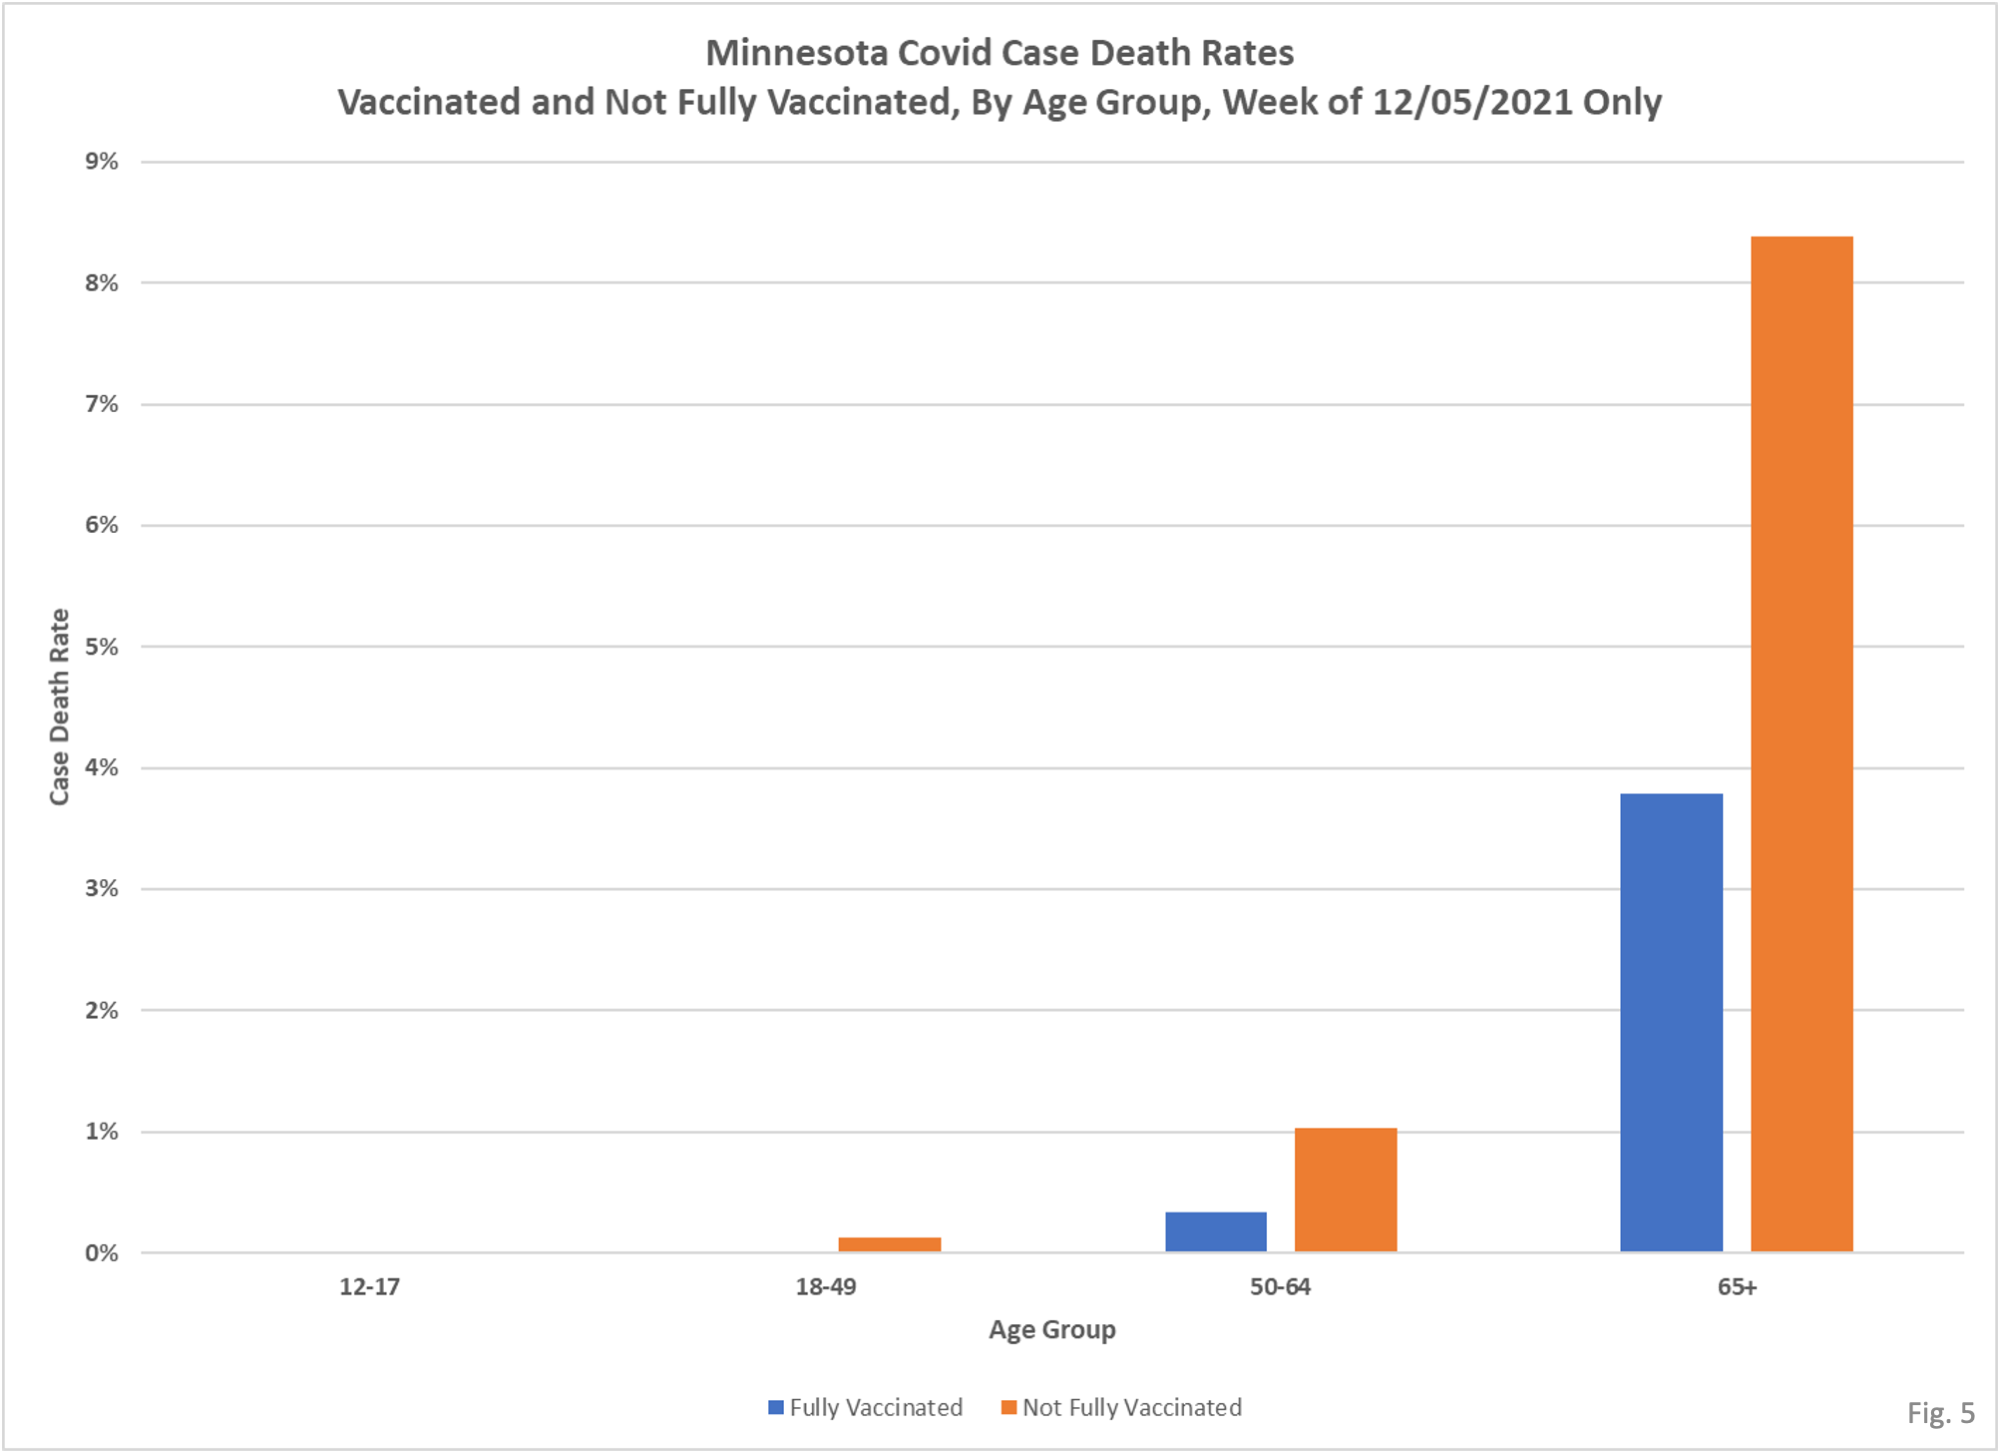
2.The charts below look at a Minnesota Department of Health (MDH) data set a couple different ways. Fig. 1 shows the cumulative case hospital admissions rates and cumulative case death rates for vaccinated and unvaccinated people by age group, over the time period data is provided for (5/02/2021 thru 12/11/2021 specimen collection dates). Figures 2 and 3 show the case hospitalization rates and case death rates over time on a week by week basis. Figures 4 and 5 shows the relative data for the most recent week we have data for, the week starting 12/05/2021. Figures 4 and 5 are simply another representation for the most recent week of data from Figures 2 and 3.
3. The source for this data is the MDH Vaccine Breakthrough Weekly Update https://www.health.state.mn.us/diseases/coronavirus/stats/vbt.html which is updated every Monday. In the notes under the graphic “Cases, Hospitalizations, and Deaths Over Time” MDH publishes an Excel file of the underlying data here: https://www.health.state.mn.us/diseases/coronavirus/stats/vbtaarates.xlsx . This data file contains rates per 100,000 for cases, hospitalizations, and deaths. In order to calculate case rates we must first calculate the actual cases, hospitalizations, and deaths that these rates represent. Cases, hospitalizations, and deaths are found by multiplying the rates per 100,000 times the vaccinated population of each age group, and then dividing by 100,000. The vaccinated population for each age group is defined as those who completed their vaccine series at least 14 days prior to the start of the week, from the MDH Vaccine Data web page, where the “People Vaccinated by Age data file is published: https://mn.gov/covid19/assets/People%20Vaccinated%2C%20By%20Age_tcm1148-513634.csv
4. Cases, hospitalizations, and deaths among the unvaccinated are found by multiplying the unvaccinated rates per 100k by the unvaccinated population, and then dividing by 100,000. The unvaccinated population is calculated by subtracting the vaccinated population from the total population of each age group, taken from the US Census American Community Survey 5 year data table S101 for Minnesota available by searching here: https://data.census.gov/cedsci/table. MDH has informed us that the ACS 5-year survey is the correct population data source.
5. Once the cases, hospitalizations, and deaths are calculated, the hospitalization and death case rates are found by dividing the hospitalizations and deaths by cases for each group and time period.
6. The key takeaways from Fig. 1 is that for all age groups the not fully vaccinated are much more likely to be hospitalized than the vaccinated, once testing positive. The rows highlighted blue are the vaccinated and unvaccinated hospitalizations rates. Similarly, the case death rates for the unvaccinated are much higher than for the vaccinated, as seen in the peach colored rows.
7. Also note in Figure 1 that the cases for the Fully Vaccinated 65+ are much larger than for the Not Fully Vaccinated over the 5/02/2021 to 12/11/2021 time period, calculating cases from the provided case rates. Even though the Not Fully Vaccinated have a much higher chance the testing positive than the vaccinated, the much larger 65+ vaccinated population causes the 65+ vaccinated cases to be higher than the Not Fully Vaccinated cases. This seems perhaps a little counterintuitive, but if MDH would provide data in response to several of our Data Practice Act requests we could more fully confirm this finding.
8. Figures 2 and 3 show how the case hospitalization and case death rates change week to week. Note that when testing rates are low, and fewer asymptomatic positives are found, then that may tend to increase the rates, as seen for June and July 2021. Some irregularities, like the 12% case death rate for the unvaccinated 65+ age group the week of 7/11/2021 are likely data anomalies.
9. Figures 4 and 5 display all of the rates for the most recent week we have data, the week starting 12/05/21. These are a good visual representation of the relative rates, and therefore risks, between the vaccinated and unvaccinated, and between the age groups. It is not clear why the data shows the vaccinated 12-17 year old age group was more likely to be hospitalized than the unvaccinated. It is likely that many young people are asymptomatic positives and therefore never tested, which would tend to lower the unvaccinated case rate.
10. The rates presented here should be considered indicative, and not actual representations of the true rates. Attempts to reconcile this data with other MDH data sets consistently yields discrepancies of roughly +/- 10%, likely due to differences in the vaccinated and unvaccinated populations used in this analysis vs. that used by MDH. In addition, there are numerous sources of errors, such as people who are positive without being tested, people who were vaccinated in jurisdictions which don’t share data with MDH, etc.

Are there any data on effectiveness of the mask mandates for St. Paul and Minneapolis for infection, hospitalization, or deaths? Some information is available at the county level, by not by city. County per capita infection rates are similar for all metro counties. Wonder what models were used as a basis for the mask mandates. Anybody know who advises the Minneapolis and St. Paul mayors?
“The key takeaways from Fig. 1 is that for all age groups the not fully vaccinated are much more likely to be hospitalized than the vaccinated, once testing positive.”
I guess that “much more” is in the eye of the beholder. It looks to me like the difference is a factor of four for ages 18-64 and a factor of two for those older and younger. Significant, but far short of the factor of 10-20 difference advertised. I can think of two reasons other than the vaccine under performing. One is that those who are vaccinated might be less likely to get tested for mild illness. But the long lines for testing in NYC argue against that. The other is that vaccination does little to prevent hospitalizations and deaths “with” covid but not due to covid.
Yet another reason why we need proper data rather than scare’em data.
remember those are only case rates, you would also have to figure in the difference in likelihood of getting infected