Dave Dixon’s usual Monday update on breakthrough events. Please note that the delays in processing which are occurring at DOH means that the proportions are likely undercounts, as identifying breakthrus is low on DOH’s priority list. And as you can see by the dates on the table, the entire analysis is lagged due to the time it takes for a person to be considered fully vaxed and the time to match events and vax status. When the processing is fully completed and up-to-date, I fully expect that current proportions will be much higher than shown in the table. T Dave’s notes:
1. The table and charts are updated for new data released by Minnesota Department of Health (MDH) on 1/10/2022, adding data for the week starting 12/05/2021.
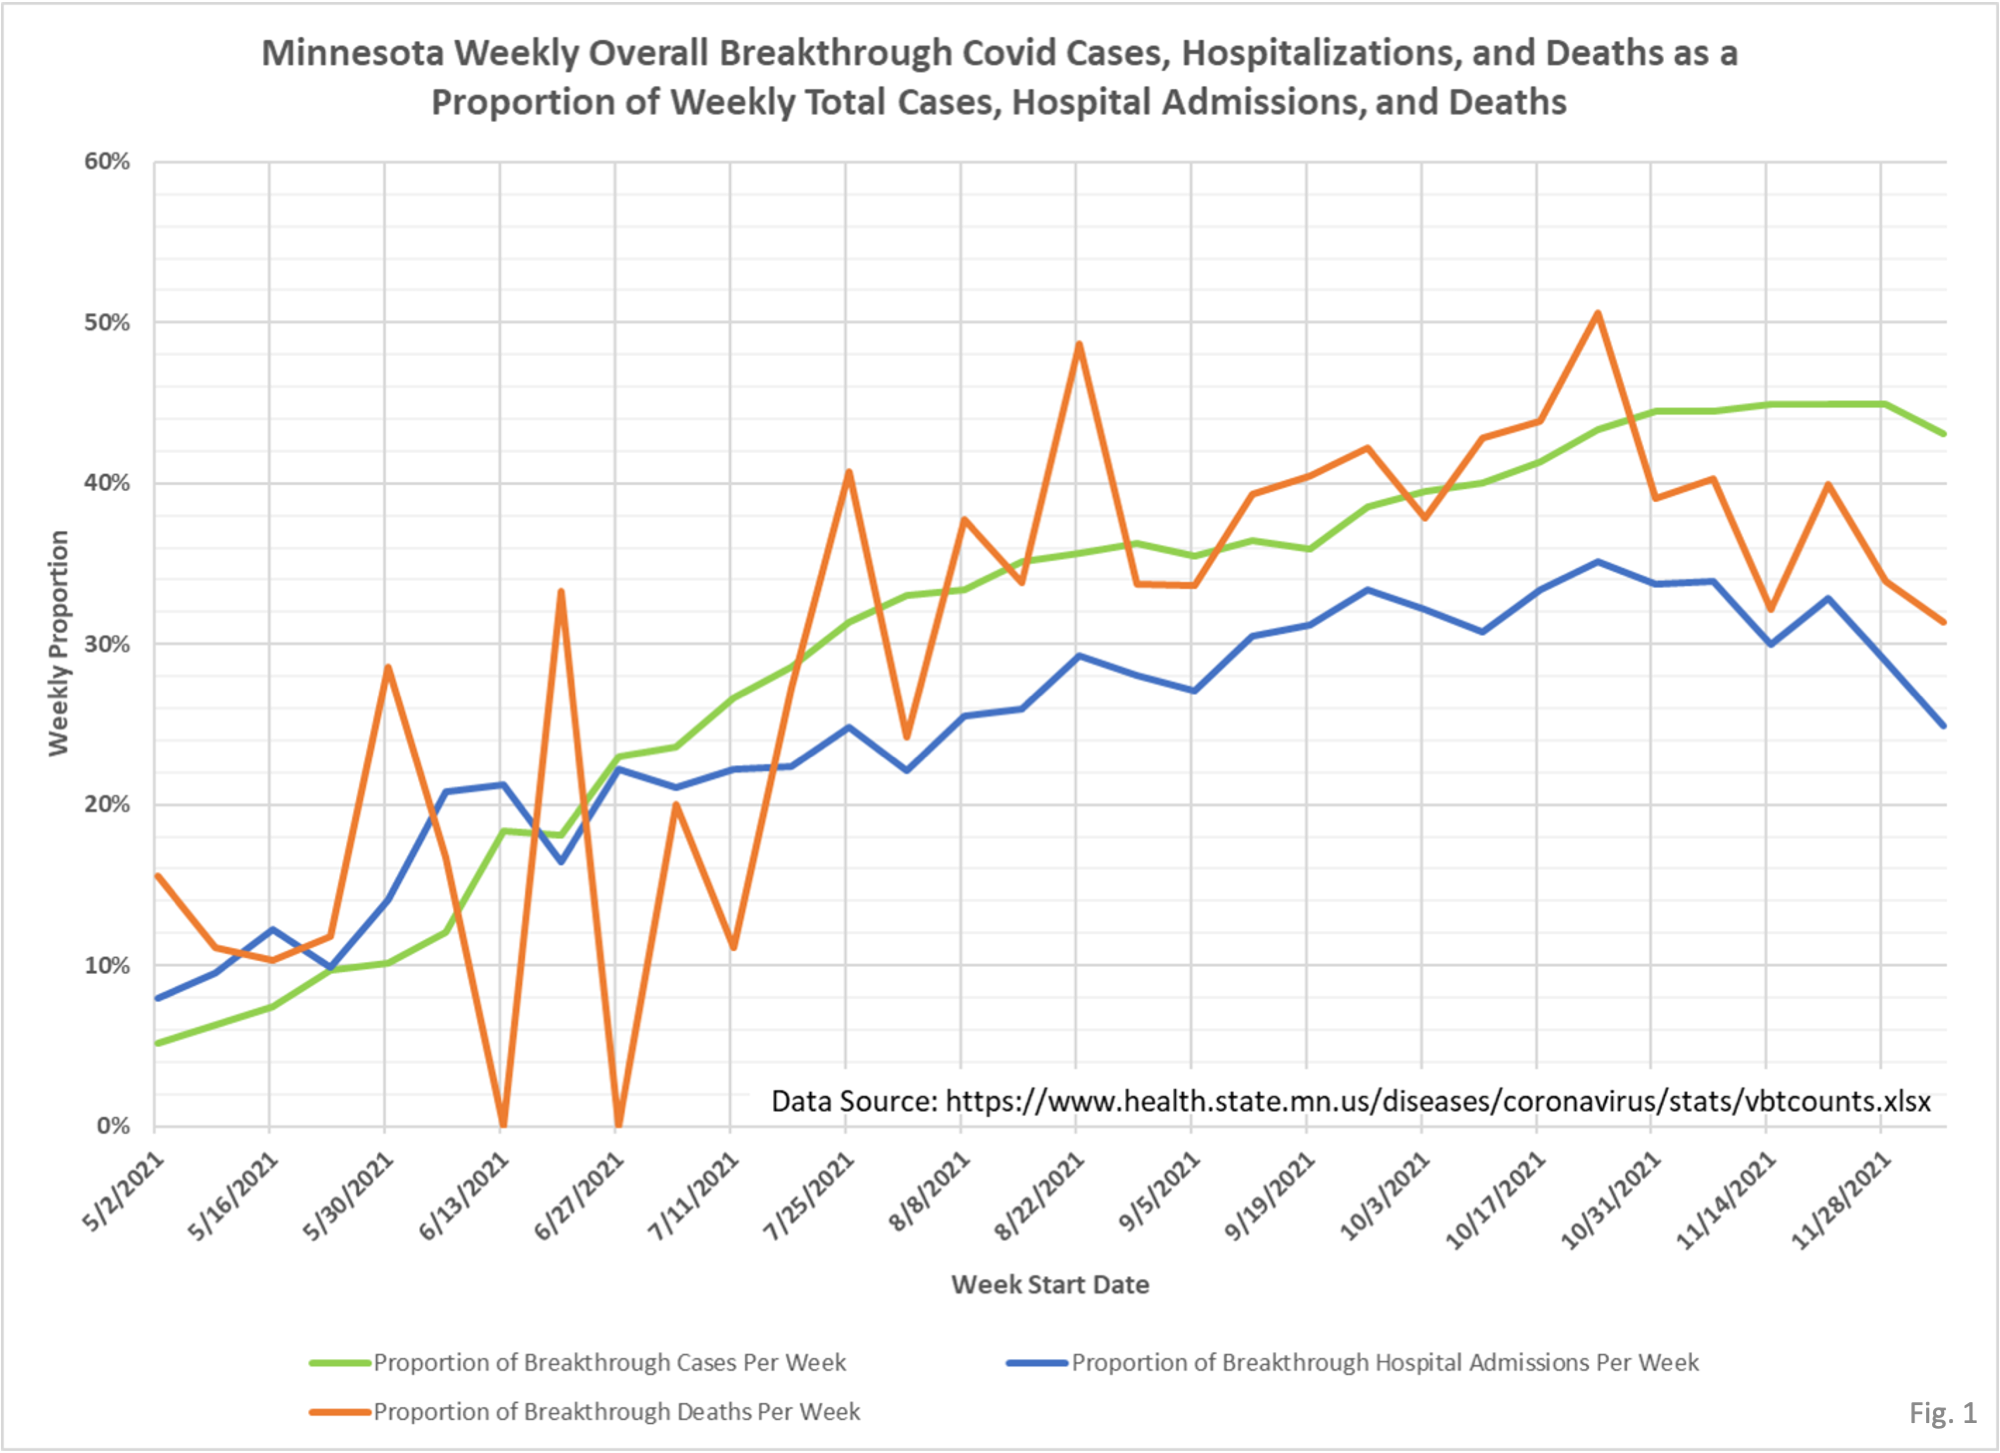
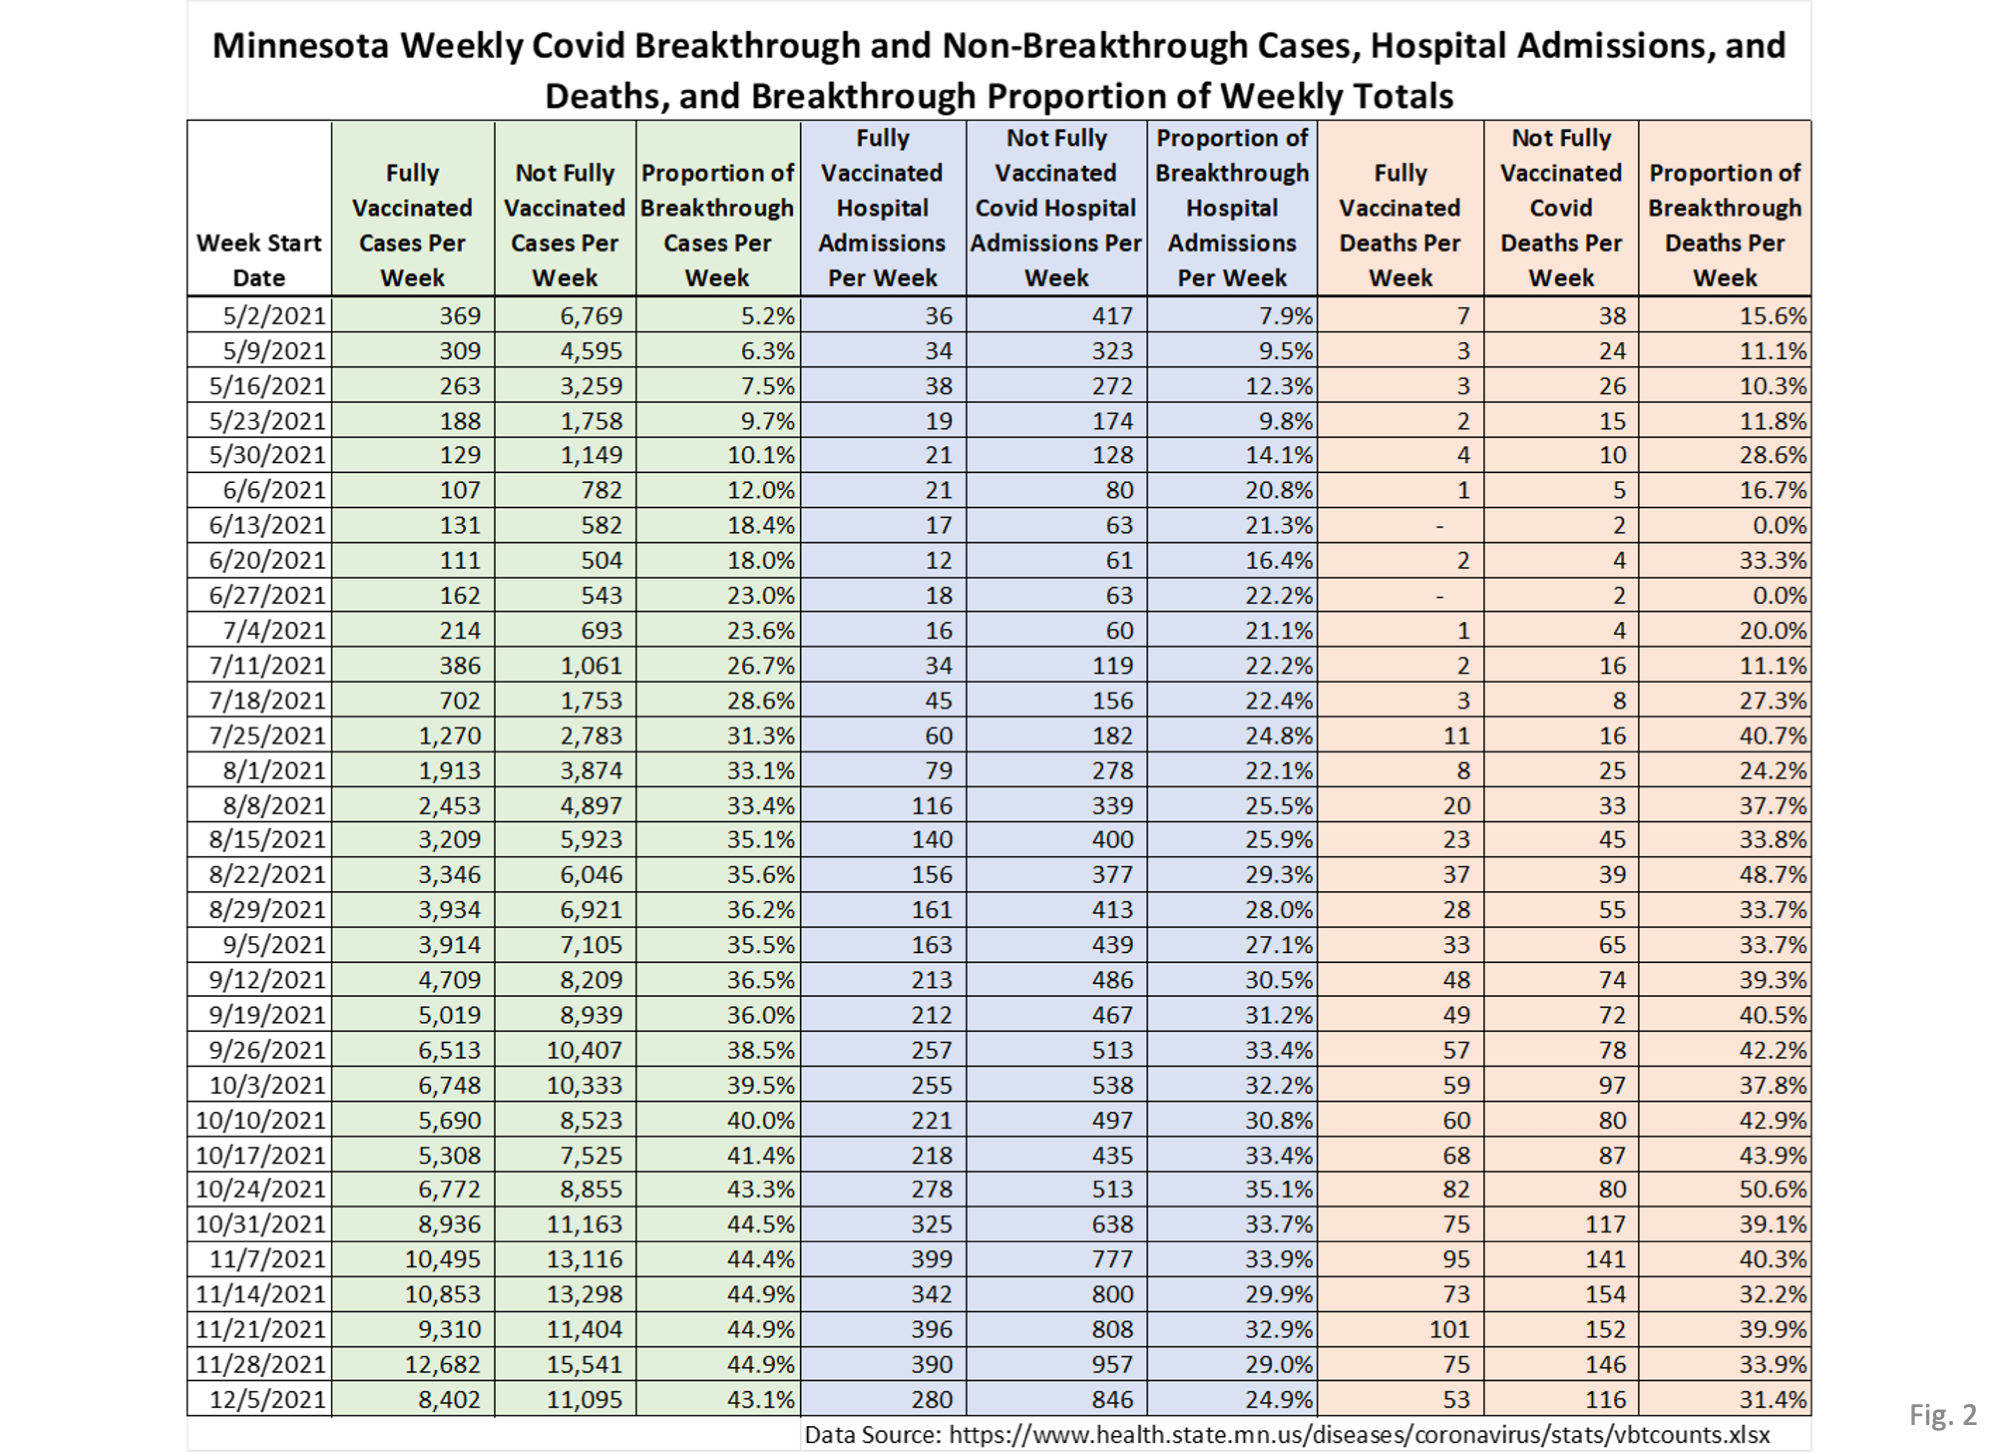
The data source for Fig. 1 and Fig. 2 is the data file https://www.health.state.mn.us/diseases/coronavirus/stats/vbtcounts.xlsx found on MDH web page https://www.health.state.mn.us/diseases/coronavirus/stats/vbt.html.
2. The data provided in the data file vbtcounts.xlsx is used without modification, other than to sum the weekly events and compute the breakthrough proportion. Vbtcounts.xlsx provides breakthrough and non-breakthrough cases, hospital admissions, and deaths for each week listed.
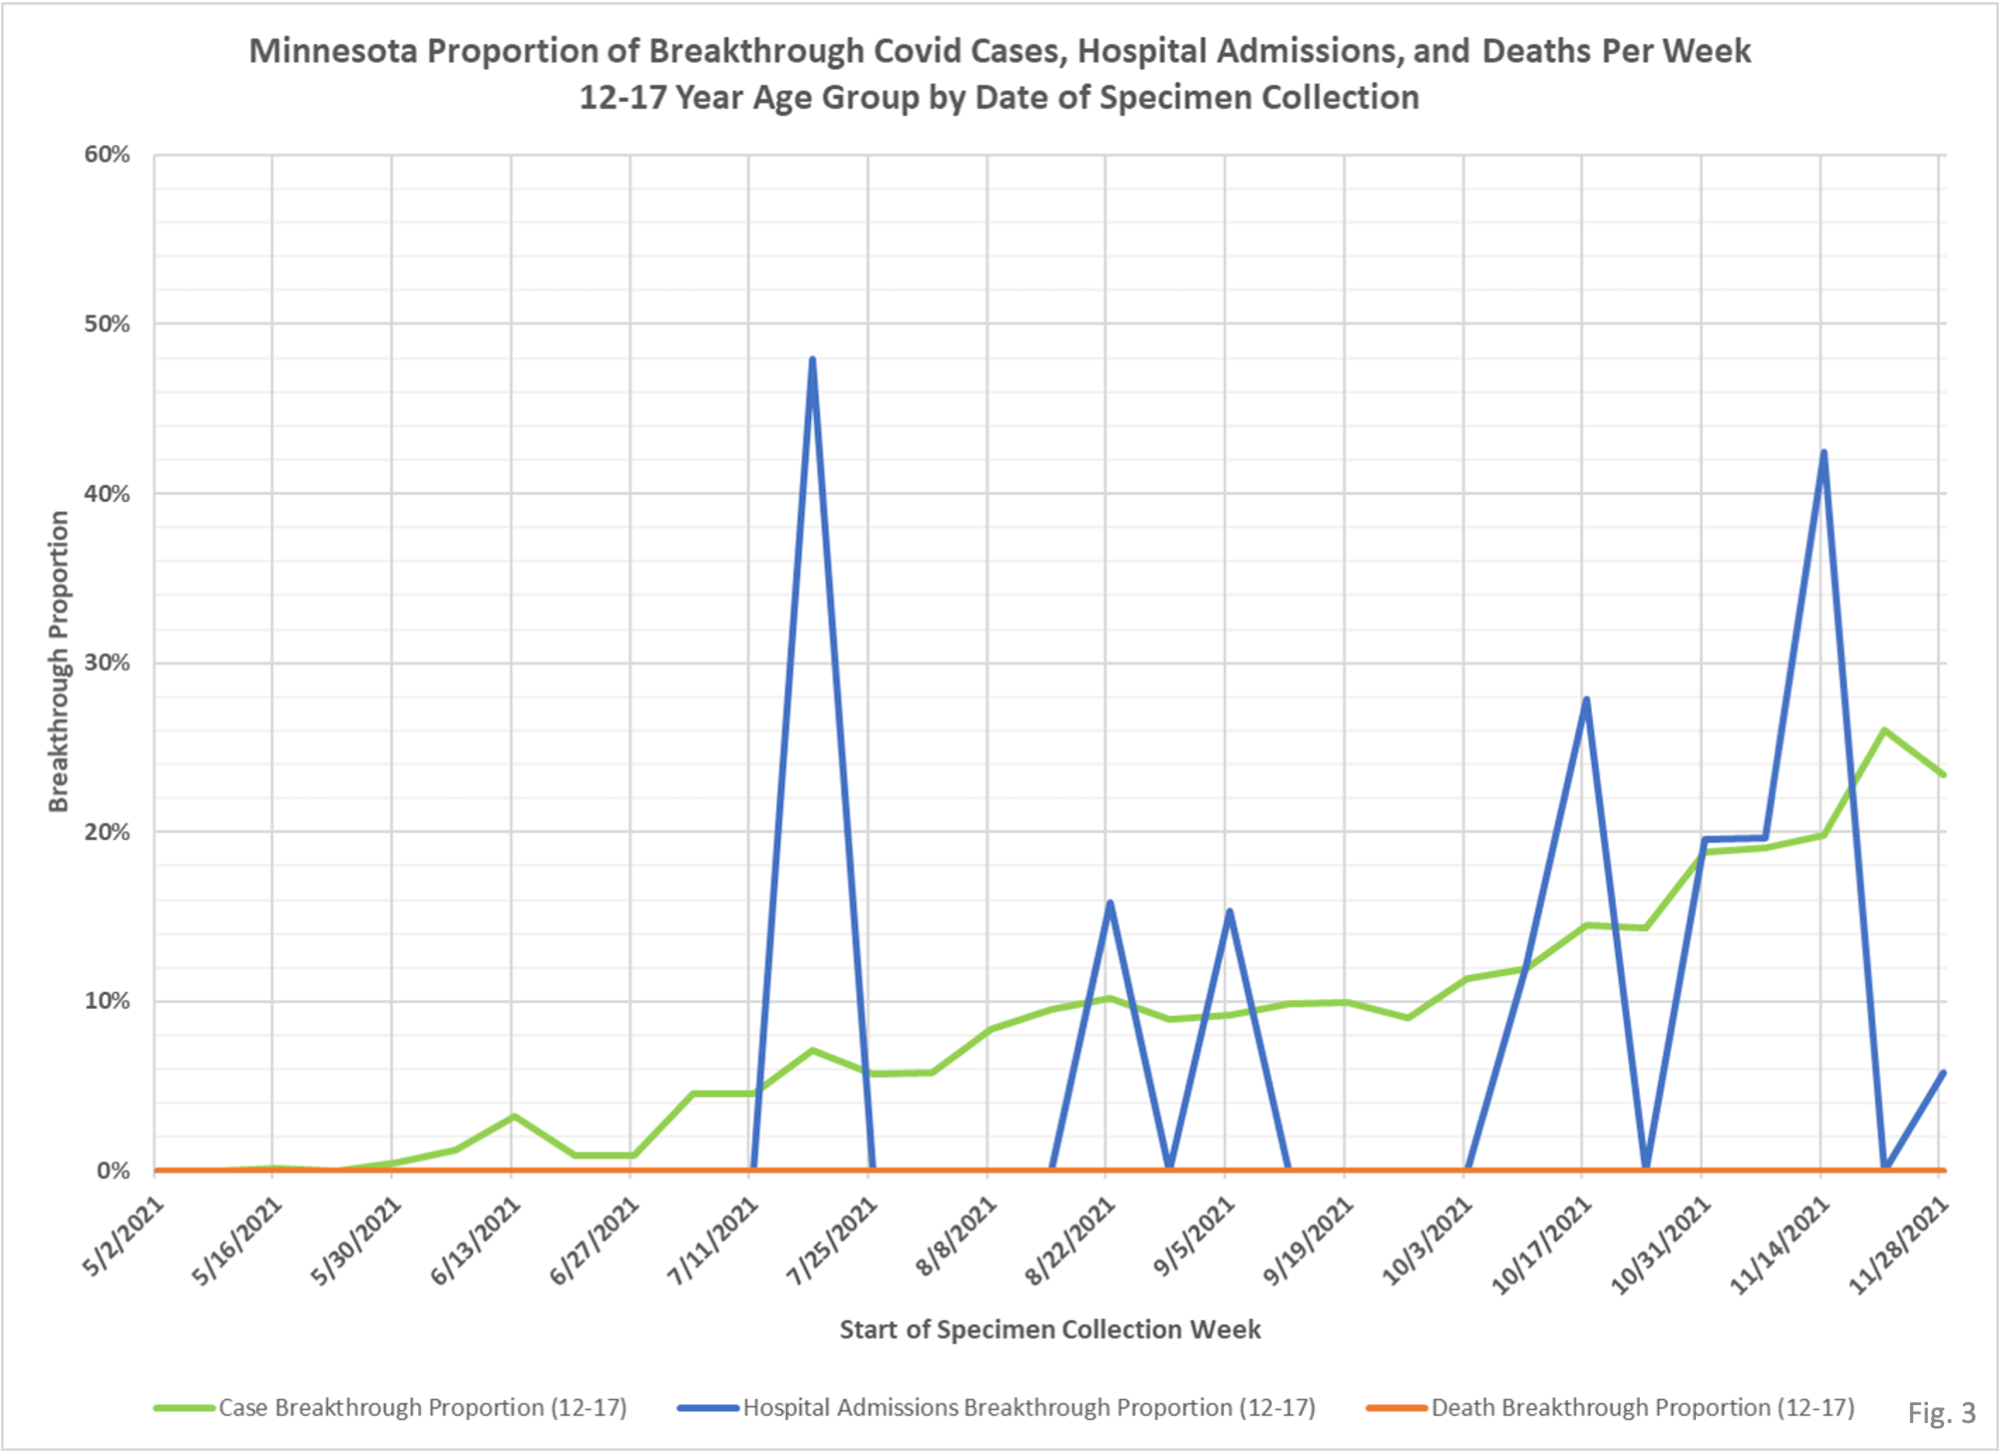
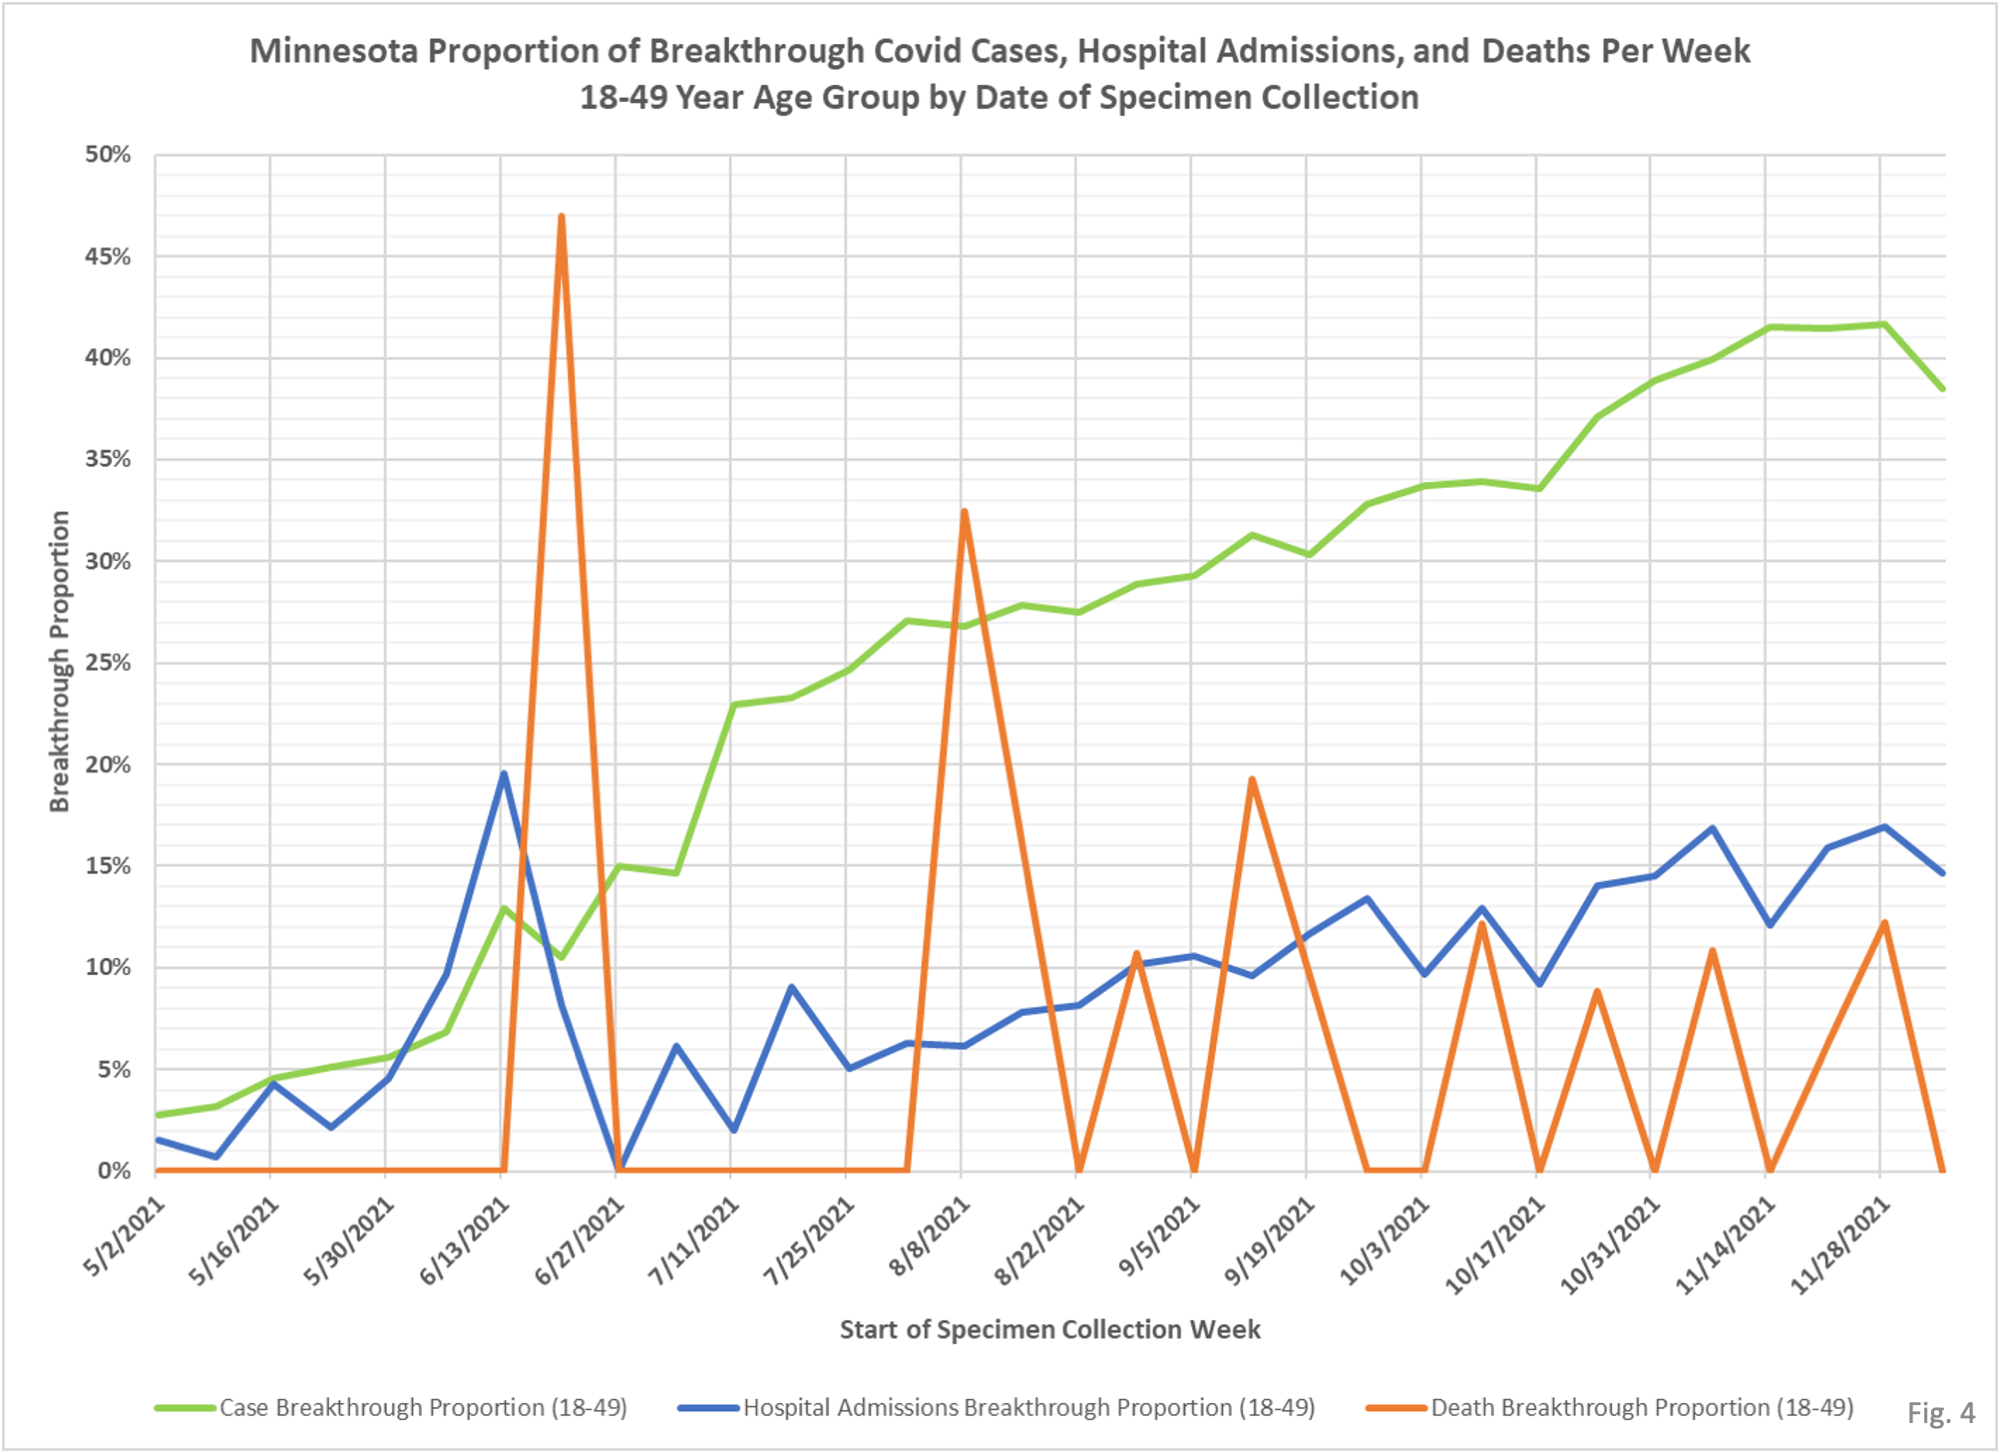
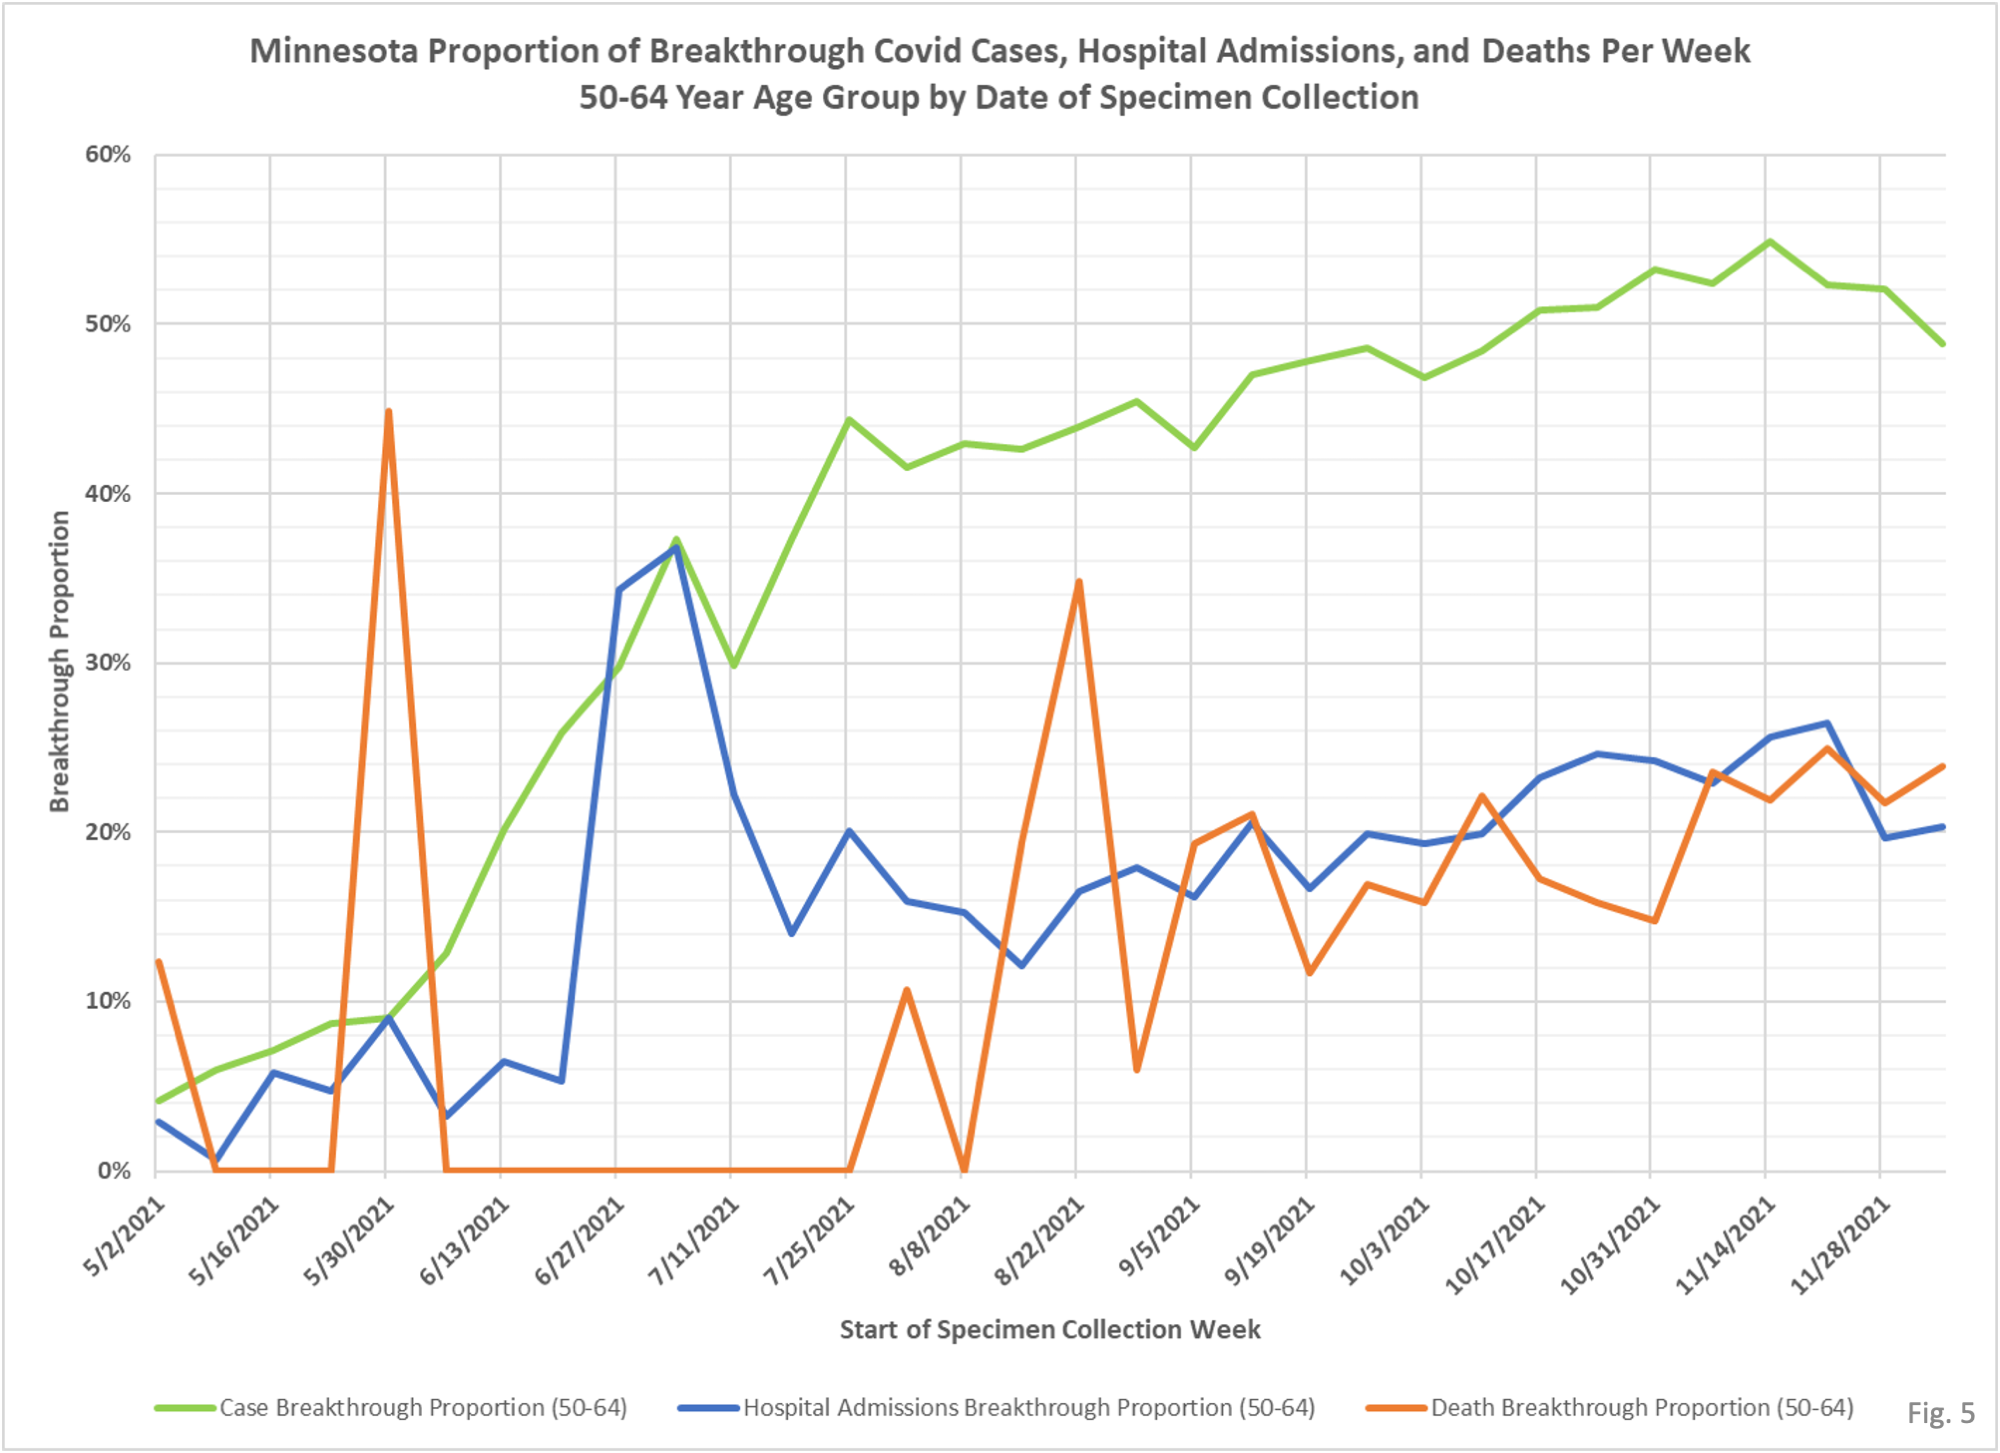
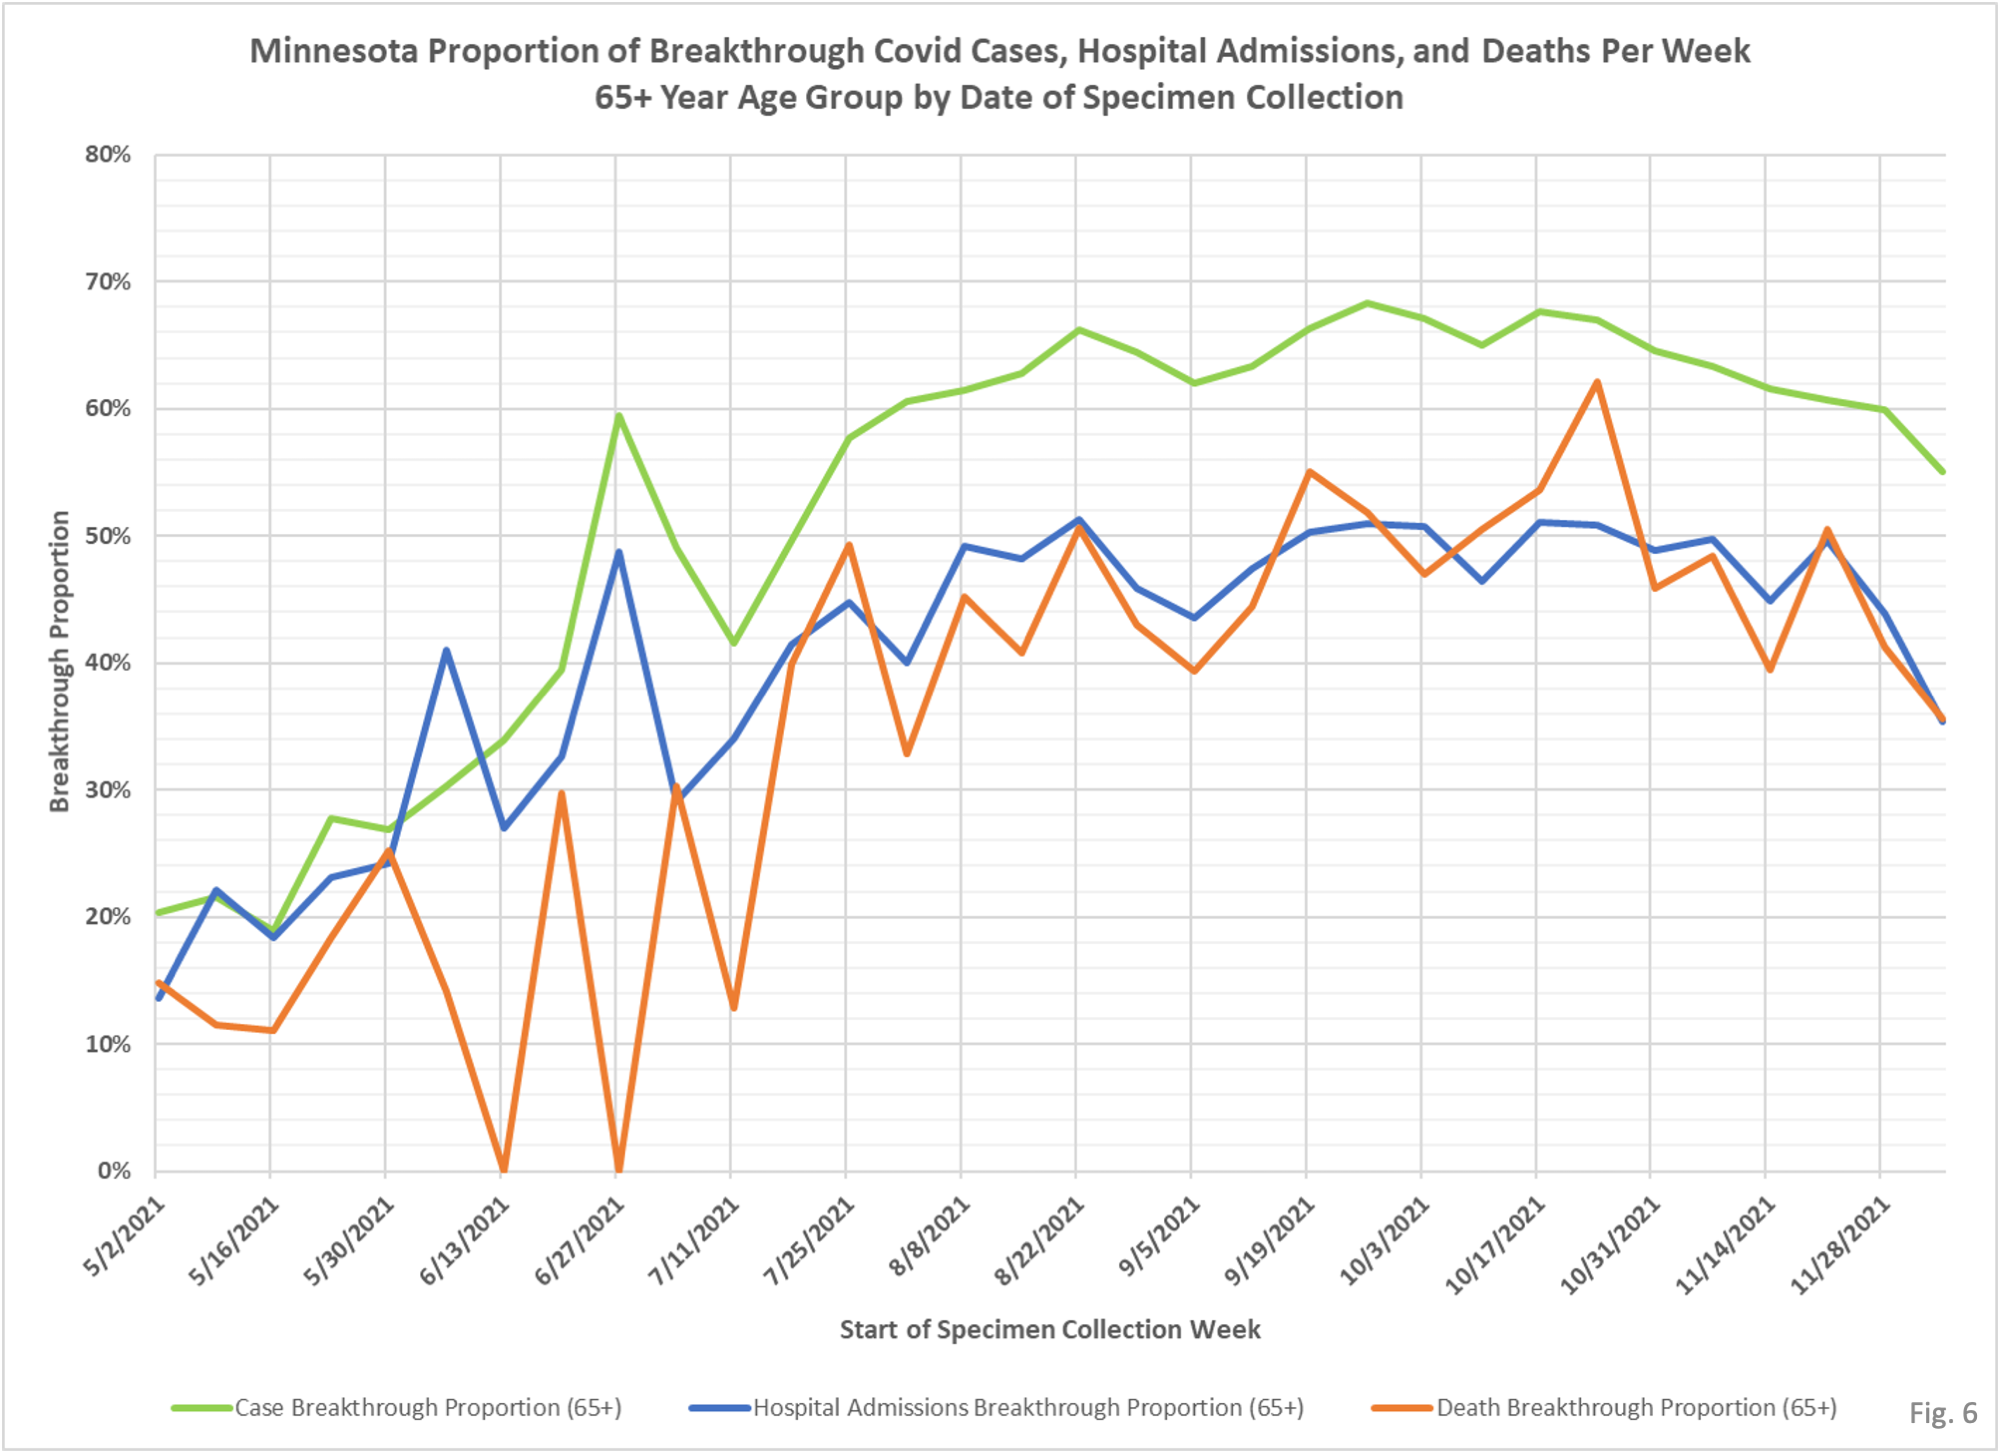
3. The data source for the breakthrough proportions by age group (Fig. 3 through Fig. 6) is the data file vbtcirates.xlsx, found on the Minnesota Department of Health (MDH) web page: https://www.health.state.mn.us/diseases/coronavirus/stats/vbtcirates.xlsx . This data file gives the rates per 100k of cases, hospitalizations, and deaths in full vaccinated and not fully vaccinated people, broken out by age group.
4. The rates per 100k in vbtcirates.xlsx are converted into cases, hospitalizations, and deaths by multiplying by the appropriate population. The number of vaccinated people by age group can found on the Vaccine Data page, https://mn.gov/covid19/vaccine/data/index.jsp , in the data file People Vaccinated by Age. The unvaccinated population is found by taking the US Census American Community Survey 5-Year Estimate (Data Table S0101, https://data.census.gov/cedsci/table) and subtracting the vaccinated population. The breakthrough proportion is then found by dividing the breakthrough events by the total of the breakthrough and non-breakthrough weekly events.
5. MDH defines a breakthrough event as a Covid case, hospital admission, or death that occurs 14 or more days after completing the vaccination shots (not including boosters).
6. Fig. 1 and 2, Overall Breakthrough Proportions: All categories of cases, hospital admissions, and deaths were reduced for the week starting 12/5/2021. In addition, the breakthrough proportion of cases, hospitalizations, and deaths was somewhat lower than for the prior several weeks.
7. Fig. 3 through 6: Breakthrough Proportions by Age Group: The breakthrough proportions by age charts follow the same general trend as seen for the overall chart, Fig. 1. Of note, the breakthrough proportion of cases for the 65+ age group (Fig. 6) has fallen below 60% for the first time since 7/25/2021. Hospital admissions and deaths for the 65+ have similarly fallen to levels not seen since July, 2021.

In terms of the weekly analysis table. Just looking at the Sept data thru 12/5. Assuming the fully vaccinated percentage in MN = 67%…….I would guess vaccination gives maybe 60-70% protection from hospitalizations and a similar, possibly higher, percentage protection from deaths. Not too bad. However in this period delta is likely decreasing and, recently, omicron displacing it. Since boosters have neither the delta or omicron sequence base, it seem problematic whether they offer any benefit, especially since omicron is so much less lethal and mainly asymptomatic. Most people are being boosted just before the period of omicron displacing delta, so the benefit is uncertain. I like watching: https://www.youtube.com/c/Campbellteaching/videos
There are so many moving parts involved in any analysis of the Covid data.
What do you think of comorbidity in terms of actual (realistic) numbers of Covid deaths. Instead on 800,000+ in US….do you think it’s more like 200,000/yr for 2020 and 2021?
The number of CDC “excess deaths” for 2020 and 2021 is about +400,000/yr max, so just about all of them would need to be CV-specific to make the CV death count add up.
It would be charitable to the CDC data to posit that the tally of total CV US deaths to this point (Mach 2020 on) are more than 400,000….closer to Dr. Birx’s guess of 200,000 she made in April-May 2020. Maybe delta whacked us for an additional 100,000 in 2021 even in the face of vaccination.
You think?