Another update on this year-over-year look. Omicron and absurd testing levels will soon show up. So far, other than incidental hosps, serious illness and death looks like it is declining. But DOH data processing is so bad, who knows. By the way, I pay no attention to positivity rates, and one additional reason not to is that lots of people do home tests and if they are negative we never hear about it, and sometimes if they are positive. But most positives from home tests go get confirmed at official testing sites and that shows up in the positive numbers. Skews the “official” positive rate very high. Dave’s notes:
1. For all charts the last 7 days of data is excluded to avoid charting incomplete data. Deaths reporting however is likely to be incomplete. All data is taken from the Minnesota Department of Health Situation Update for OCVID-19 web page https://www.health.state.mn.us/diseases/coronavirus/situation.html and from the Response and Preparation web page https://mn.gov/covid19/data/response-prep/response-capacity.jsp.
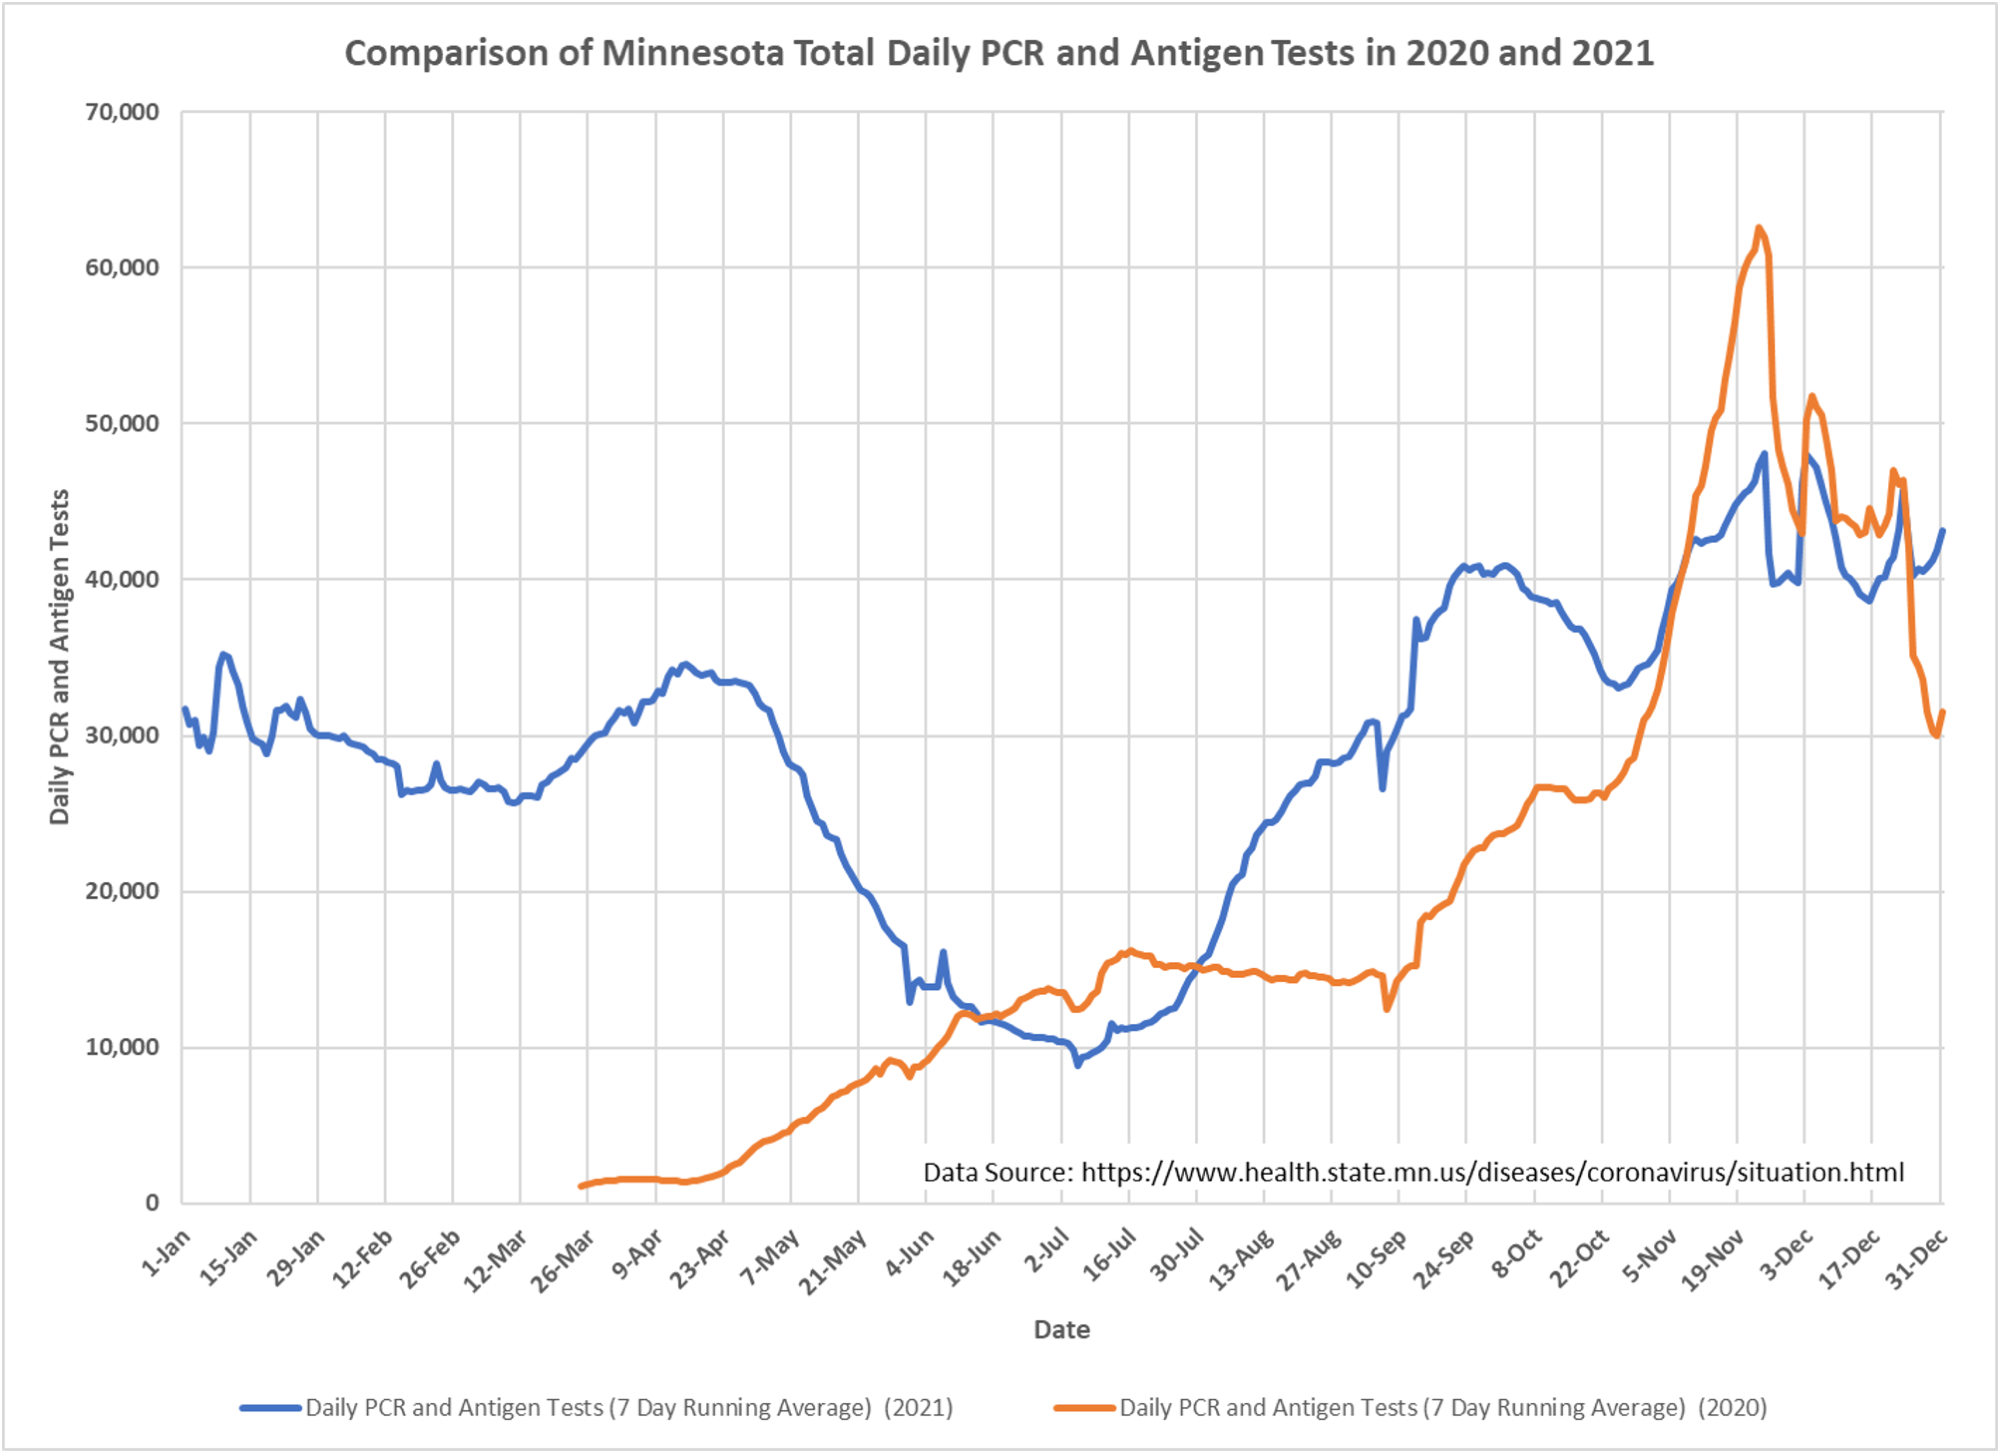
2. Slide 1: Tests per day, after seasonal disruptions similar to last year, increased again through Dec. 30, the last day plotted.
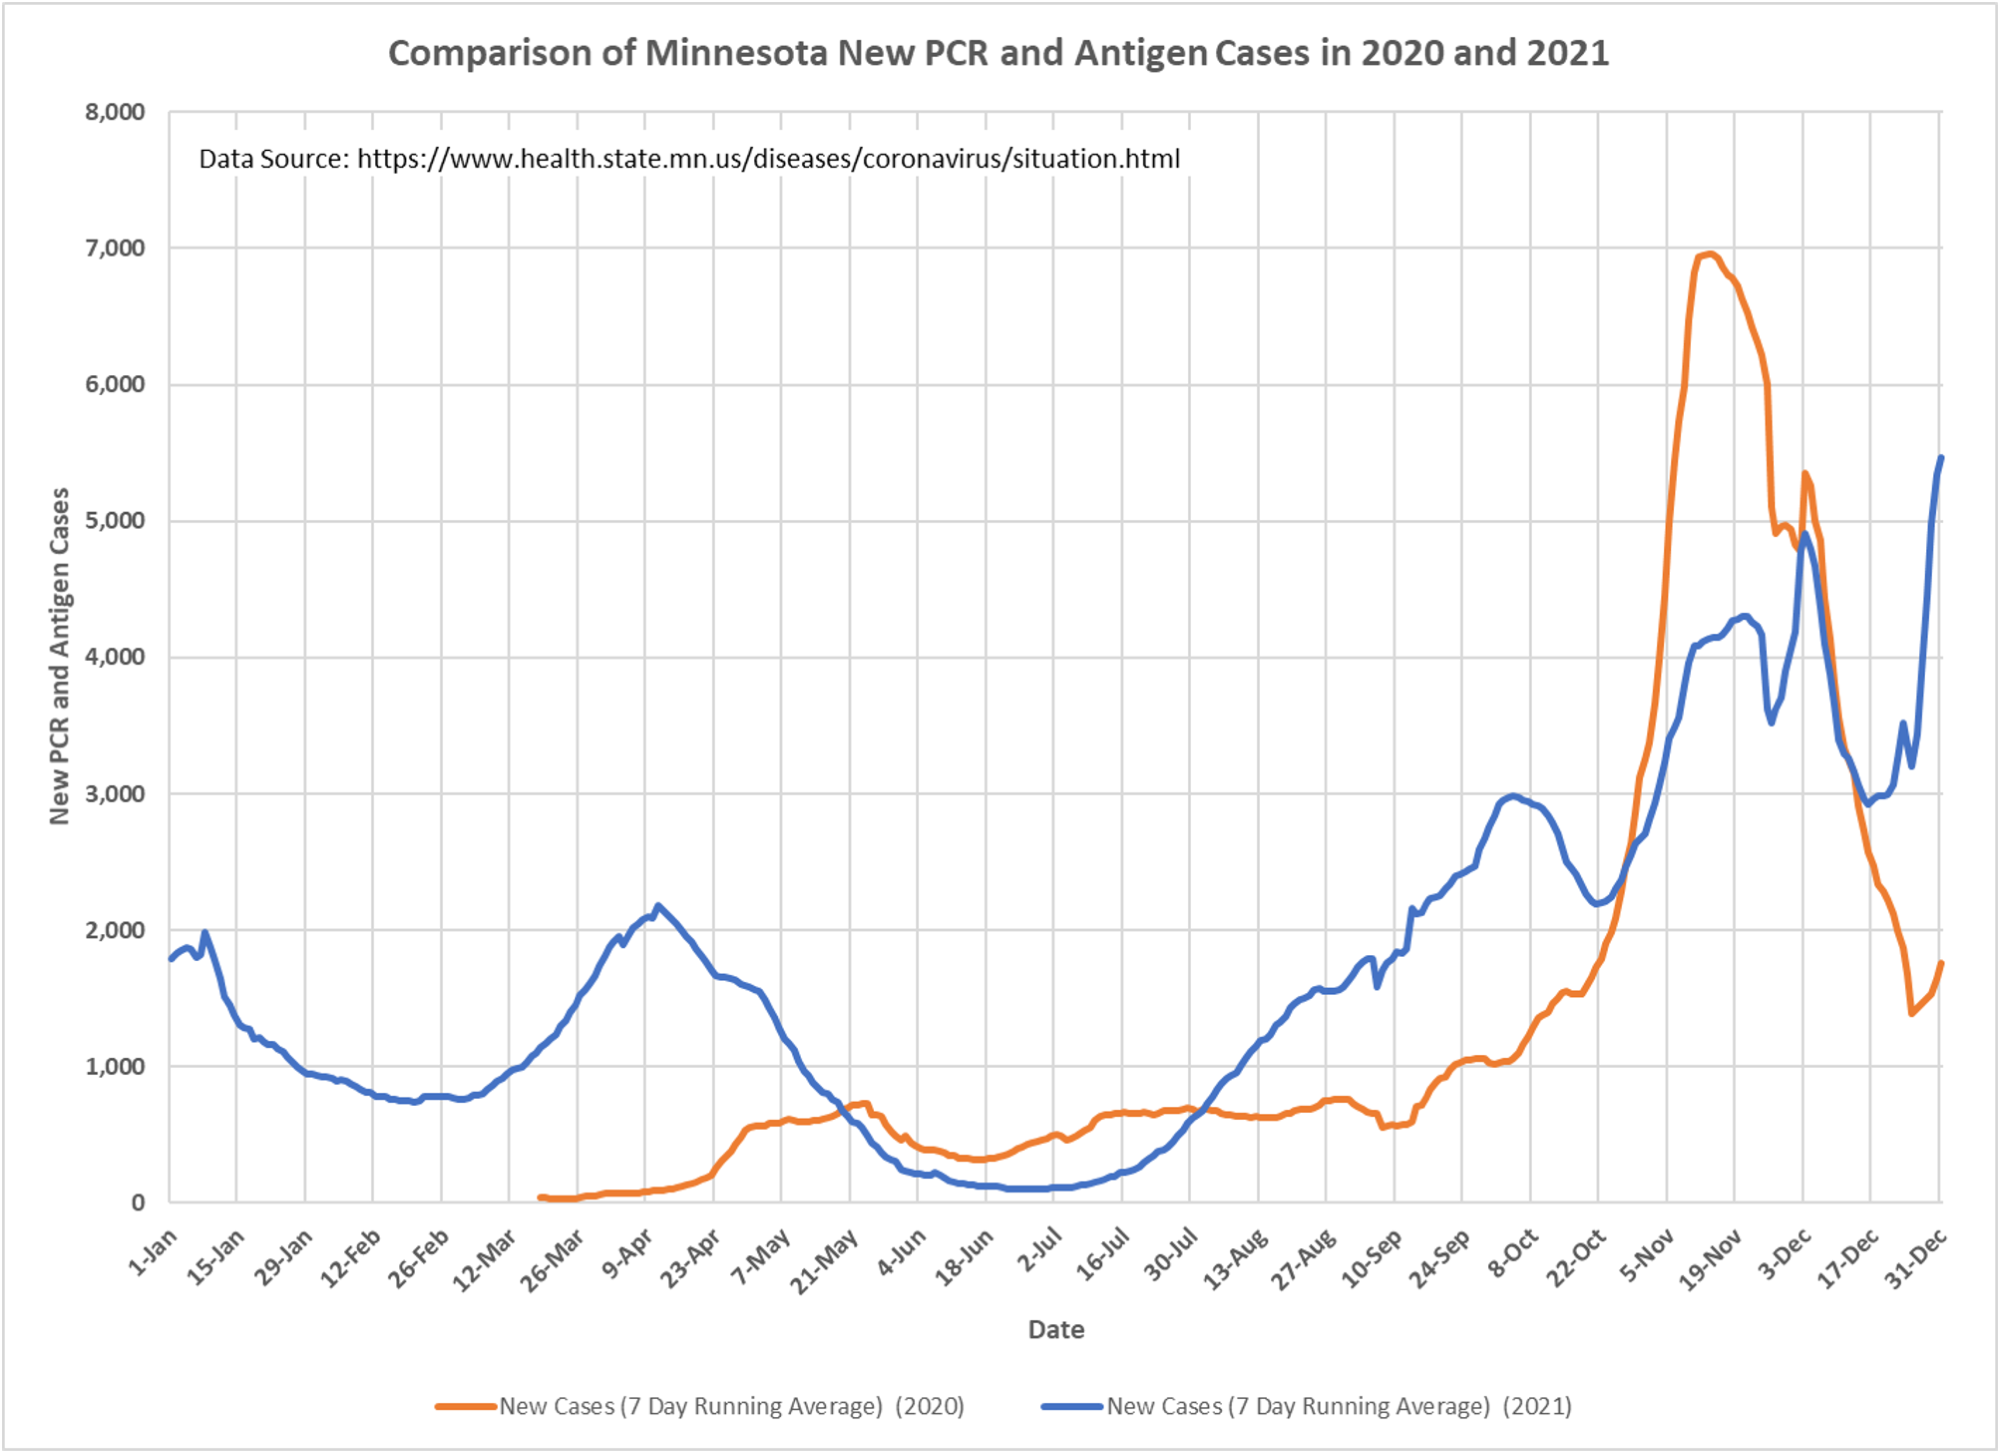
3. Slide 2: New daily cases, after reaching a recent low point on 12/16/2021 at 2,918 cases per day, have now risen to a 7 day moving average of 5,467 cases per day. Although there is the faintest hint of levelling off at the end of the curve, it is likely that test reporting delays around the holidays may be impacting the published results. It will take another week before we know that the backlog of tests is accounted for.
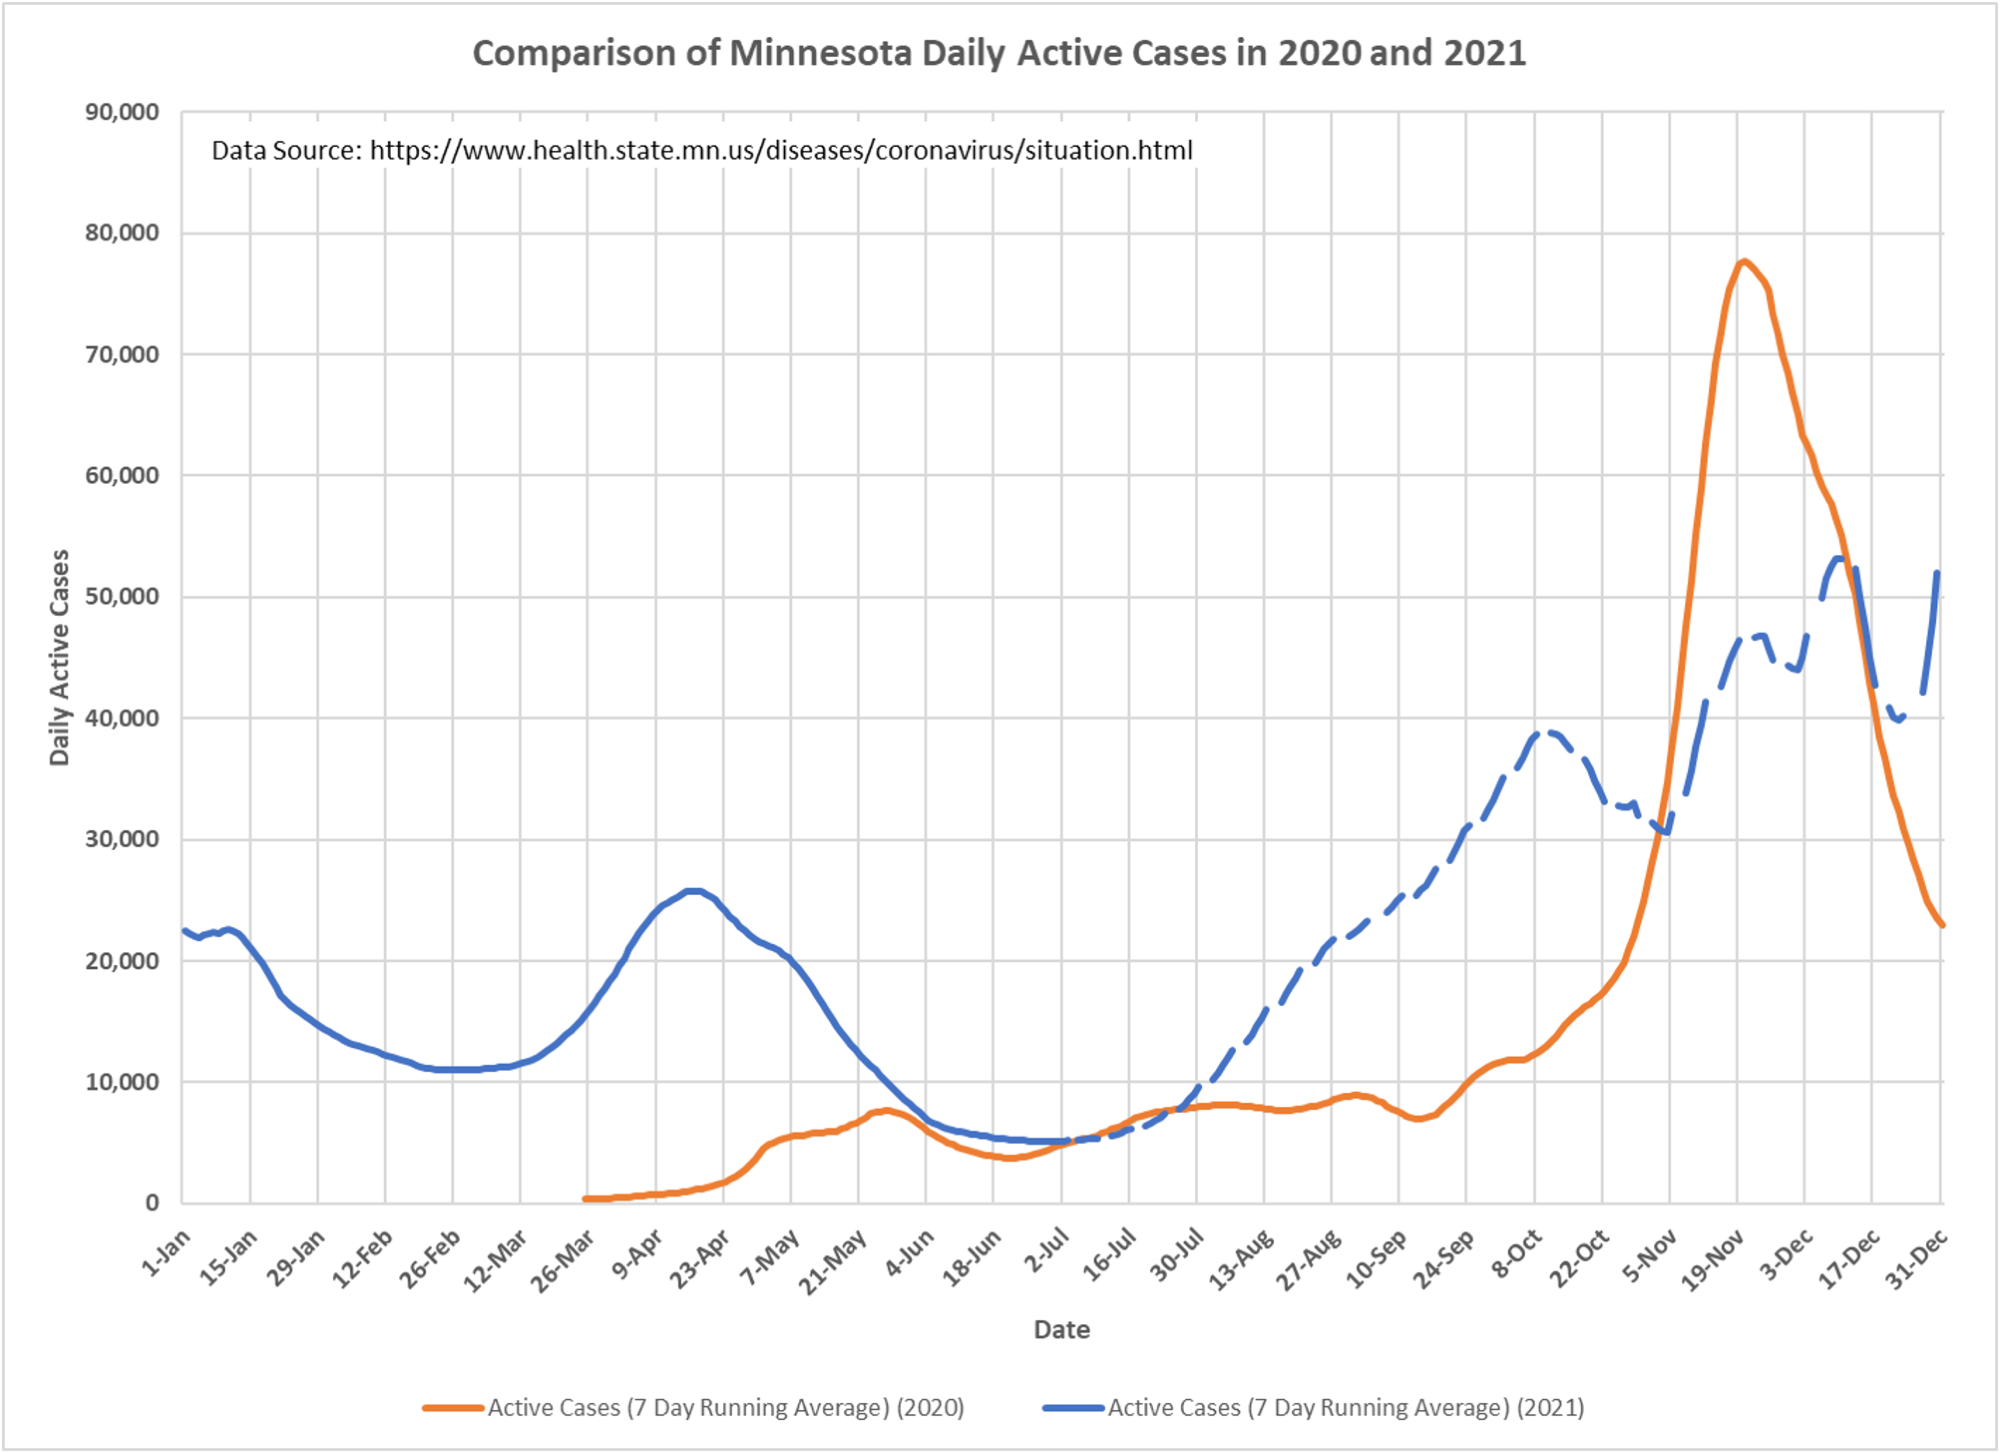
4. Slide 3: Active cases largely mirrors the new daily cases curve, with a lag for the period in which a person is considered infectious. As far as we know MDH continues to use a nominal 10-day infectious period for reporting patients No Longer Needing Isolation, which forms the basis of the active case calculation.
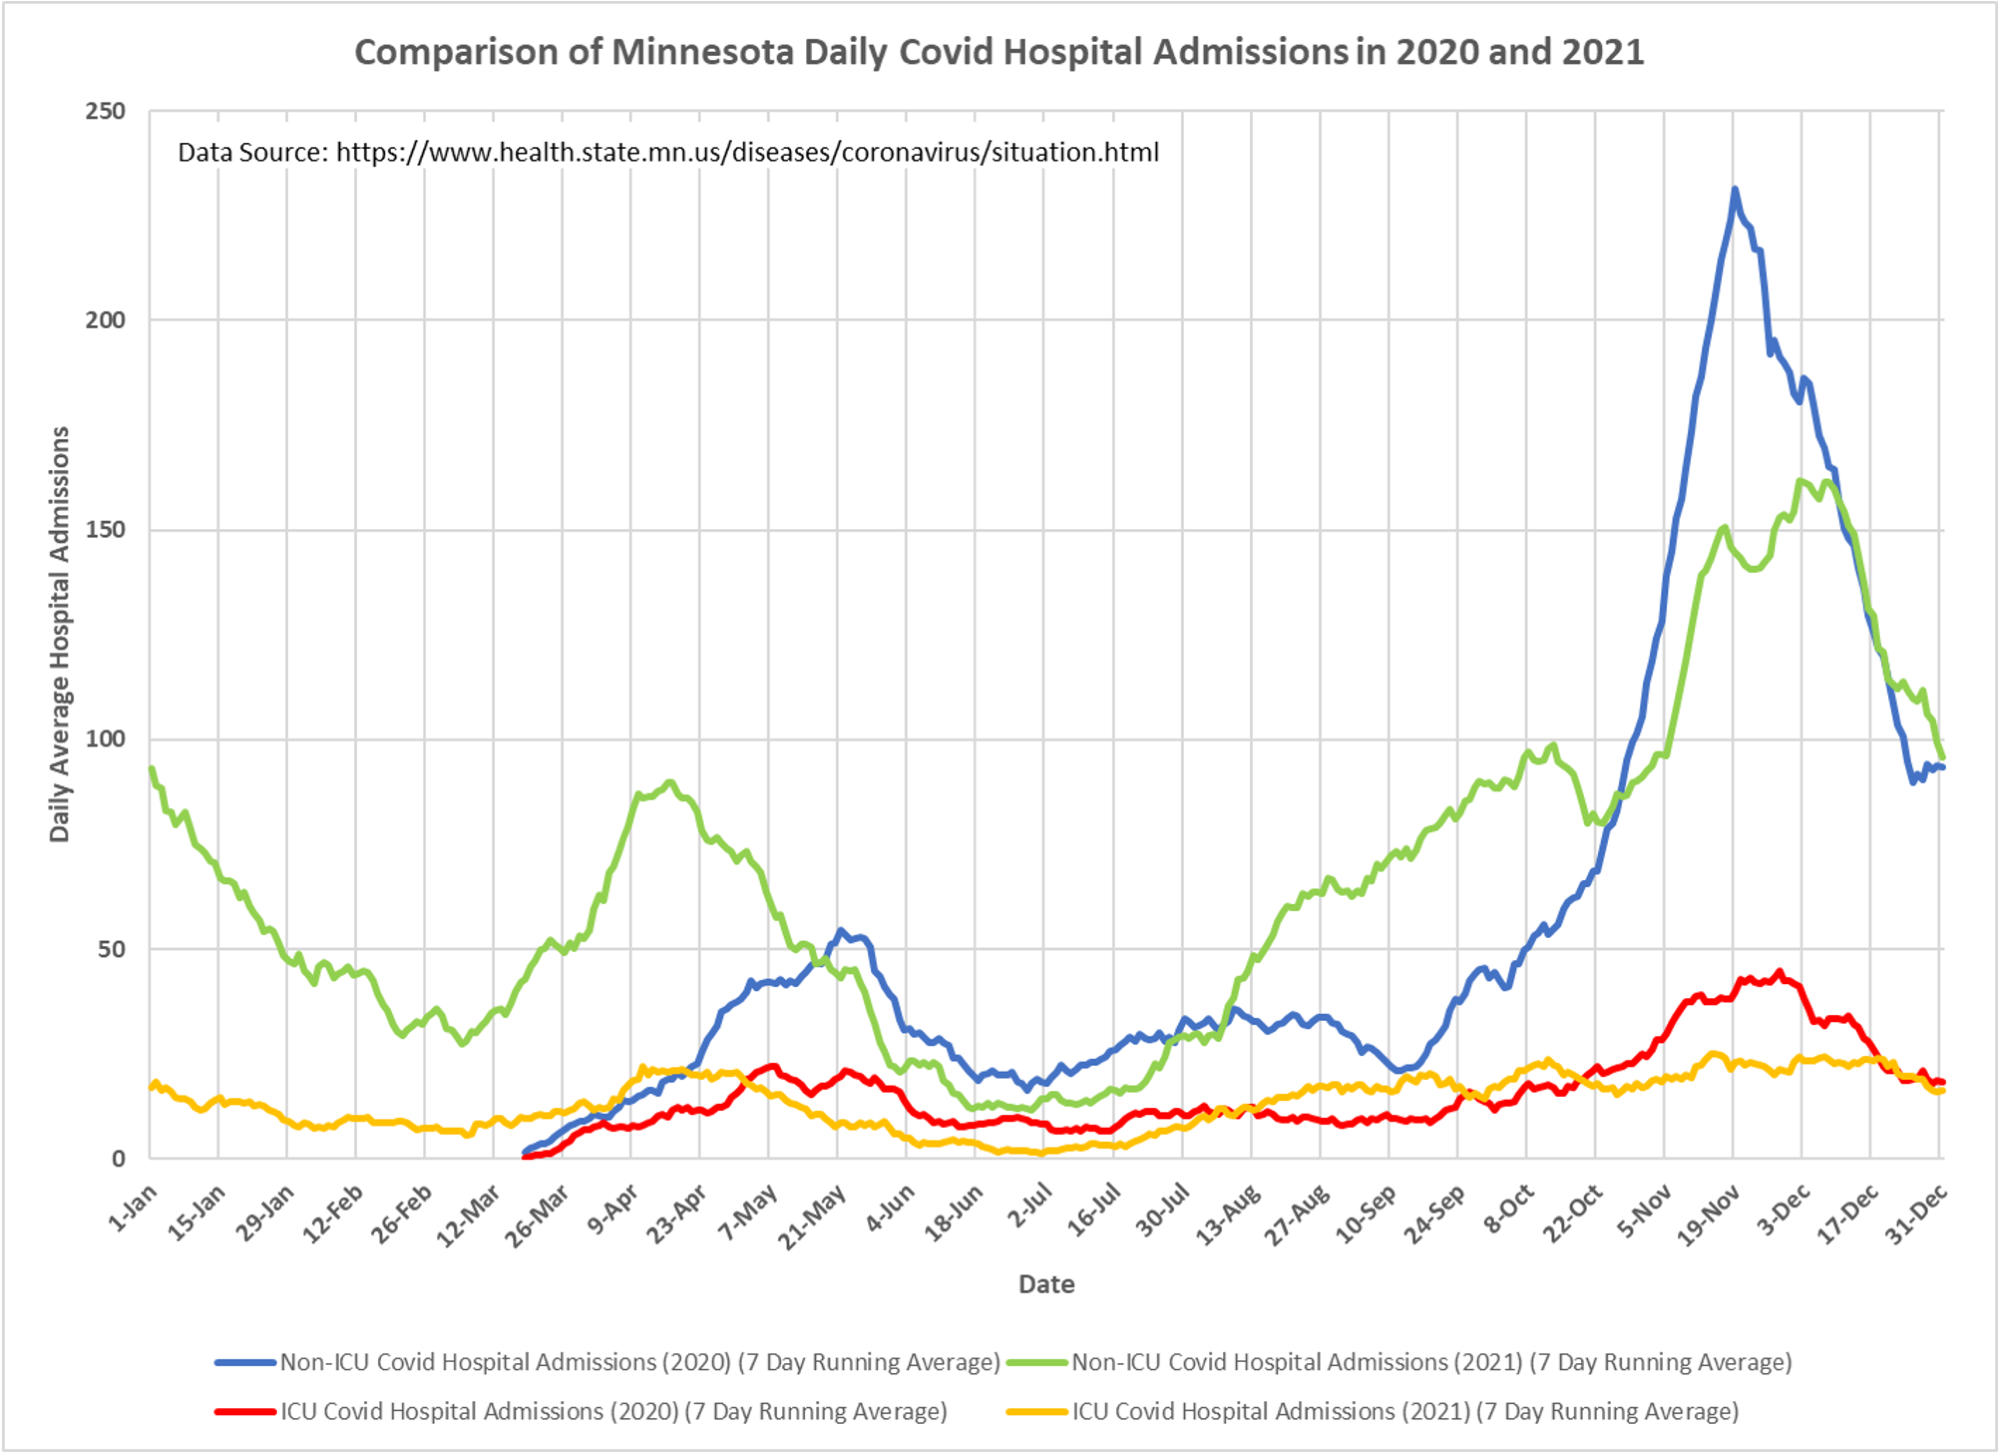
5. Slide 4: Non-ICU admissions per day are still declining sharply, despite the rise in daily cases. This is good news if the decline in admissions is due to Omicron reportedly being the dominant strain. ICU admissions are declining, but at a much more gradual rate.
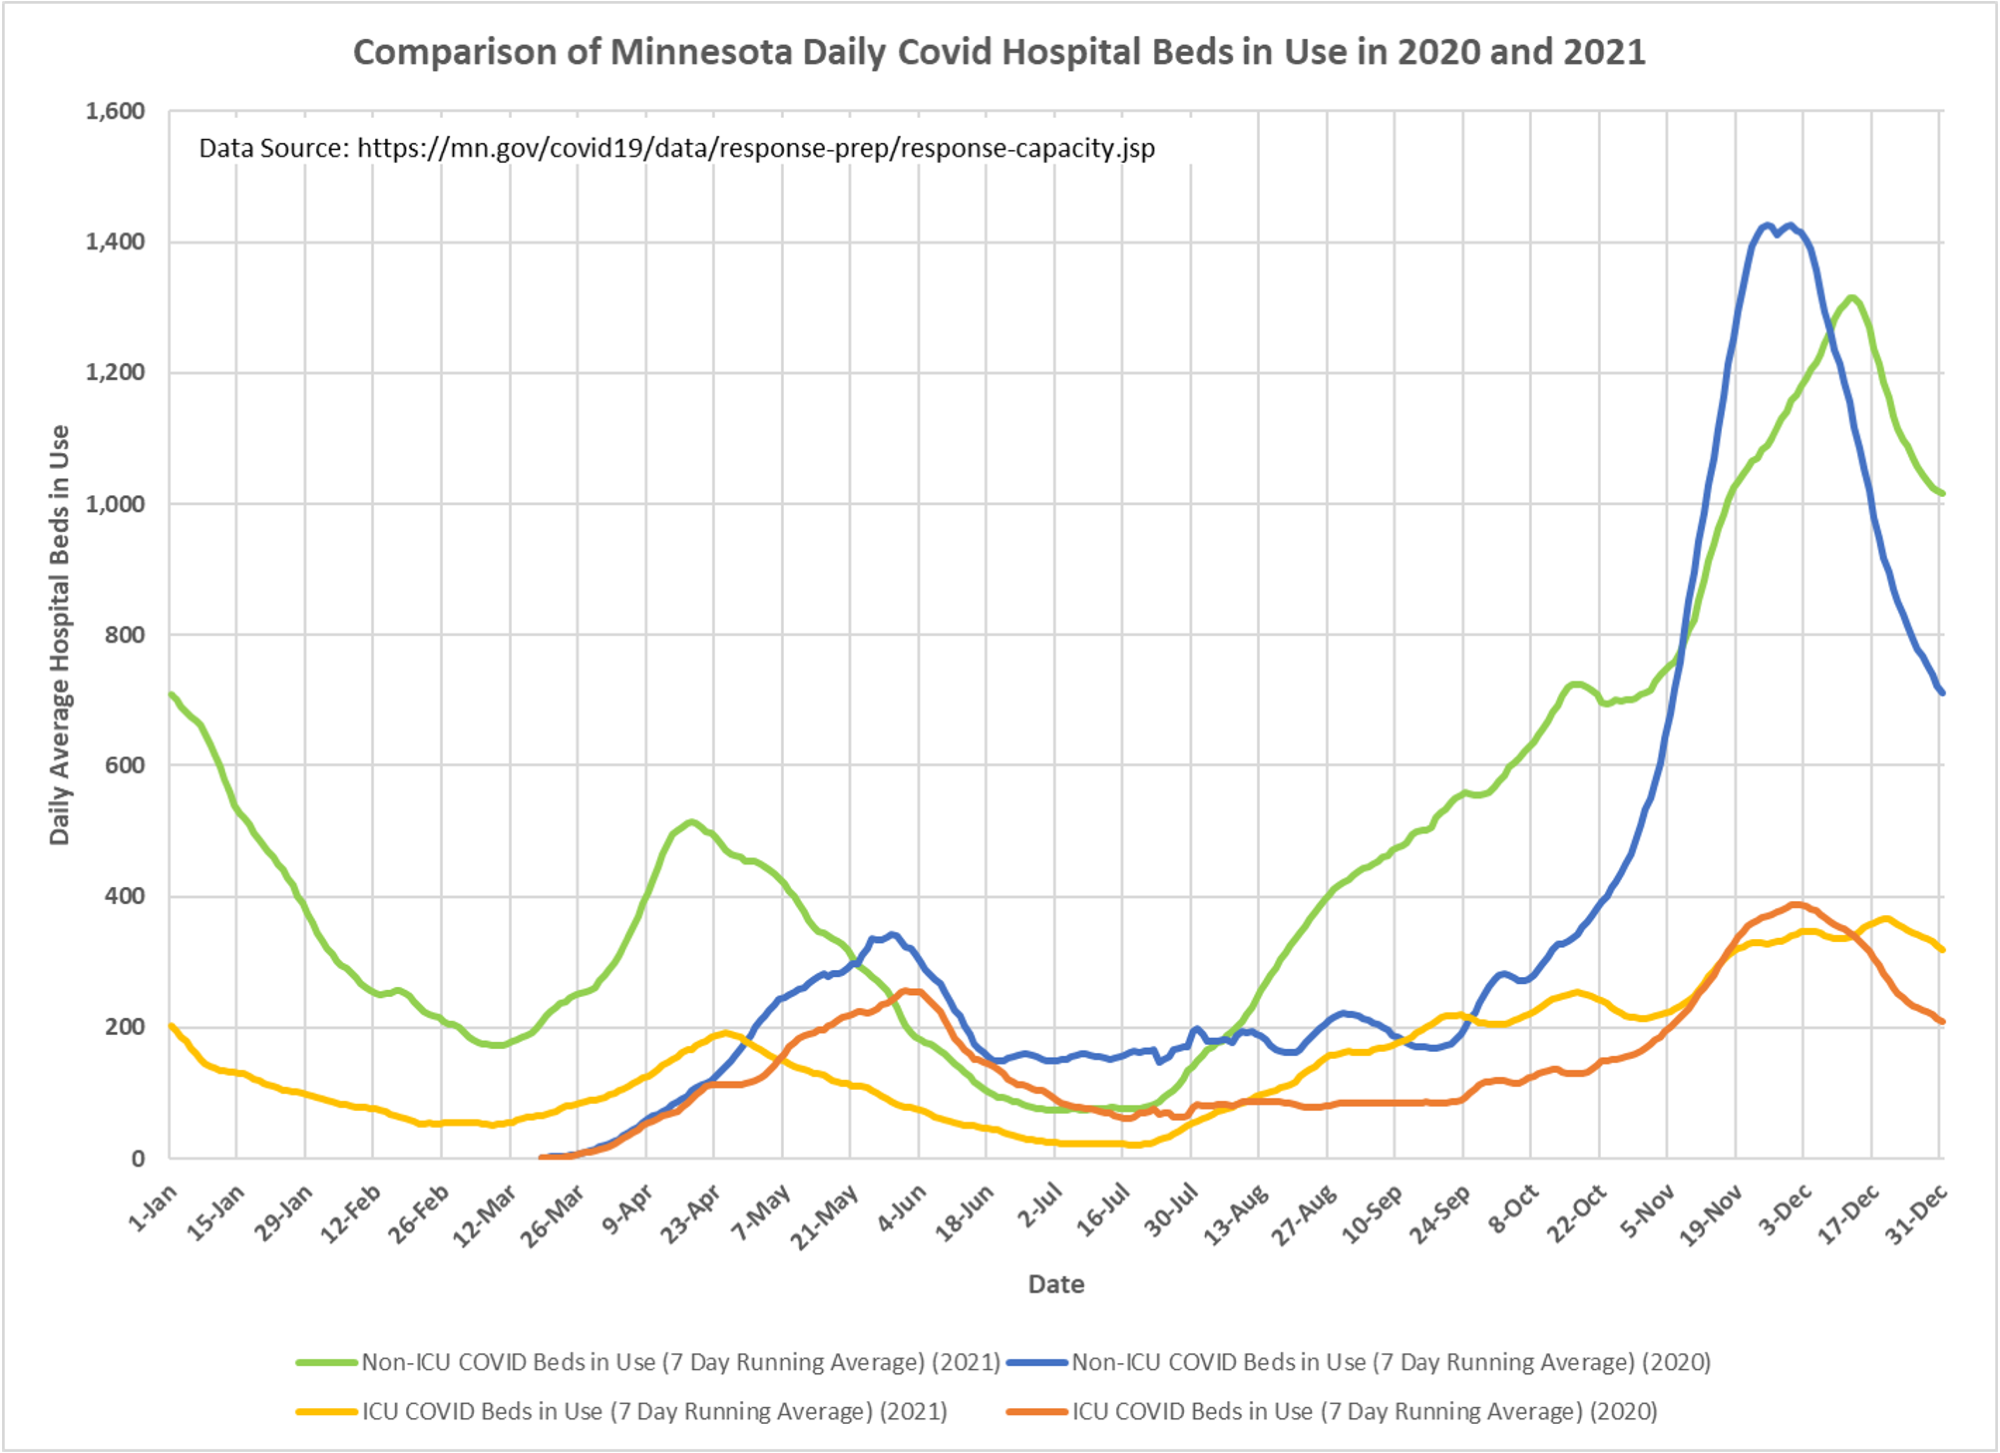
6. Slide 5: Non-ICU Covid hospital beds in use continue to drop sharply. ICU Covid beds in use are also declining, but again more gradually.
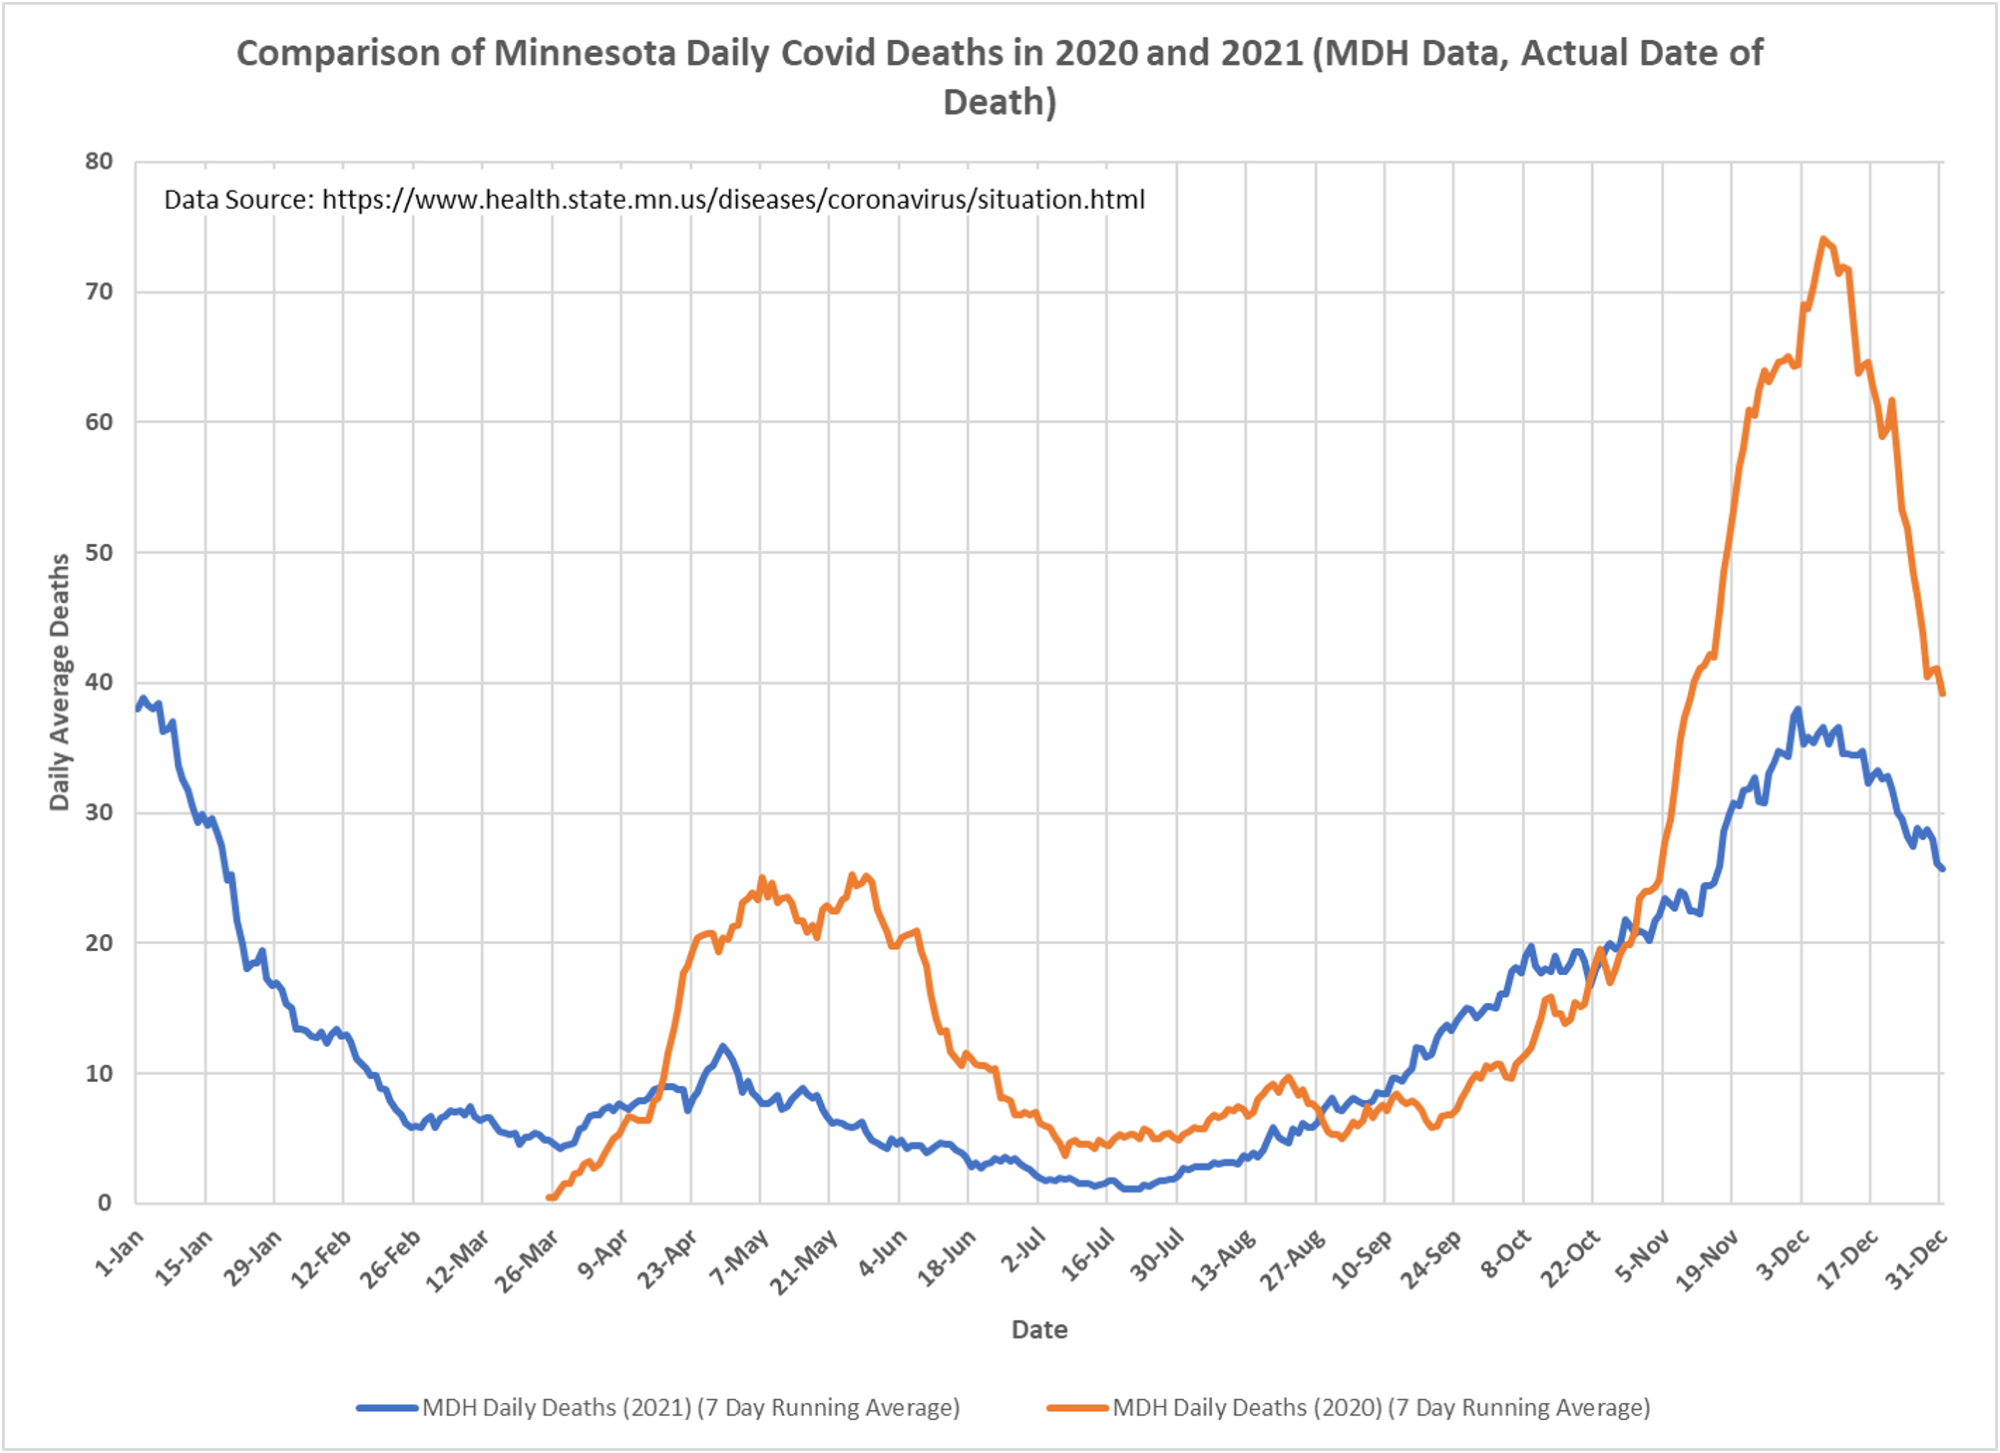
7. Slide 6: Deaths per day attributed to Covid are also declining, but more gradually than from last year’s peak. Perhaps the slow decline in ICU Covid beds in use is contributing to the slow decline in Covid deaths.