Soon we will hear more gnashing of teeth around CV hospitalizations. You won’t be told that a) hospital capacity has dropped because of vaccine mandates, which was completely predictable; b) a huge percent of hospitalizations attributed to CV-19 are not for treatment, just incidental positives. Dave’s notes:
1. MDH publishes capacity and utilization information in 2 data files on the Response Capacity web page. TeleTracking, published here: https://mn.gov/covid19/assets/TELETRACKING_ICU_NonICU_Beds_in_Use_CSV_tcm1148-455097.csv, contains data for hospital beds in use, categorized as Covid or Non-COVID, ICU or Non-ICU, and by Minnesota region. This data is used to generate the beds in use charts, Slide 1 and Slide 2).
2. MNTRAC, published here, https://mn.gov/covid19/assets/MNTRAC_ICU_NonICU_BedAvailability_IdentifiedSurge_CSV_tcm1148-455098.csv, contains data for hospital capacity, including adult and pediatric ICU and Non-ICU bed capacity, beds in use, and beds available, among other information. This data is used to generate the hospital beds available (Slide 3), and also the black Total ICU and Non-ICU Capacity line on Fig. 1. The notes for this data file state that the hospital bed capacity is given in terms of staffed beds.
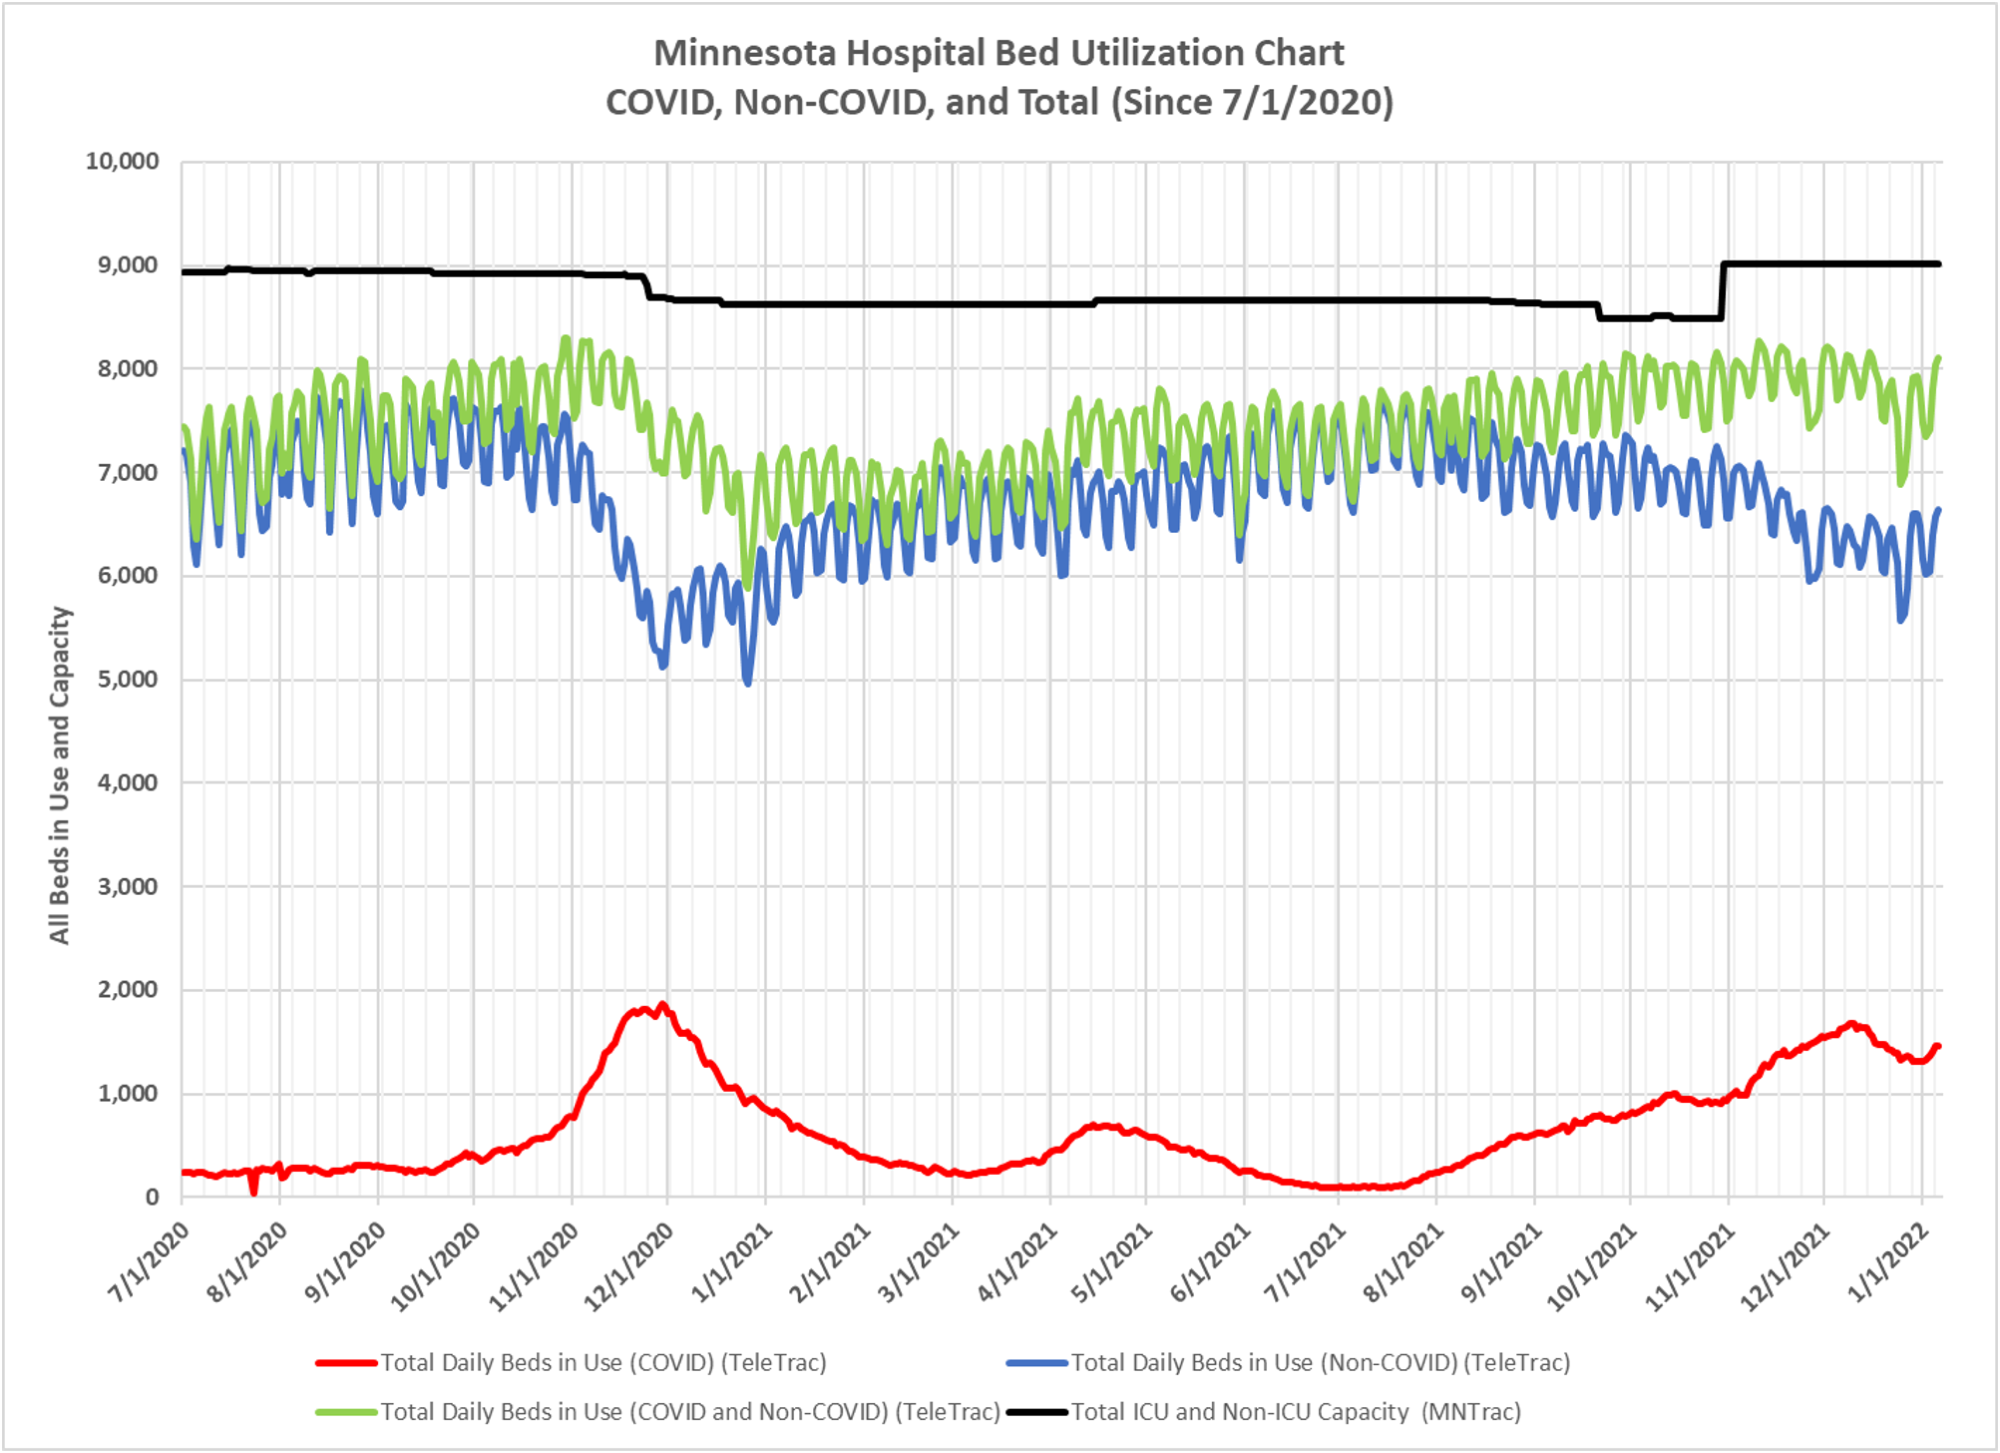
3. Slide 1, Minnesota Hospital Bed Utilization, is an updated version of the chart we have published on this web site many times before. This chart is simply plotting the TelTracking data without modification. The black curve, total hospital bed capacity, is now updated showing the addition of Non-ICU pediatric beds on 11/18/21. Since these beds surely existed prior to 11/18 the increased bed capacity is just a reporting artifact, and not a true increase in capacity.
4. Slide 1 illustrates the total Covid beds in use (red curve), total Non-Covid beds in use (blue curve), and total of all beds in use (green curve). As of 1/06/22, a total of 8,104 hospital beds were in use, and total reported, staffed hospital bed capacity was 9,012 beds, implying an unused capacity of 908 beds.
5. Note also that every time Covid hospitalizations increase, Non-Covid hospitalizations decrease. This effect is probably a combination of decreased ‘elective’ surgeries and because a significant portion of people hospitalized for non-Covid reasons test positive for Covid.
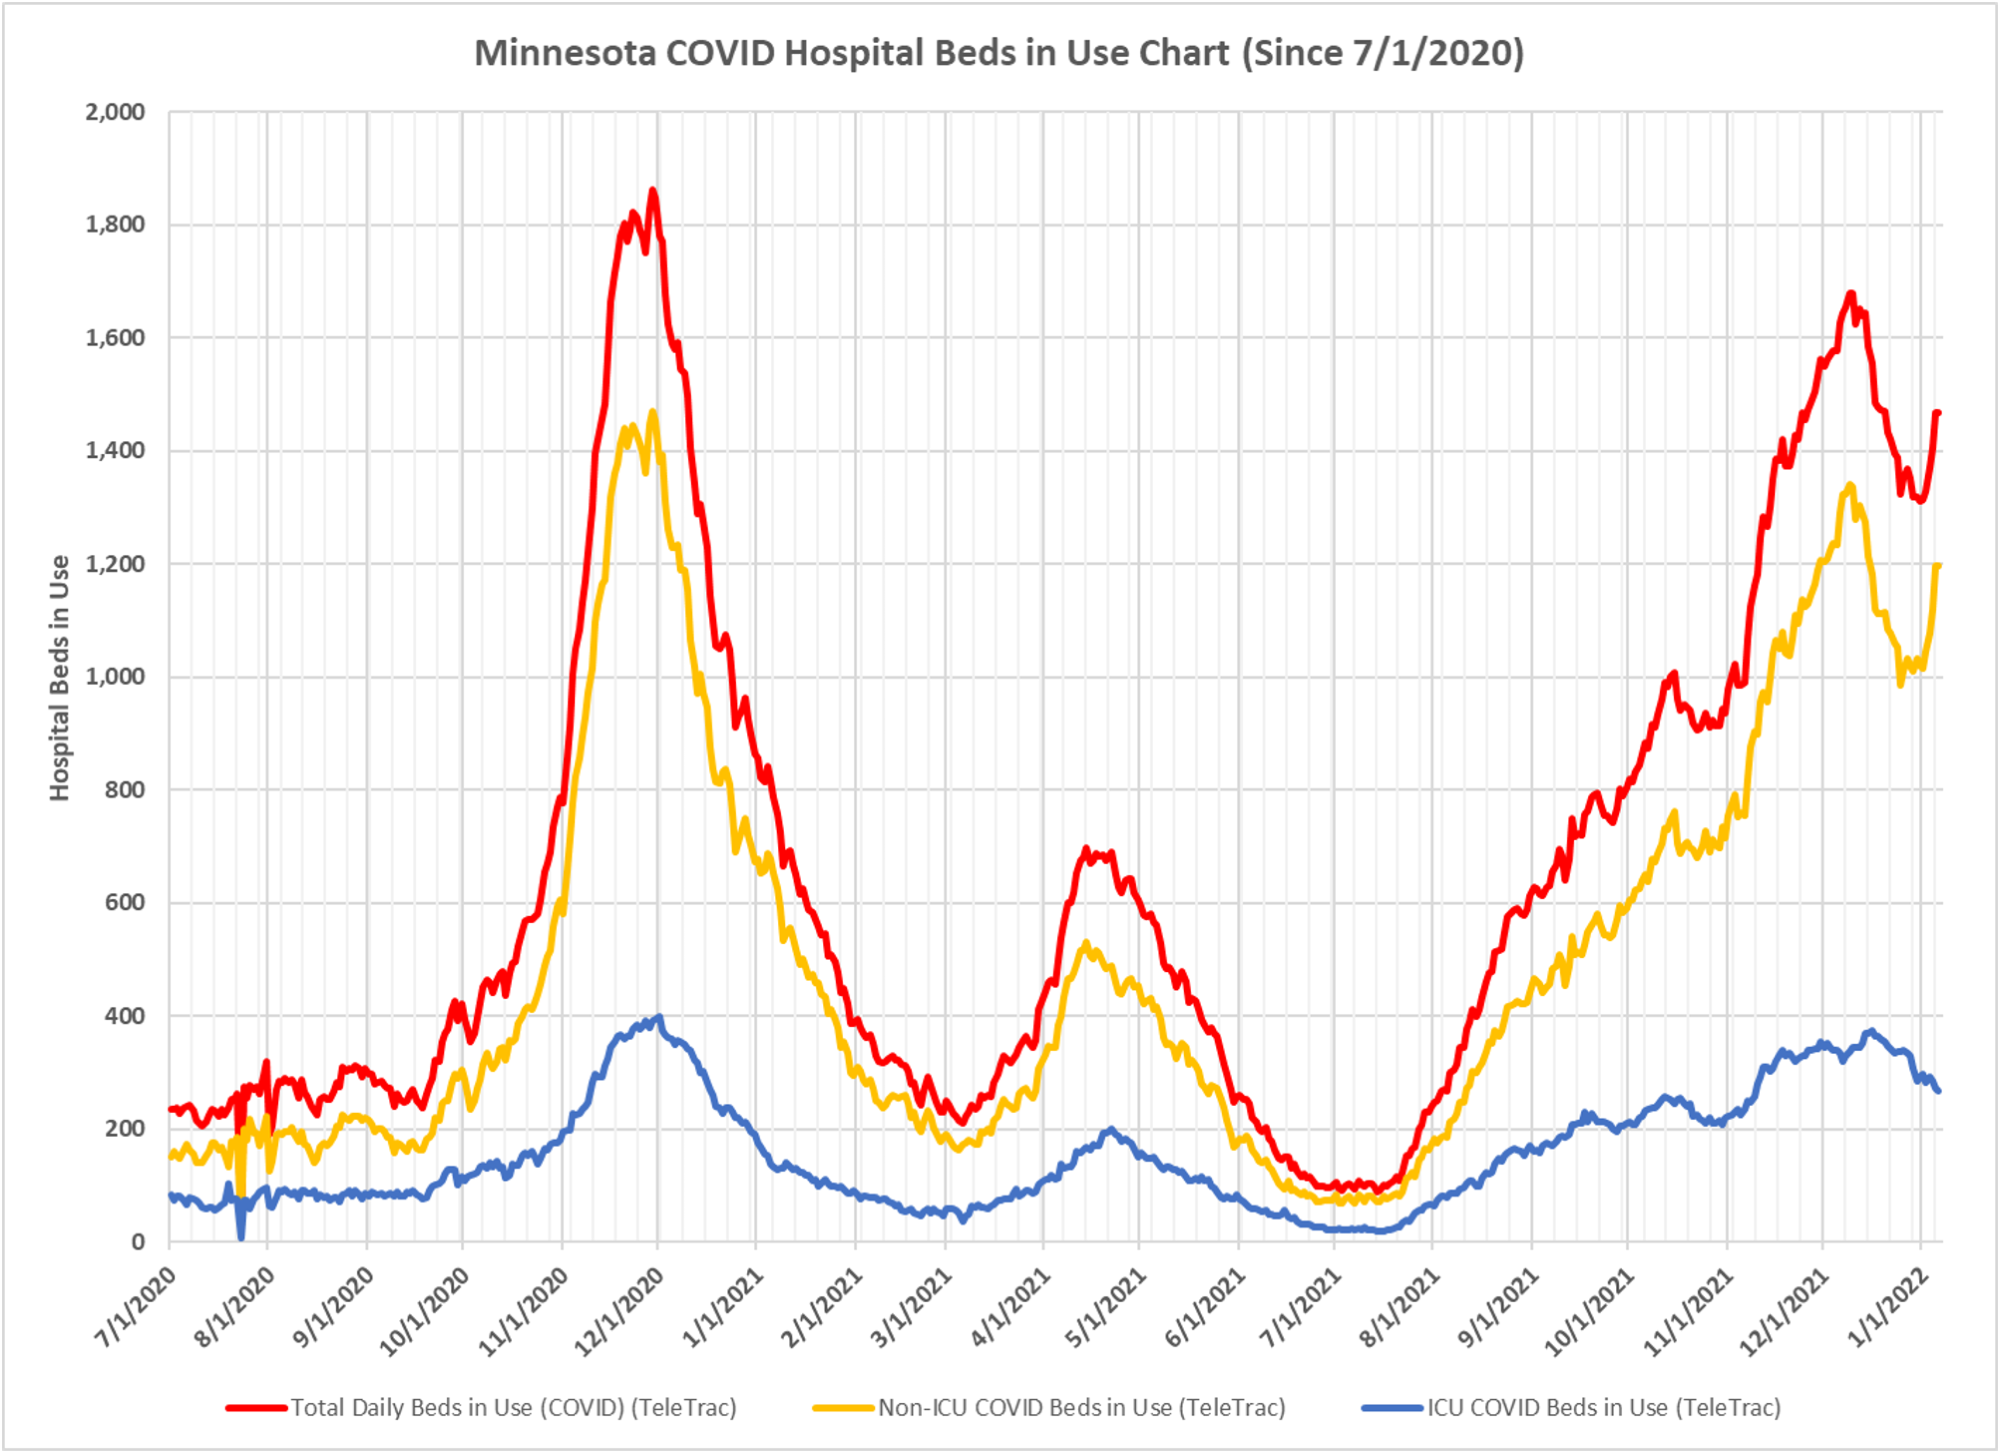
6. Slide 2, Minnesota COVID Hospital Beds in Use, also is a simple plot of data from the TeleTracking data file. We can see that after reaching a low in late December, 2021, Non-ICU Covid beds in use rose dramatically, while ICU Covid beds continue to decline. This data is current up through yesterday; typical charts we publish omit the last 7 days of data and therefore miss this last upturn in beds in use.
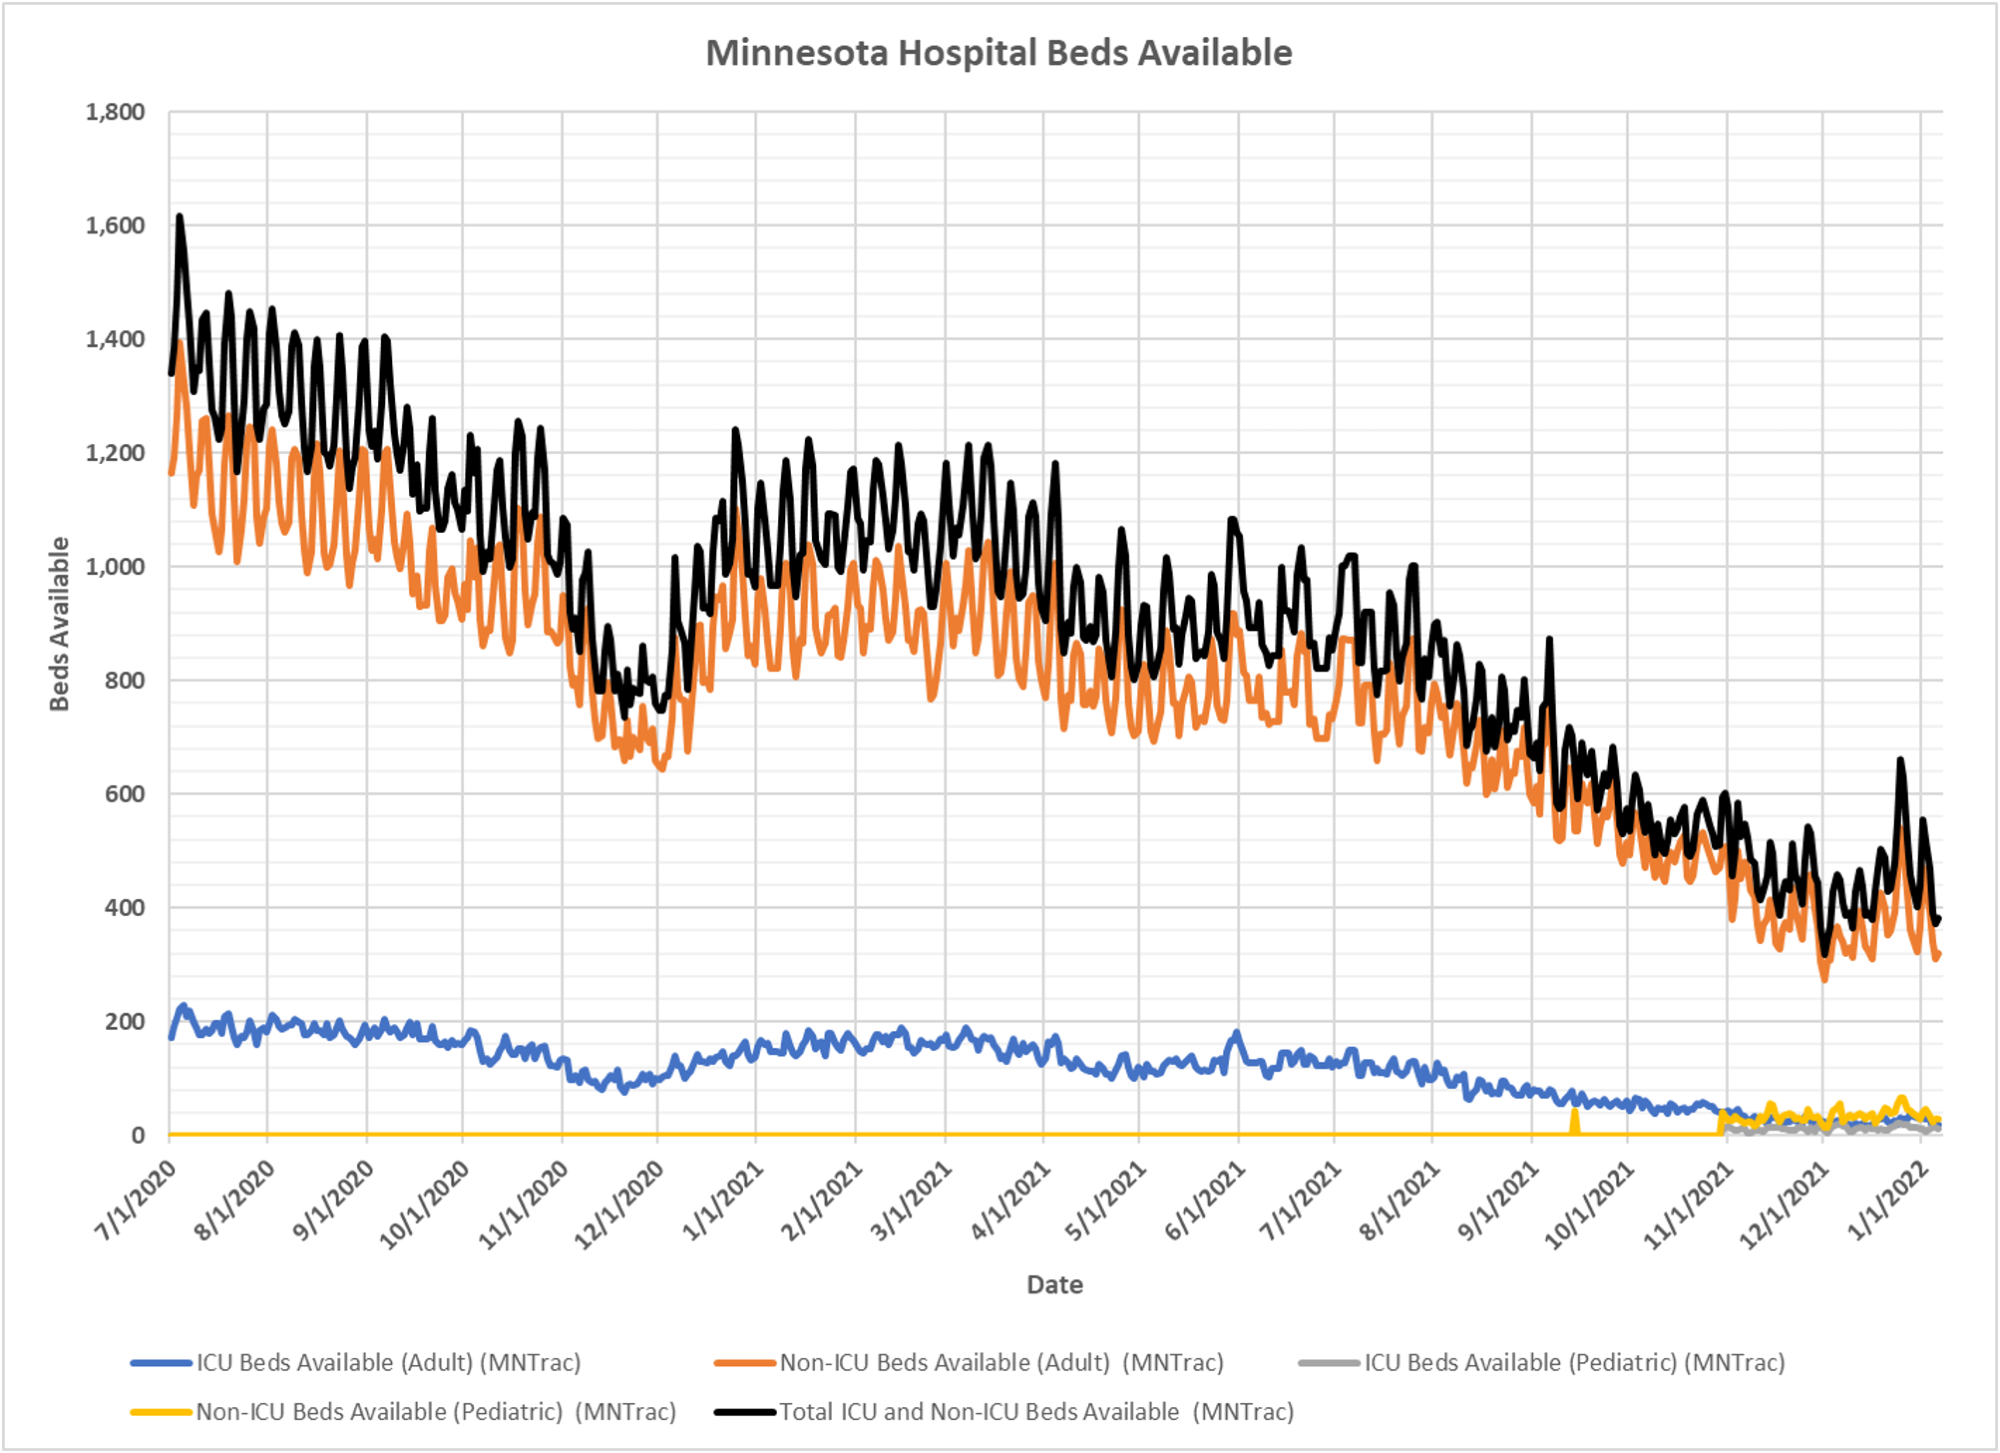
7. Slide 3, Minnesota Hospital Beds Available presents the available beds reported in the MNTRAC data file, without modification. As of 1/06/2022, MNTRAC reports that 12 pediatric and 20 adult ICU beds are available statewide in Minnesota. It also reports that 29 pediatric and 320 adult Non-ICU beds are available statewide, for a total bed availability of 381.

Missing in context is hospital bed usage from 2010-2011 through 2019 then comparing with 2020 and 2021.
I noticed that CDC website has lots of data available for other diseases going back several years, but somehow hospital bed usage only covers 2020-2021 – at least on the CDC website, (or on the CDC website that I can find. Either, the CDC took down or its near impossible to find, even with good search engines. Same trouble locating with google from other sources.
‘a) hospital capacity has dropped because of vaccine mandates, which was completely predictable;’
just a point to clarify: the part of vax mandates that leads to reduced capacity is the healthcare workers fired or leaving. a hospitals capacity is not the count of physical beds, rather it’s having staff to support them