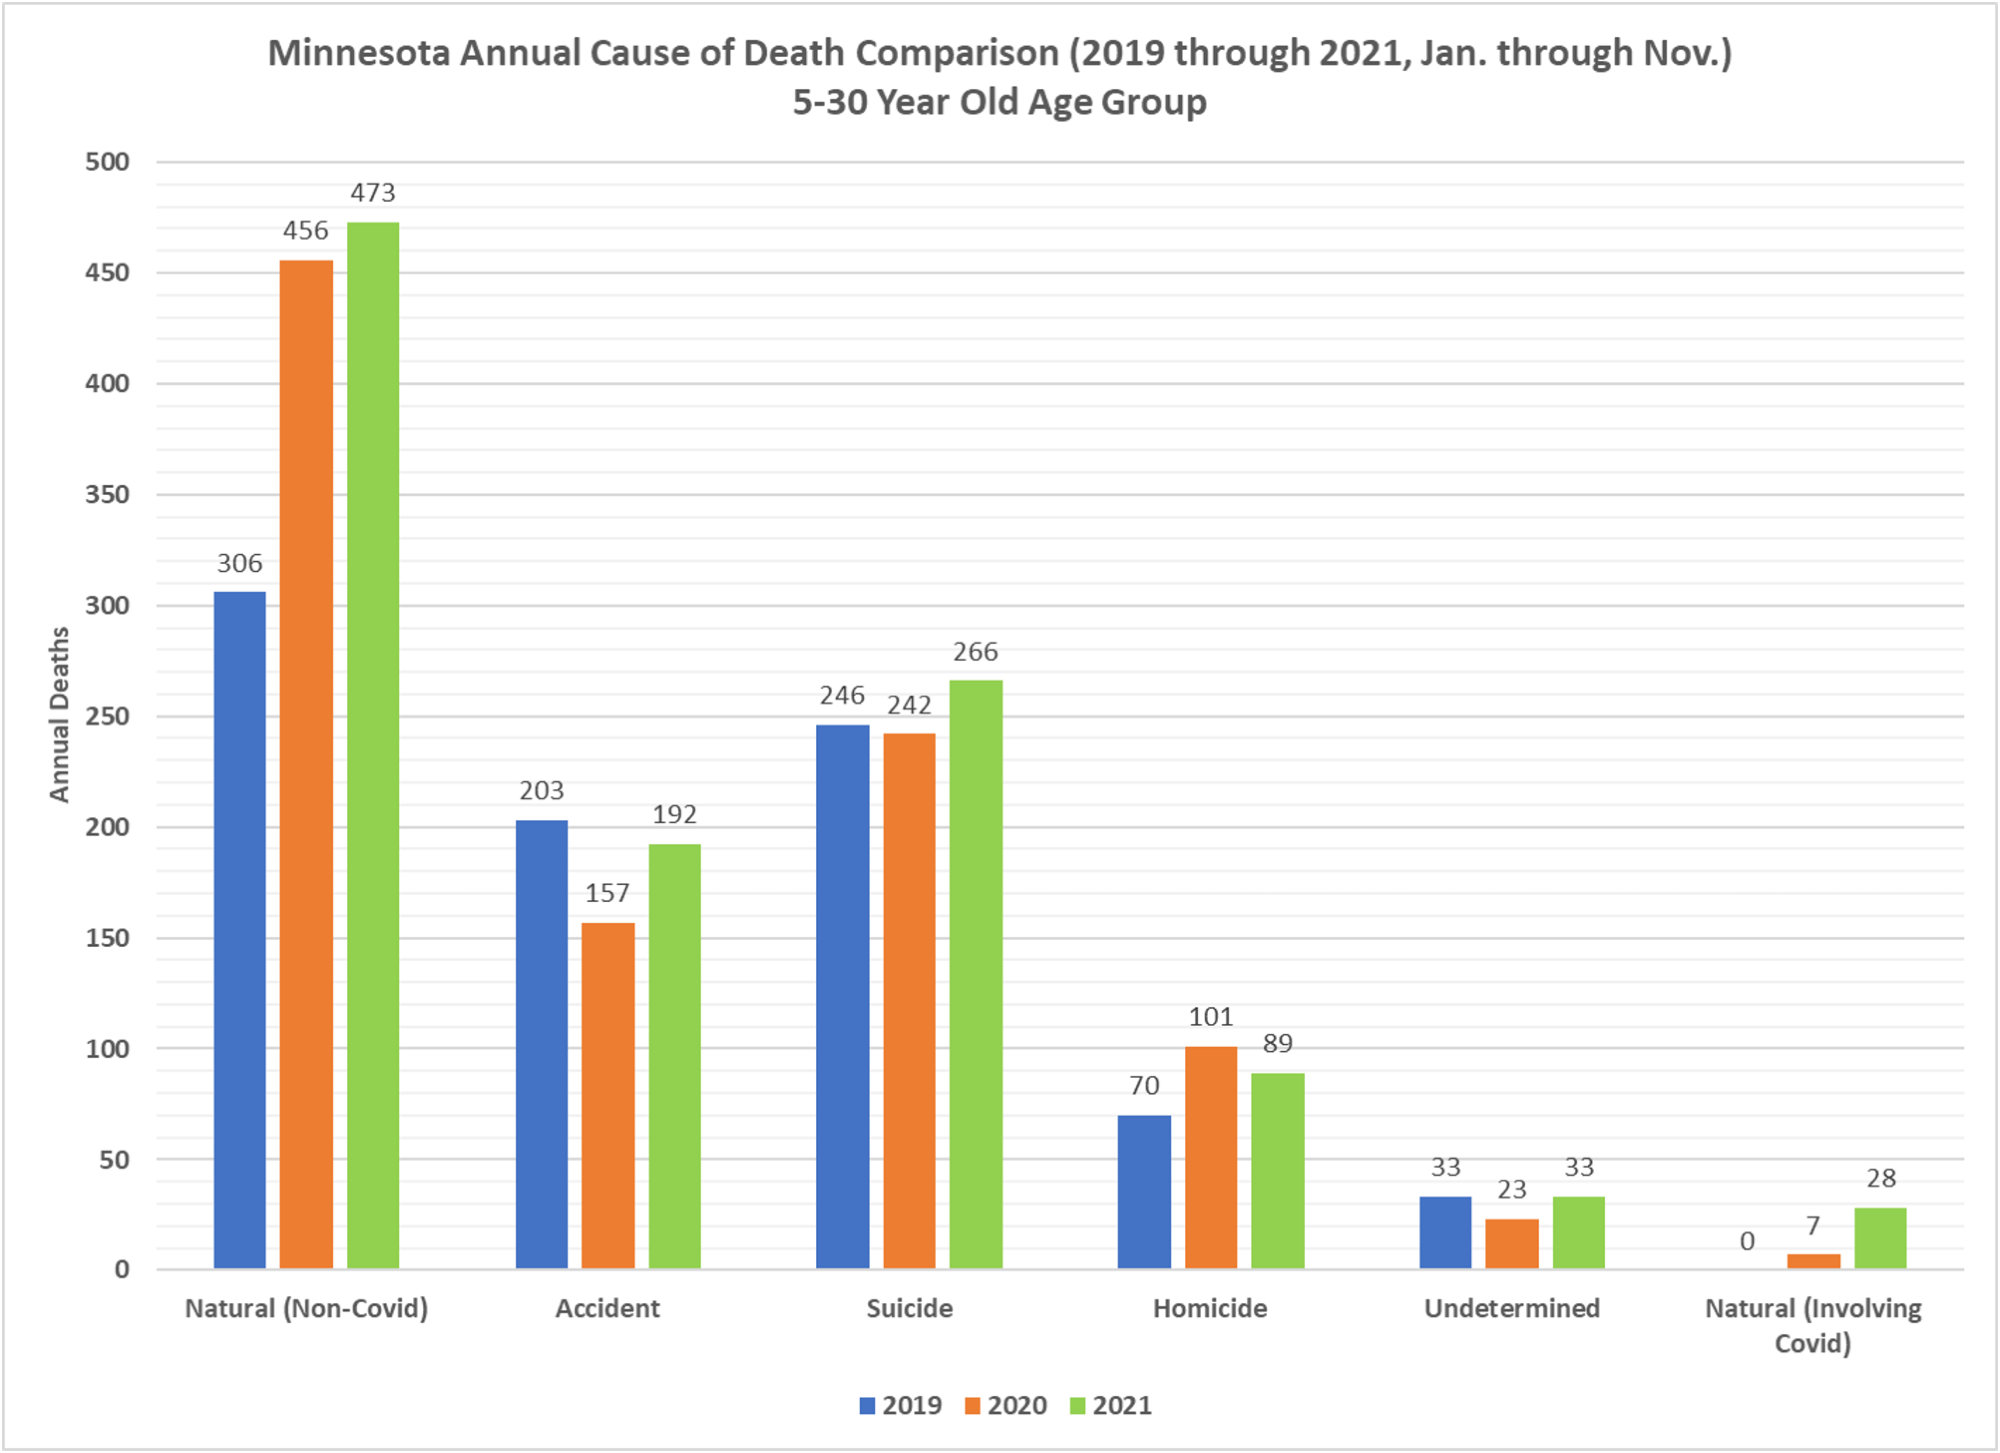
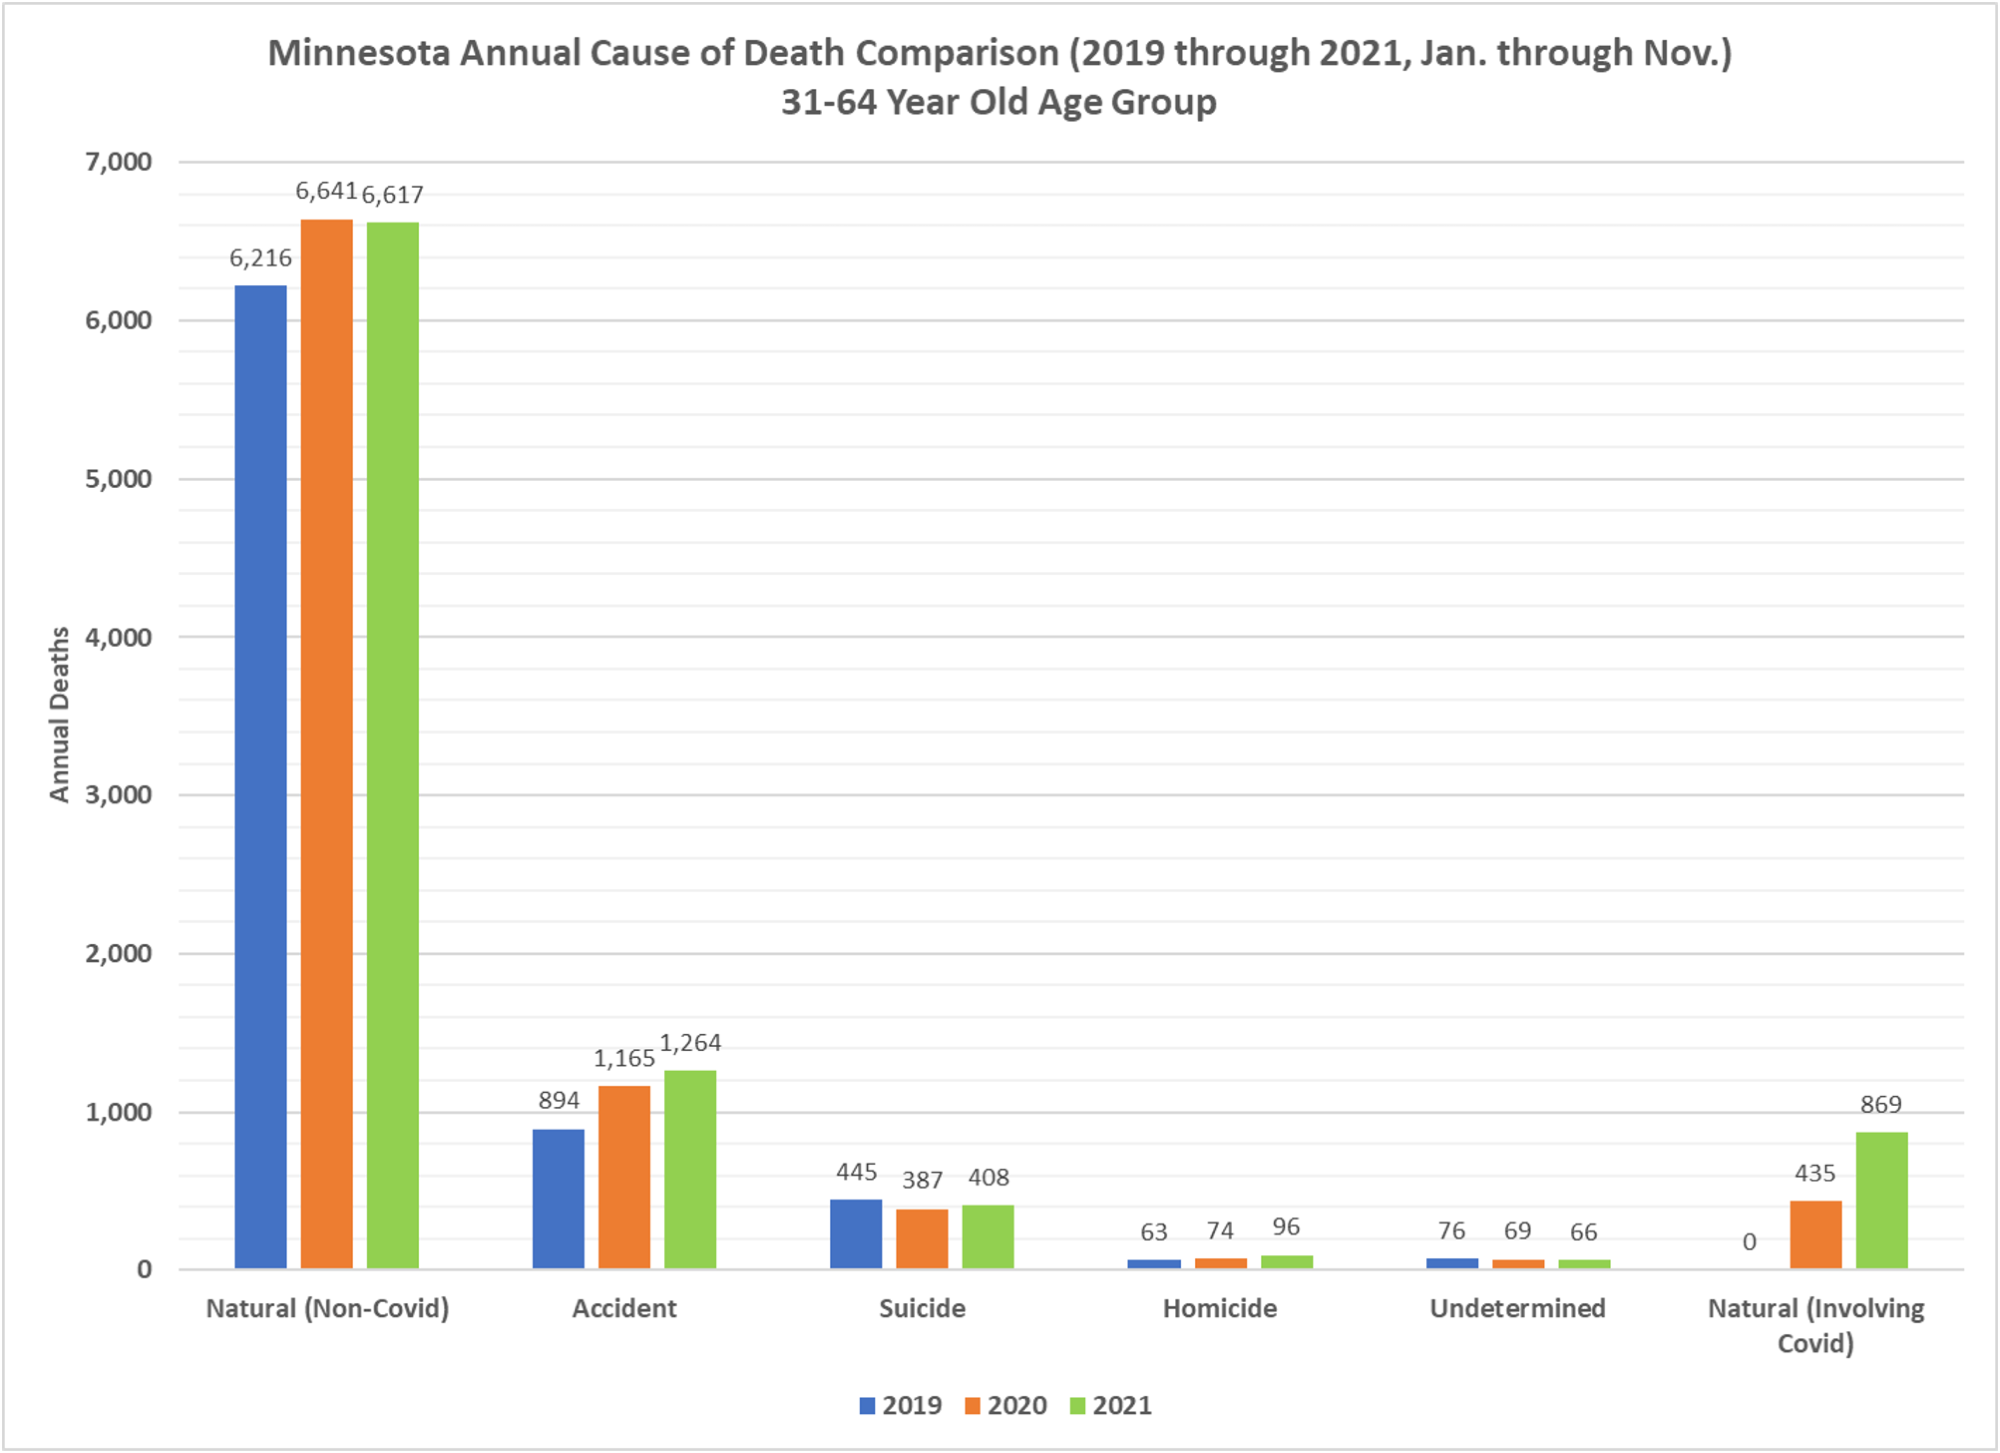
Thanks to DDL and some graph work by Dave Dixon, another look at deaths in certain age groups. Please note that 2021 data is incomplete, not just because December is missing but earlier months probably don’t have full data yet either. You see that accident category in 5 to 30 year olds–that is a lot of drug overdoses. You can see that in the 5 to 30 year olds, death increases are due to homicides–thank you Keith Ellison for doing so much to improve policing–and drug overdoses called accidents, some of which are likely suicides. The increases in non-CV natural deaths in both age groups is due to missed health care for serious illness. There has been a complete lack of balance in our response to CV-19.


Are the Covid deaths on the graphs the official numbers, or were those parsed for died with vs died of Covid?
they are taken directly from death certificates
This is sad for two reasons:
1.) Because.
2.) No one is ever going to see this kind of data unless they come here. The media and the federal and various state Politburos simply do not care about doing anything but scaring the hell out of people. It is disgusting.
It seem obvious to ask about the elephant in the graph. 5-30 group has 150-175 additional “natural deaths”/yr over the Covid time periods. Regardless, there should be very little deaths in this age group not a >50% increase, alarming? I wonder what those “natural death” certificate descriptions look like?
I’ve seen multiple blogs saying the huge increase in natural deaths among the young couple be a result of the vaccines.
I think that is really a baseless claim on their part
According to the Society of Actuaries with 31,000 professional members, a paper (2020 excess death in the US general population by sex and age) notes “the highest excess death percentage when COVID-19 is excluded was for ages 15-24”. There have been UK papers correlating the excessive youth deaths(especially in males) to excess cardiovascular related death. further conversation and investigation is probably warranted. At a minimum, the greater public, public institutions and private businesses with all the data available today may want to revaluate the benefit to risk ratio of vaccination in the under 30 age group.