Updated age structure charts show the start of a big increase in testing–pointless testing of people who maybe have a cold, and potentially of cases, while hospitalizations are actually declining. Now here is what will happen next. There will appear to be an increase in hospitalizations because every person admitted for any reason will be tested and be positive. All garbage. Dave’s notes:
1. There are 2 slides for each set of data, one showing data for the whole pandemic and a second chart showing only data since early July, 2021. Note that the full pandemic slides have different start dates, because Minnesota Department started publishing different data on different dates.
2. The data for the charts on testing, hospital admissions, and deaths comes from the Minnesota Weekly Report (available here: https://www.health.state.mn.us/diseases/coronavirus/stats/index.html). The data in the Weekly Report is presented as cumulative totals for each data type each week. I am taking weekly differences and assembling the data into charts. This data is by date of report, meaning the charts are documenting new events reported this week, even though the underlying event occurred sometime in the past. The data is provided for 5 year age groups, and I am assembling into 10 year age groups to make the charts more readable.
3. The data for the Covid cases per week come from a data file published along with the Minnesota Weekly Report, here: https://www.health.state.mn.us/diseases/coronavirus/stats/index.html#wagscd1 This data is published by date of specimen collection, rather than by date of report as the other data is. The data is provided as cases per week in 5 year age groups. I am compiling the data into 10 year age groups in order for the charts to be more readable.
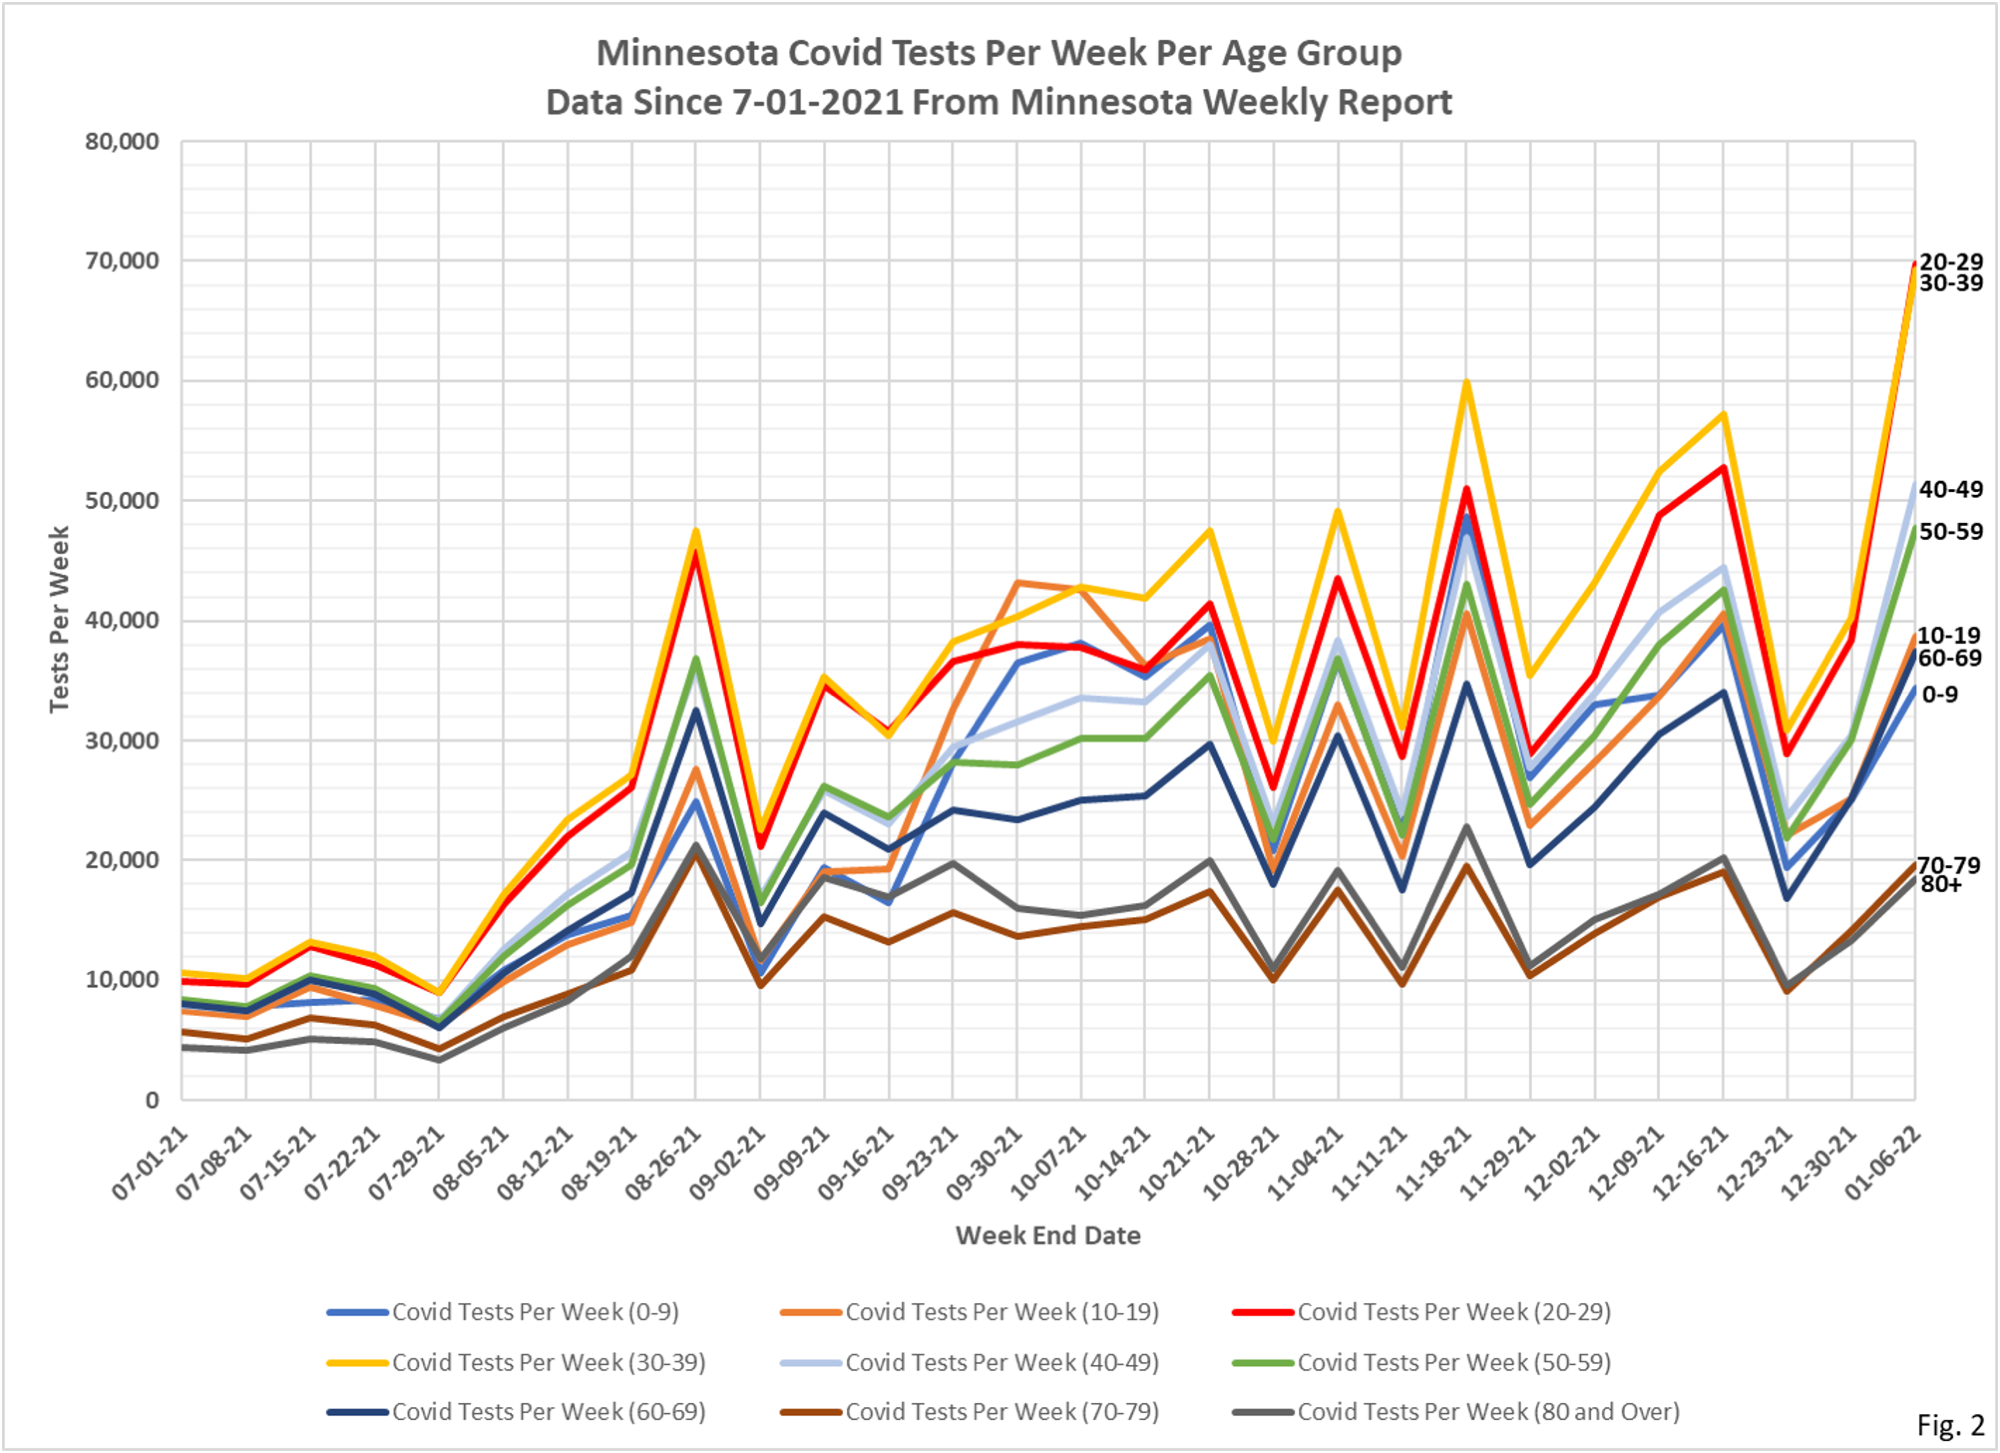
4. Fig. 1 and 2: Covid Tests Per Week. Reported testing is up this week over last week, with all groups higher for the week. The 20-29 and 30-39 age groups especially had much greater increases.
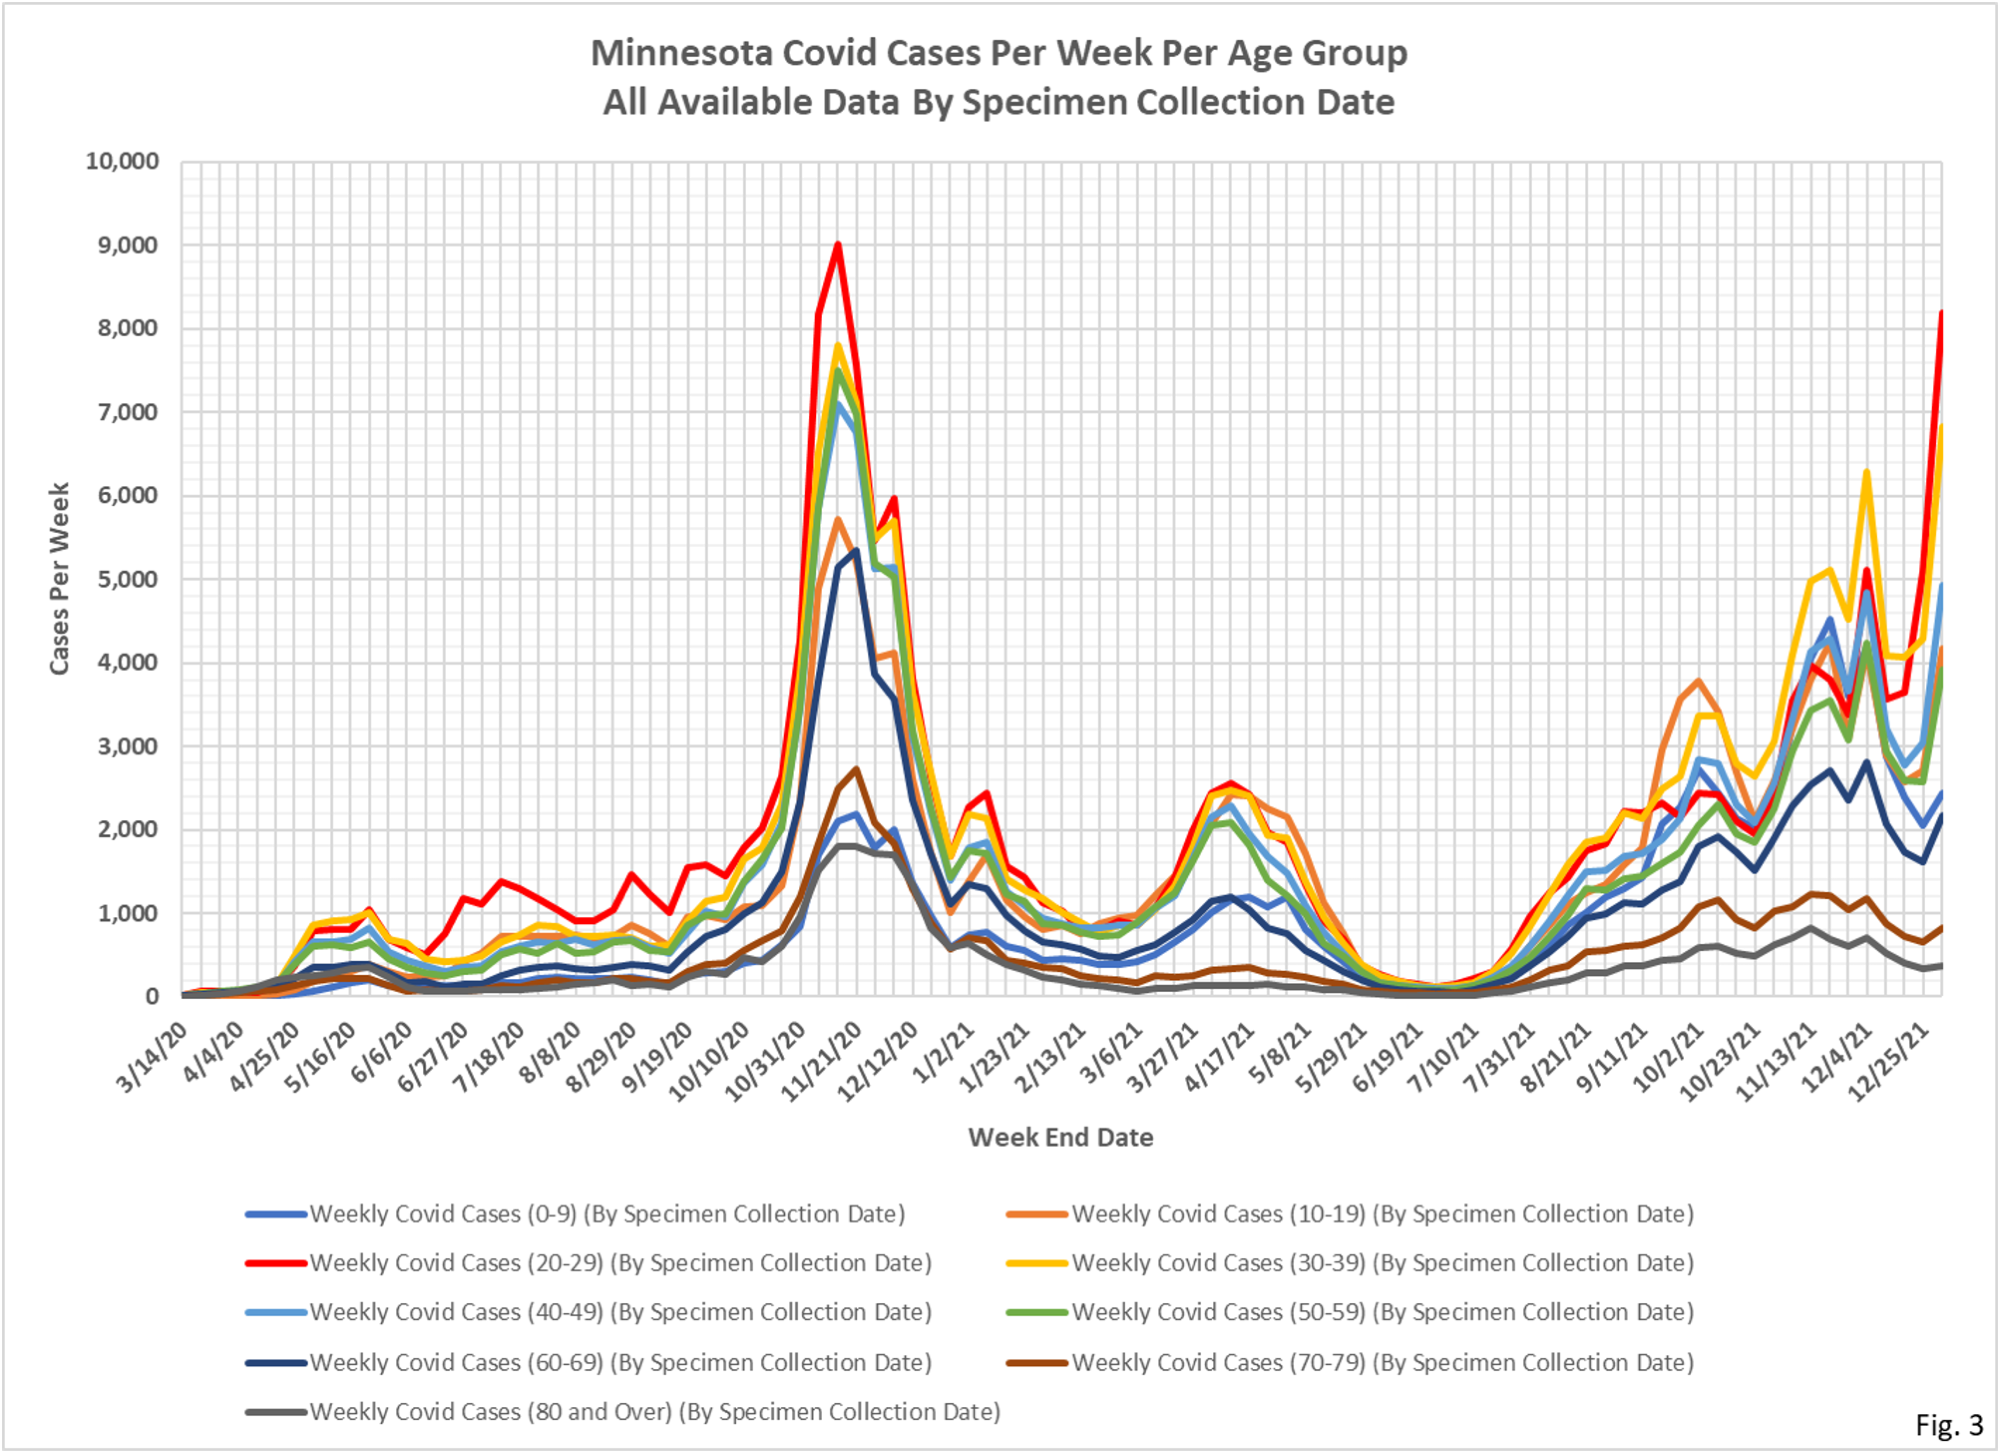
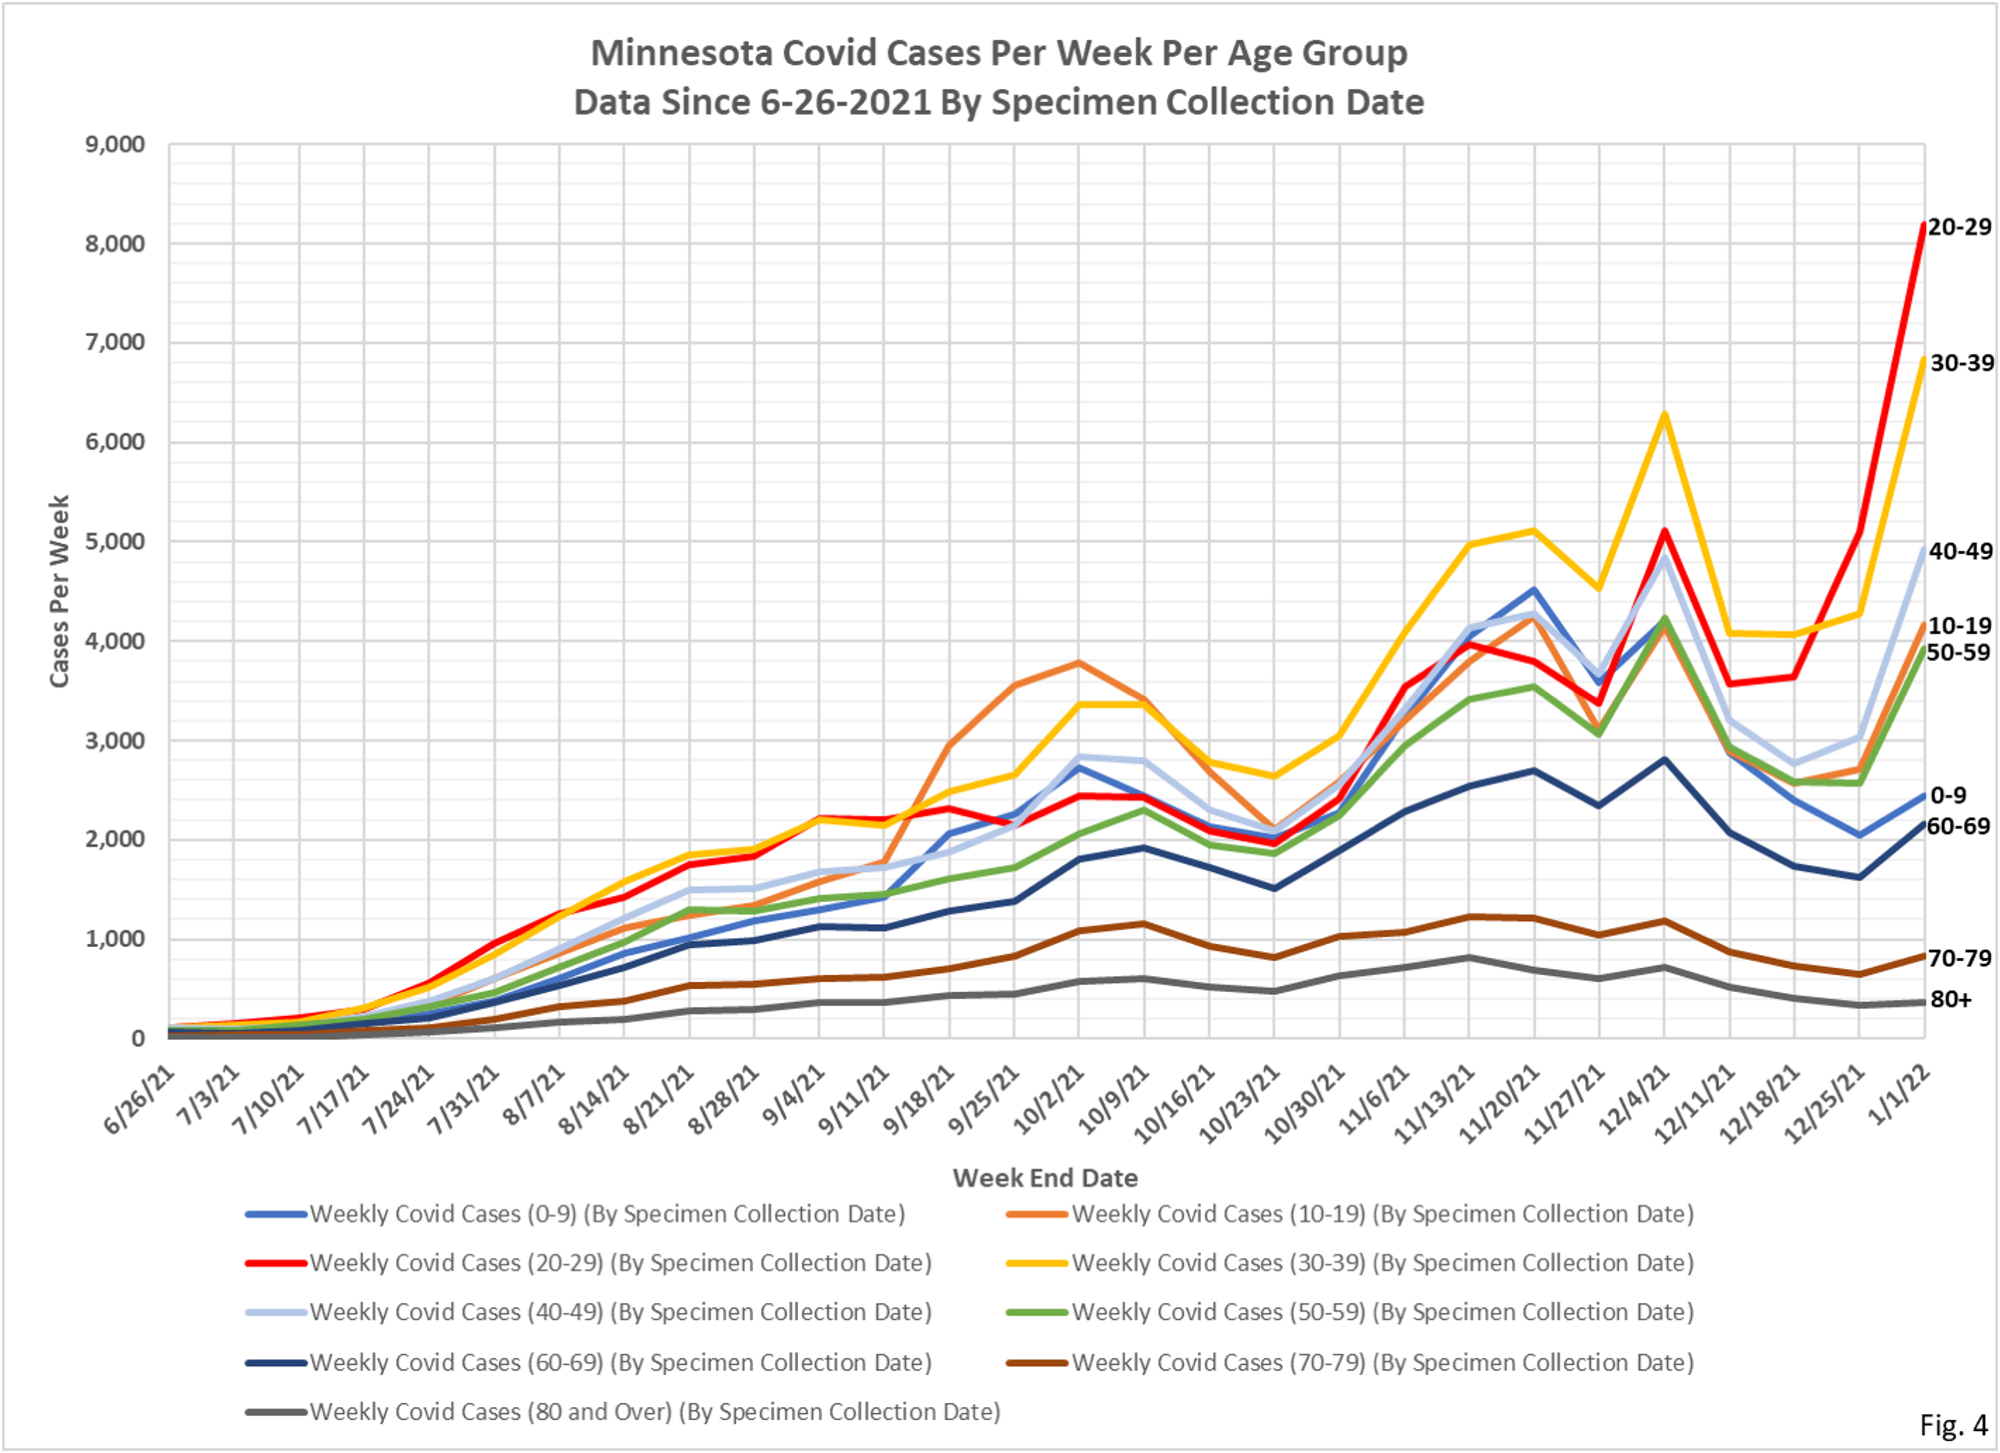
5. Fig. 3 and 4: Covid Cases Per Week. The Covid cases this week were higher in all age groups. The 20-29 and 30-39 age groups were much higher, mirroring the increase in testing for these groups. The 10-19, 40-49, and 50-59 age groups all had sizeable increases, while there were slight increases in the 0-9, 60-69, 70-79, and 80+ age groups. Total cases for the week were reported as 33,848 an increase of 51% from last week’s total of 22,379 cases. The highest cases per week in this data series were 48,683 for the week ending 11-14-2020.
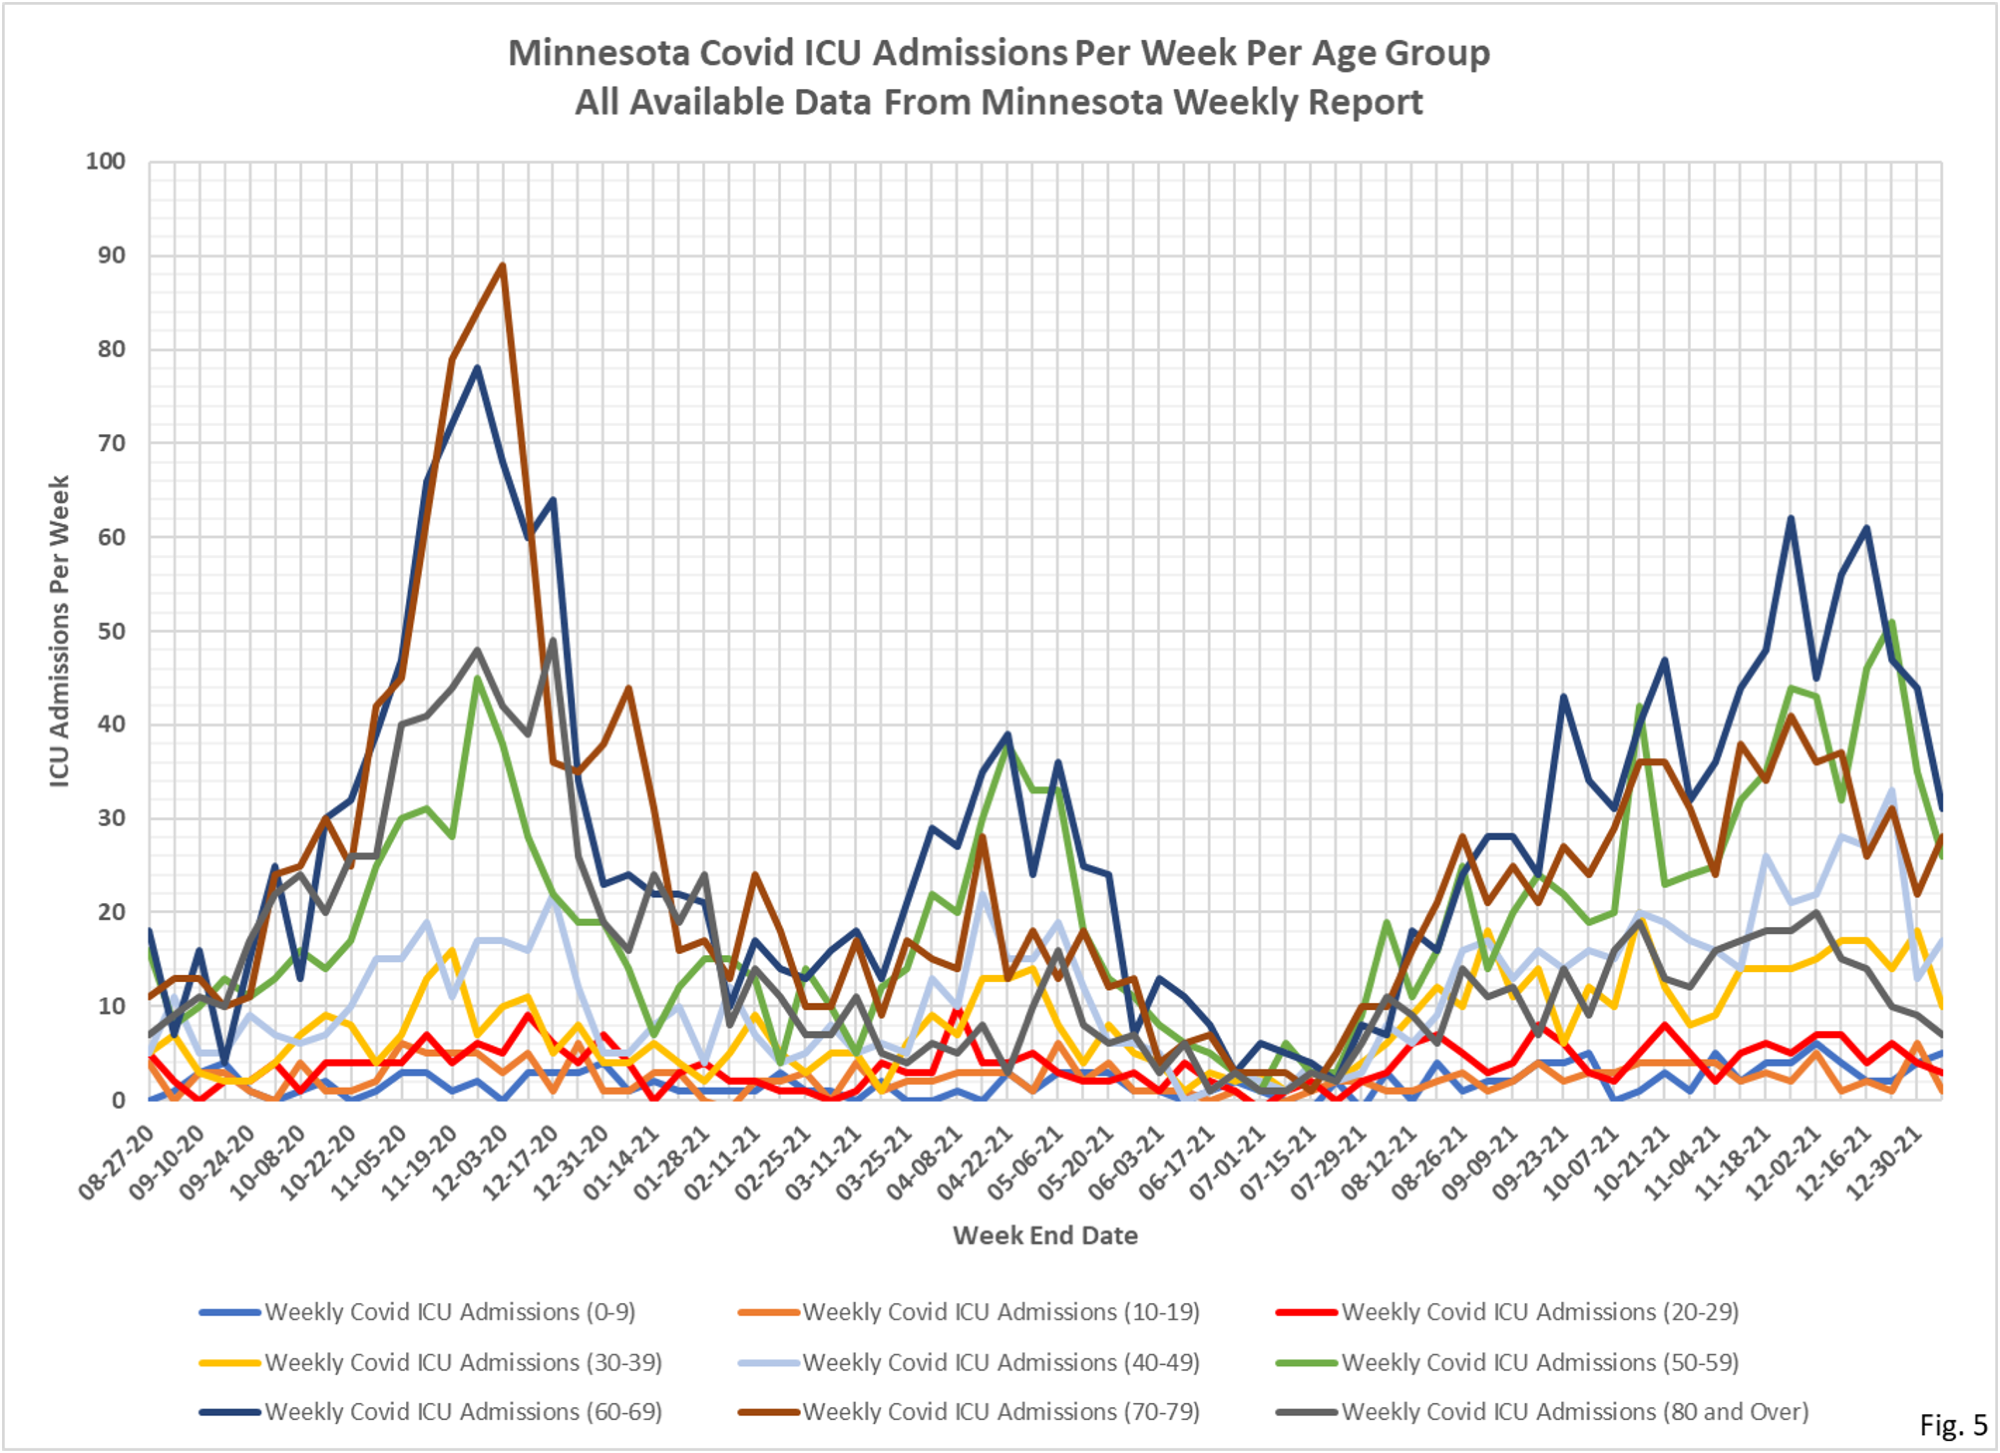
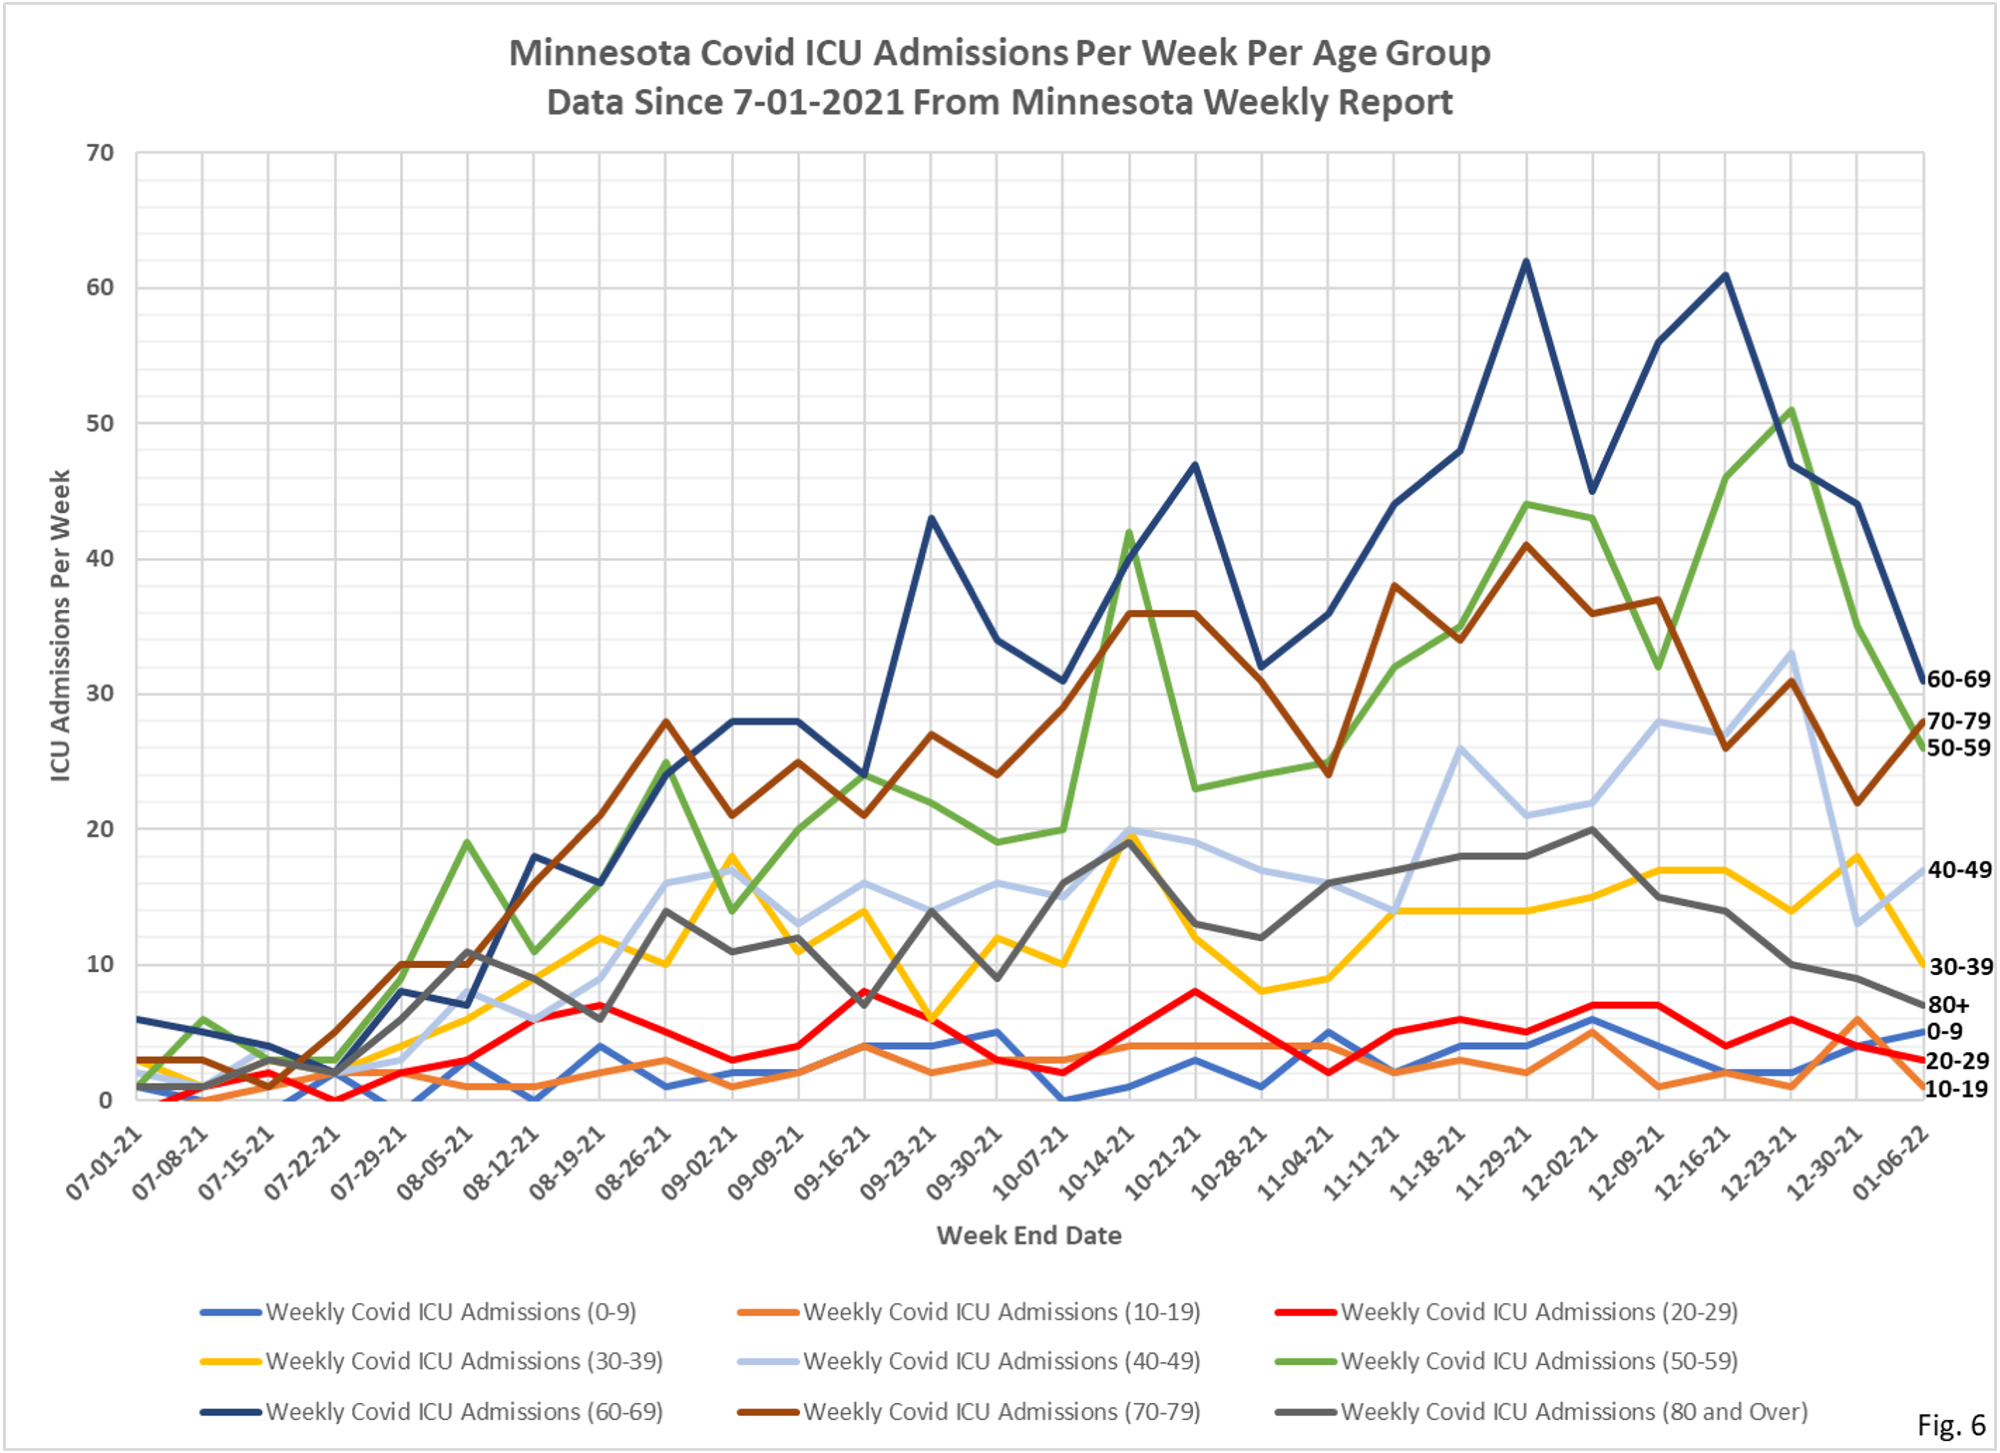
6. Fig. 5 and 6: ICU Covid Admissions Per Week. ICU Covid admissions were generally down sharply for the second consecutive week, except for increases in the 0-9, 40-49, and 70-79 age groups. The young age groups continue to have very low Covid ICU admissions; the 0-9 age group increased from 4 to 5, the 10-19 age group decreased from 6 to 1, and the 20-29 age group decreased from 4 to 3. The drop in ICU admissions for the 20-29 age group is significant as well because of the massive increase in cases for that age group. Total ICU admissions for the week were 128, a sharp decrease from 155 and 195 admissions the prior two weeks.
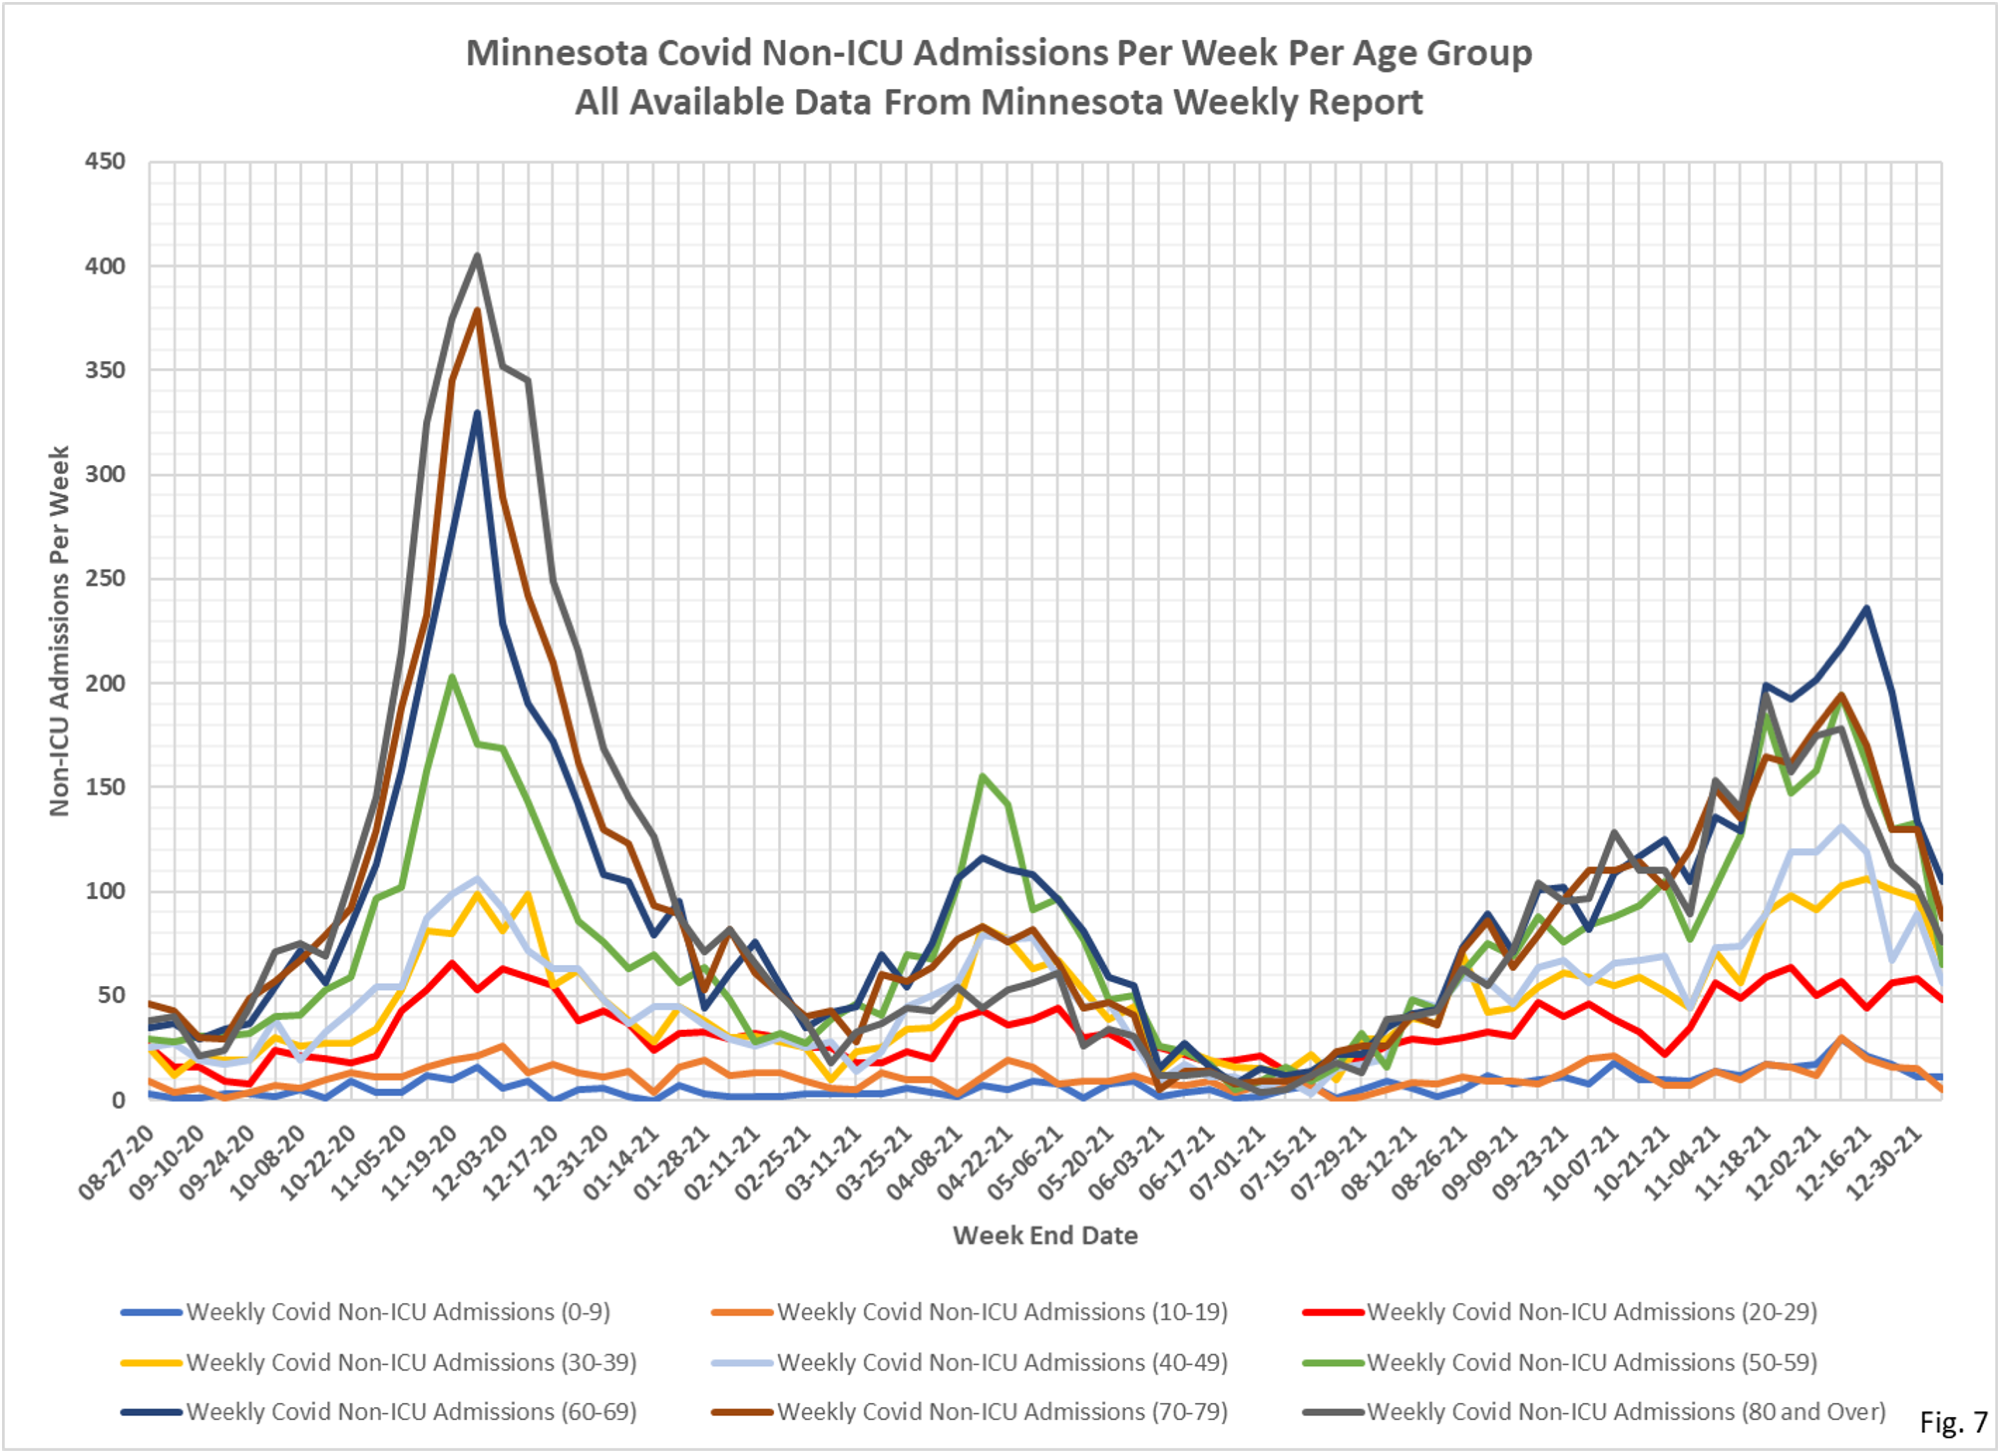
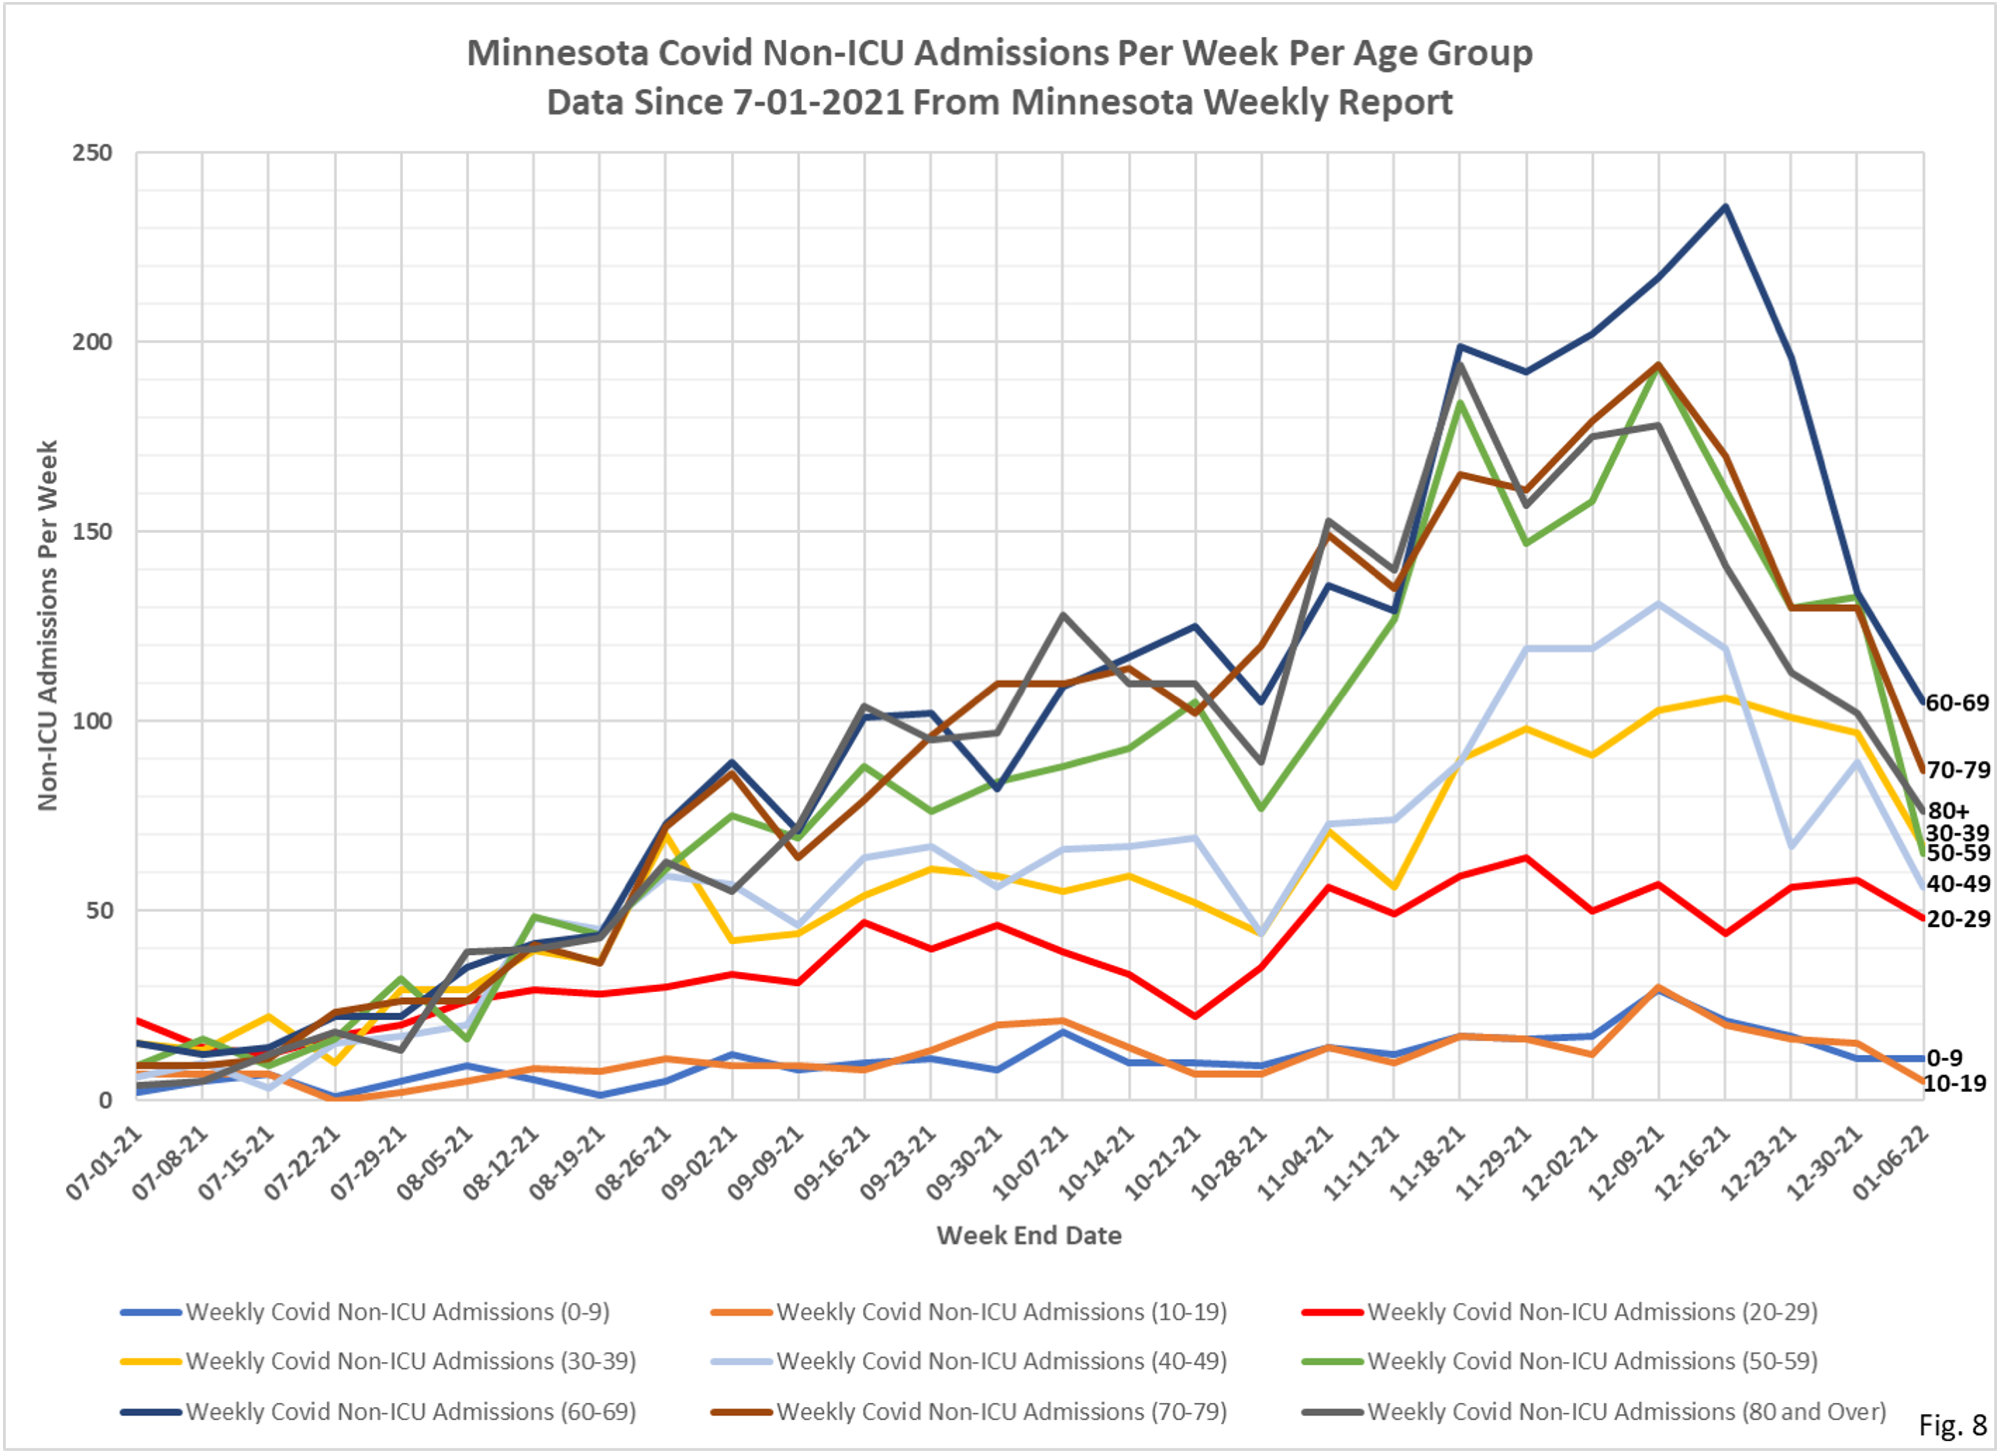
7. Fig. 7 and 8: Non-ICU Covid Admissions Per Week. Non-ICU Covid admissions were sharply lower in all age groups, except for the 0-9 age group which was flat for the week at 11 admissions. The younger age groups continue to have low admissions. The 0-9 age group had 11 admissions, the 10-19 age group had 5 admissions, and the 20-29 age group had 48, but still within the range of recent weeks. Most of these hospitalizations are not likely actually for CV-19. All age groups 40 and over had sharp decreases in admissions for the week. Total Non-ICU Covid admissions for the week were 520, down from 769, 826, and 1018 the prior three weeks.
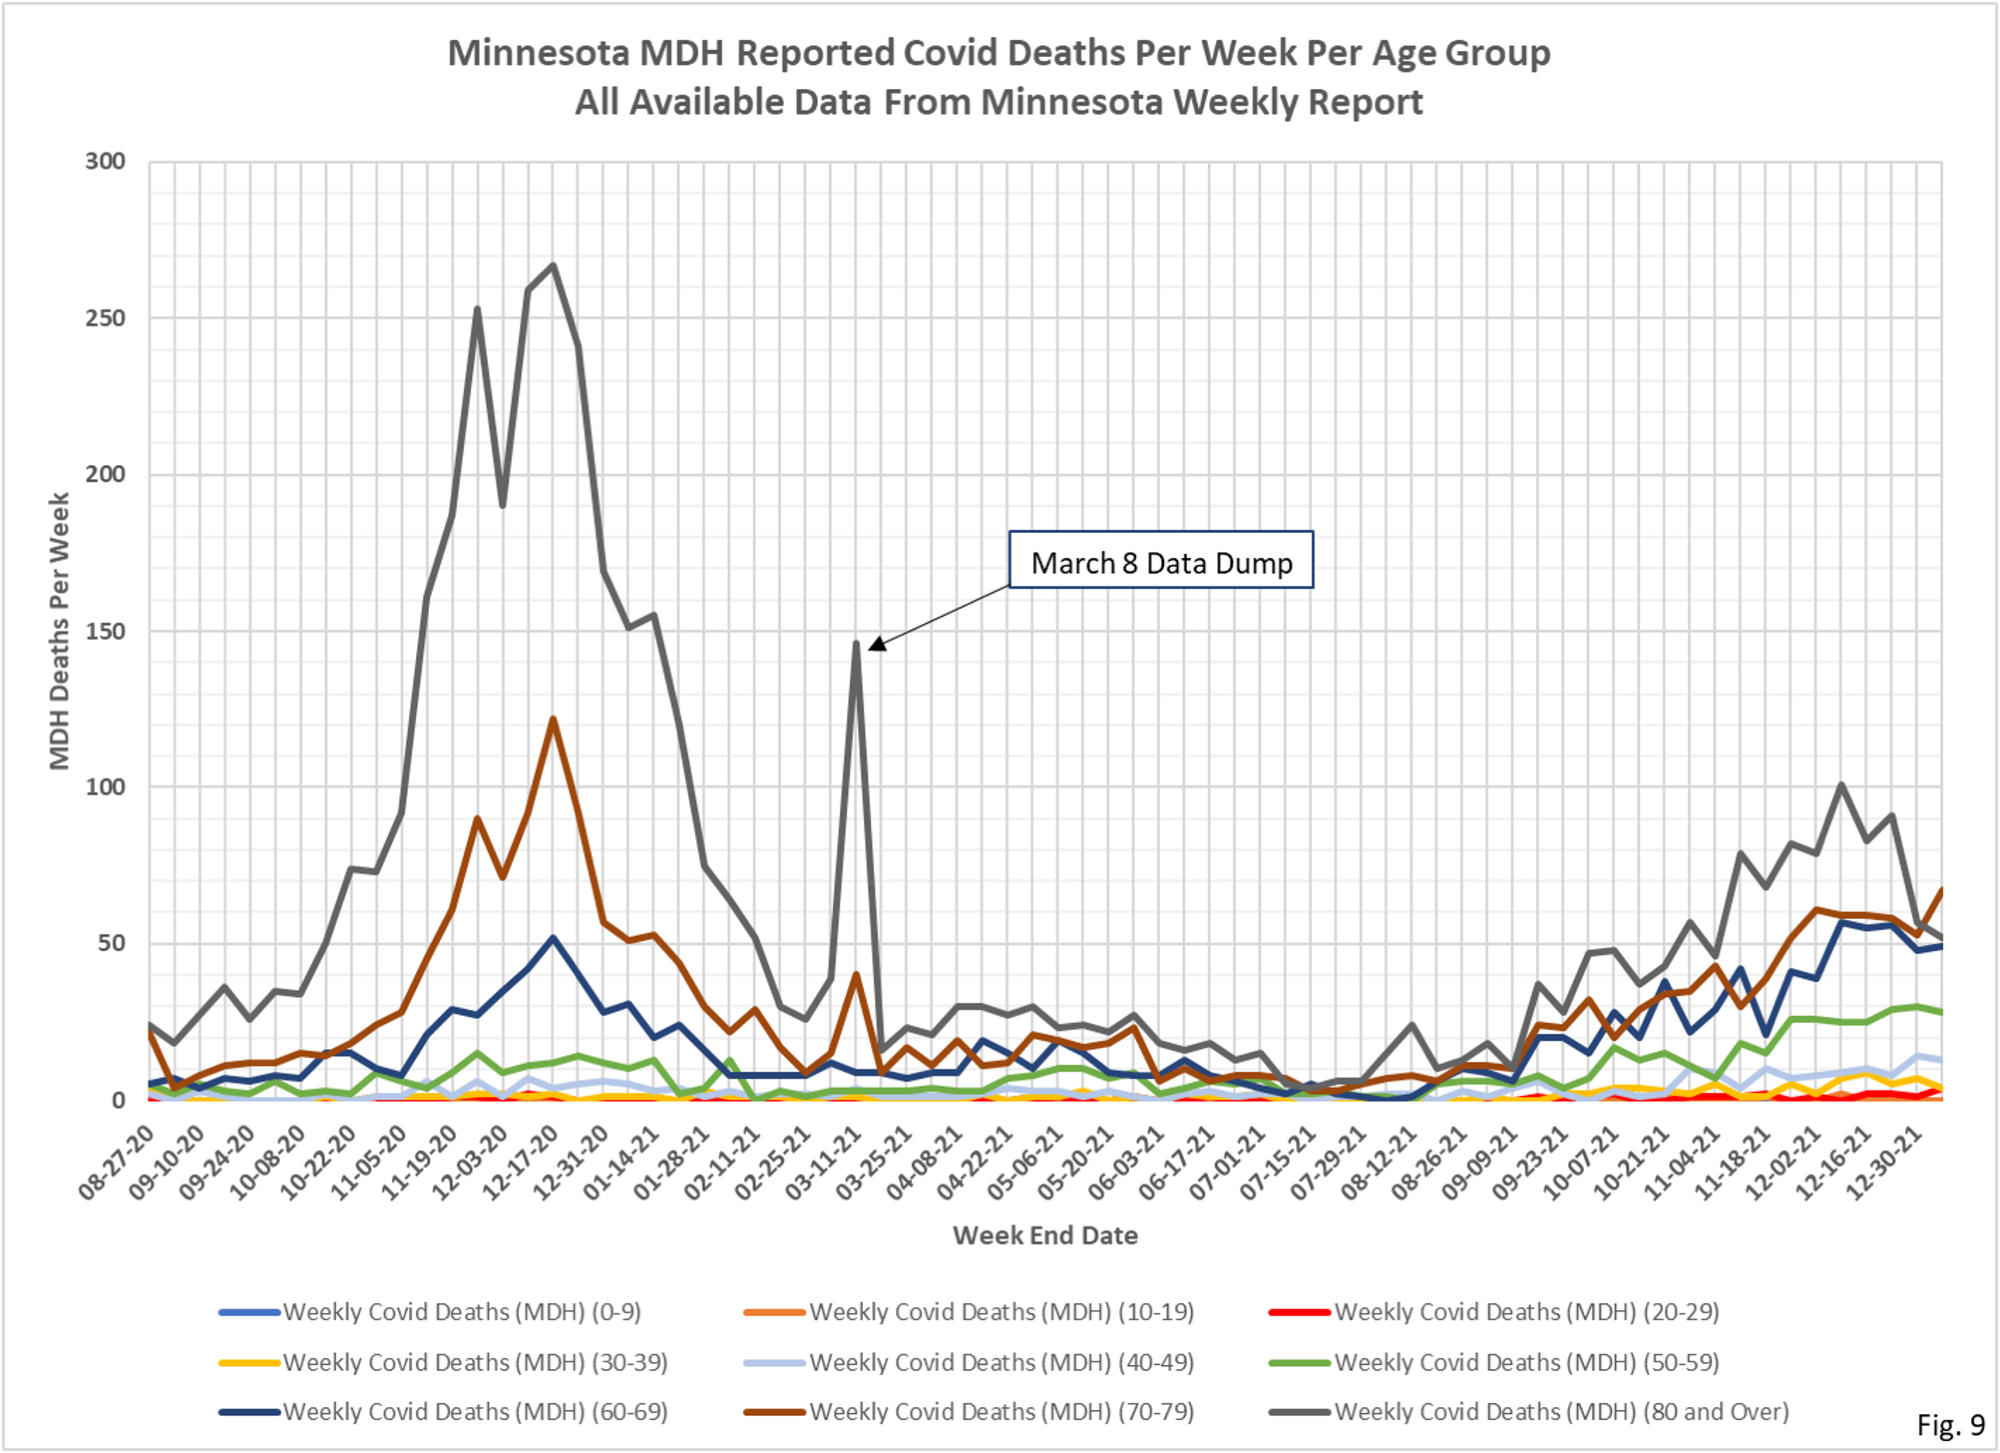
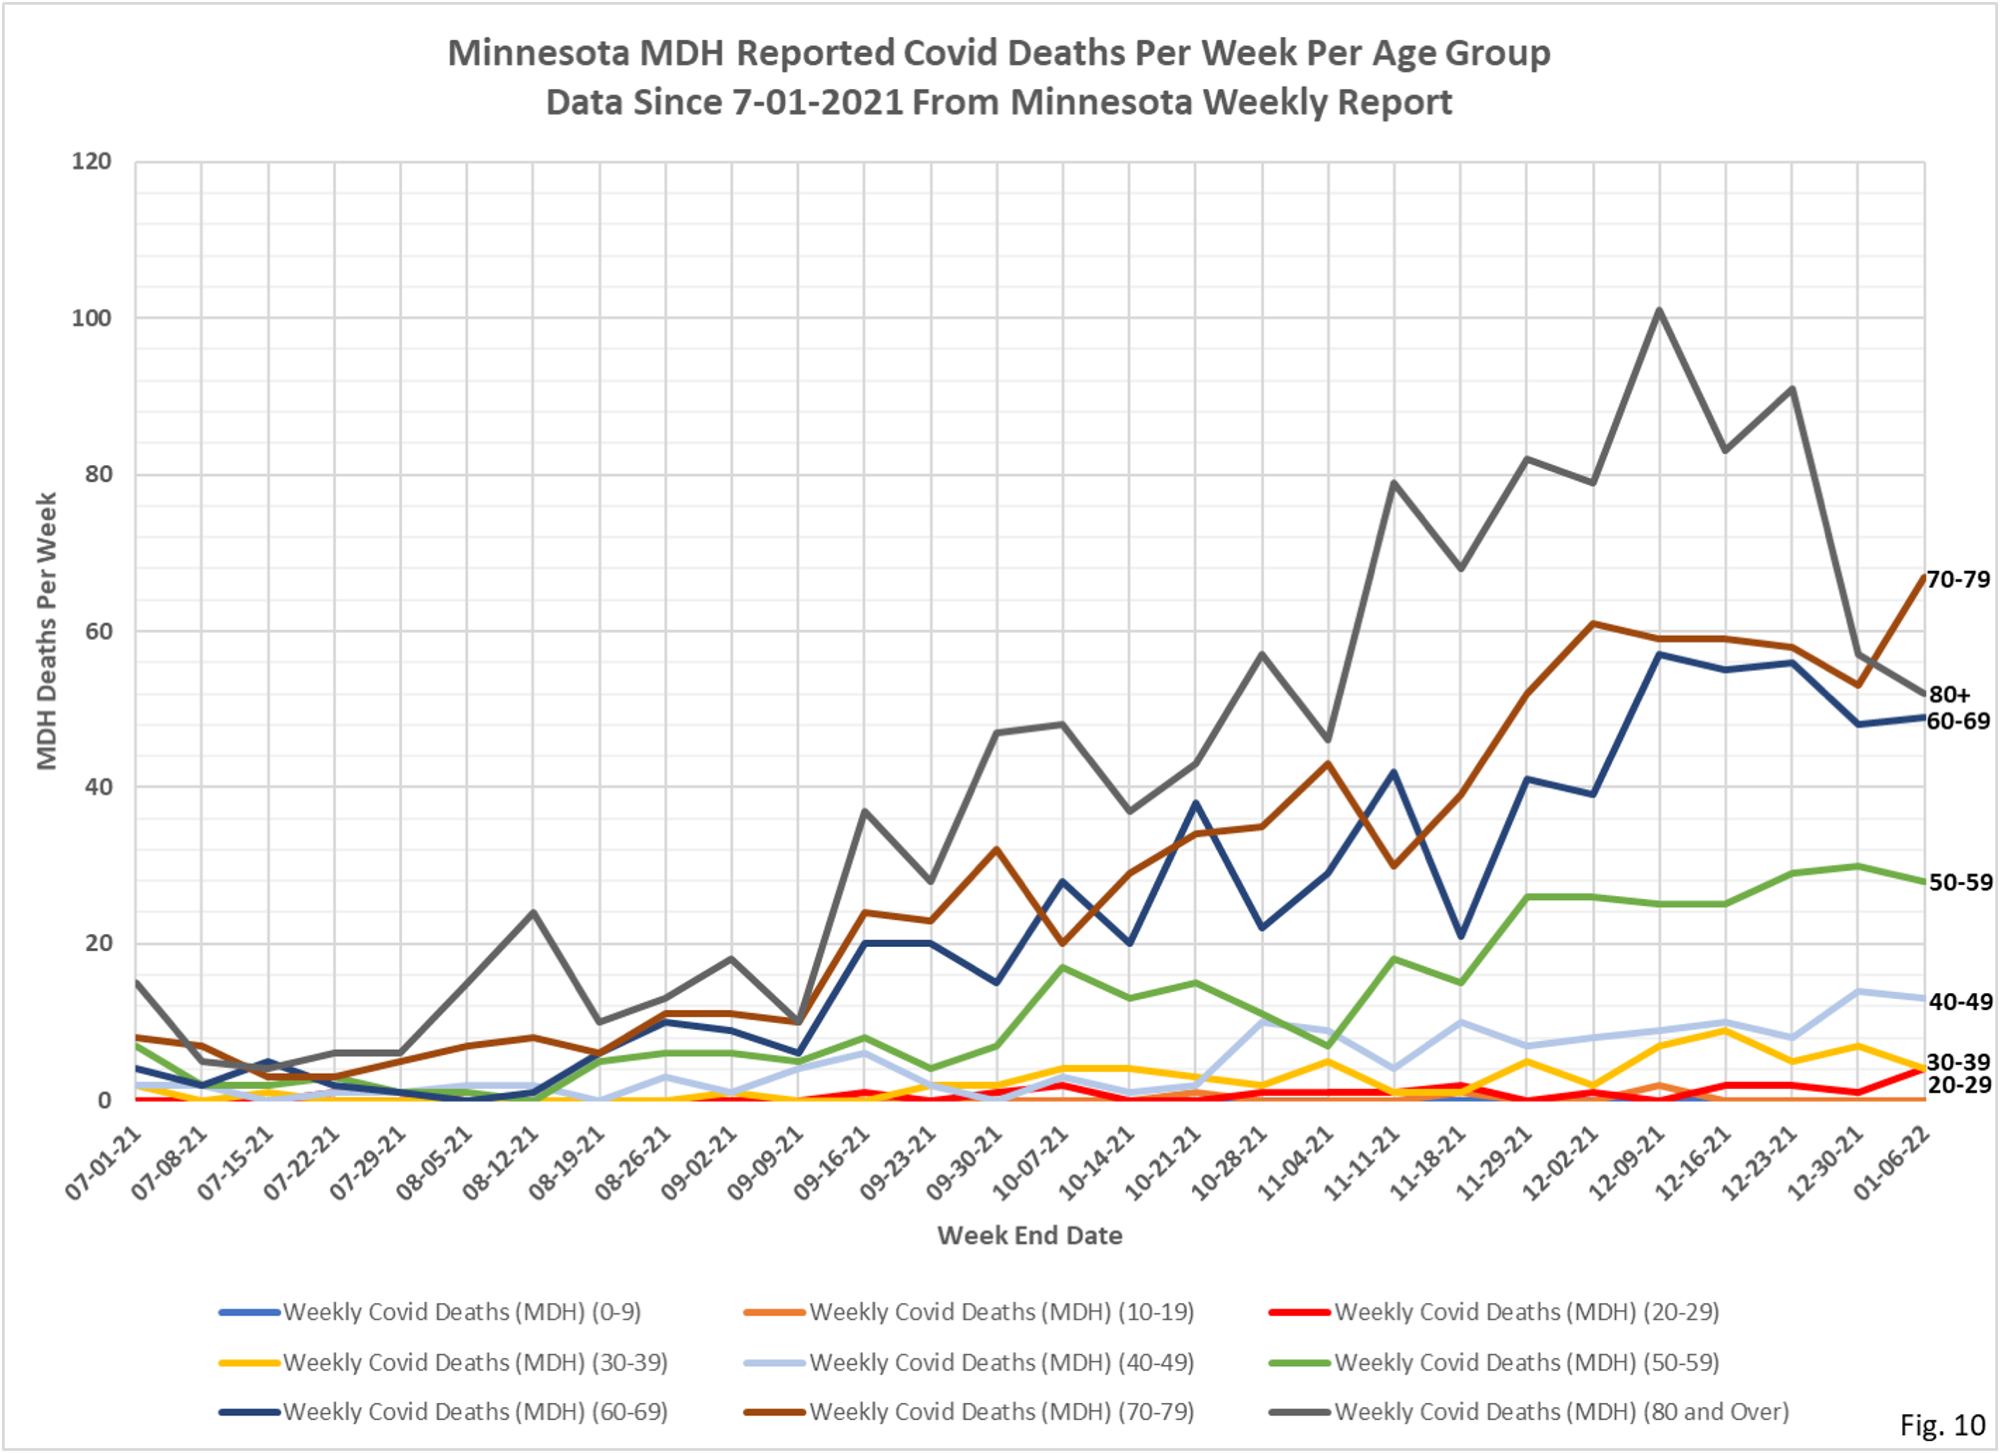
8. Fig. 9 and 10: Covid Deaths Per Week. Total reported Covid deaths for the week were 217, a slight increase from 210 reported deaths the week before. The 70-79 age group had the most Covid deaths of any age group, and the most for this age group since last winter’s surge. There were 52 Covid deaths reported in the 80+ age group, the fewest since there were 79 reported Covid deaths the week ending 11/11/21.


Clearly Ignorance is the prevalent cause!
“BMJ 2020;369:m1808 doi: 10.1136/bmj.m1808 (Published 12 May 2020)
Interpreting a covid-19 test result
The lack of a clear-cut “gold-standard” is a challenge for evaluating covid-19 tests”
PCR is NOT a test.
LF is NOT a test.
It’s all just a lab game and a profit machine.
But hey… lets keep playing this COVIDIUS CIRCUS! It’s making many new billionaires.