The chart below shows, as best we can calculate it given DOH data limits, the relative case rates among the vaxed, unvaxed and prior infected. Once more, DOH although they know it, does not tell us the overlap. Reinfection rate kicking up, as are the other rates. Omicron? These data are very lagged by DOH, so may be too early to say for sure. Dave’s notes:
1. For several weeks we have published this chart comparing overalls risks of testing positive for Covid among the vaccinated, unvaccinated, and previously infected population. On 12/27/2021 Minnesota Department of Health (MDH) made a fairly significant revision to the case, hospitalization, and death rates underlying this chart and others we have published showing breakthrough rates. MDH has revised the size of populations for the various age groups, with the biggest change occurring in the 65+ group, which increased by 28,987 people (we believe, but not yet confirmed by MDH). Since the number of people who are vaccinated is published by MDH, the size of the unvaccinated population is found by subtracting the vaccinated from the total population. Because the 65+ population was increased, this increase all went into the unvaccinated category, This in turn lowered the case, hospitalization, and deaths rates of the 65+ unvaccinated since there were suddenly more people counted in this group as the denominator. The effect on this chart is to lower the peak of the unvaccinated case rate curve from around 1300 per 100k to 1058 per 100k. The vaccinated case rate and reinfection rate are unaffected by this change.
2. Since 11/2/2021 MDH has published Covid reinfection data on the Minnesota Situation Update for COVID-19 web page: https://www.health.state.mn.us/diseases/coronavirus/situation.html Reinfections are defined as a person testing positive for Covid more than 90 days after a prior positive test.
“Confirmed” reinfections are defined as a positive PCR test following a positive antigen test. “Probable” reinfection is defined as a negative PCR test following a positive antigen test. It is implied, similar to Cases, that a PCR positive test is considered “Confirmed” and a positive antigen test is considered “Probable”. For purposes of this analysis all Confirmed and Probable reinfections will be included.
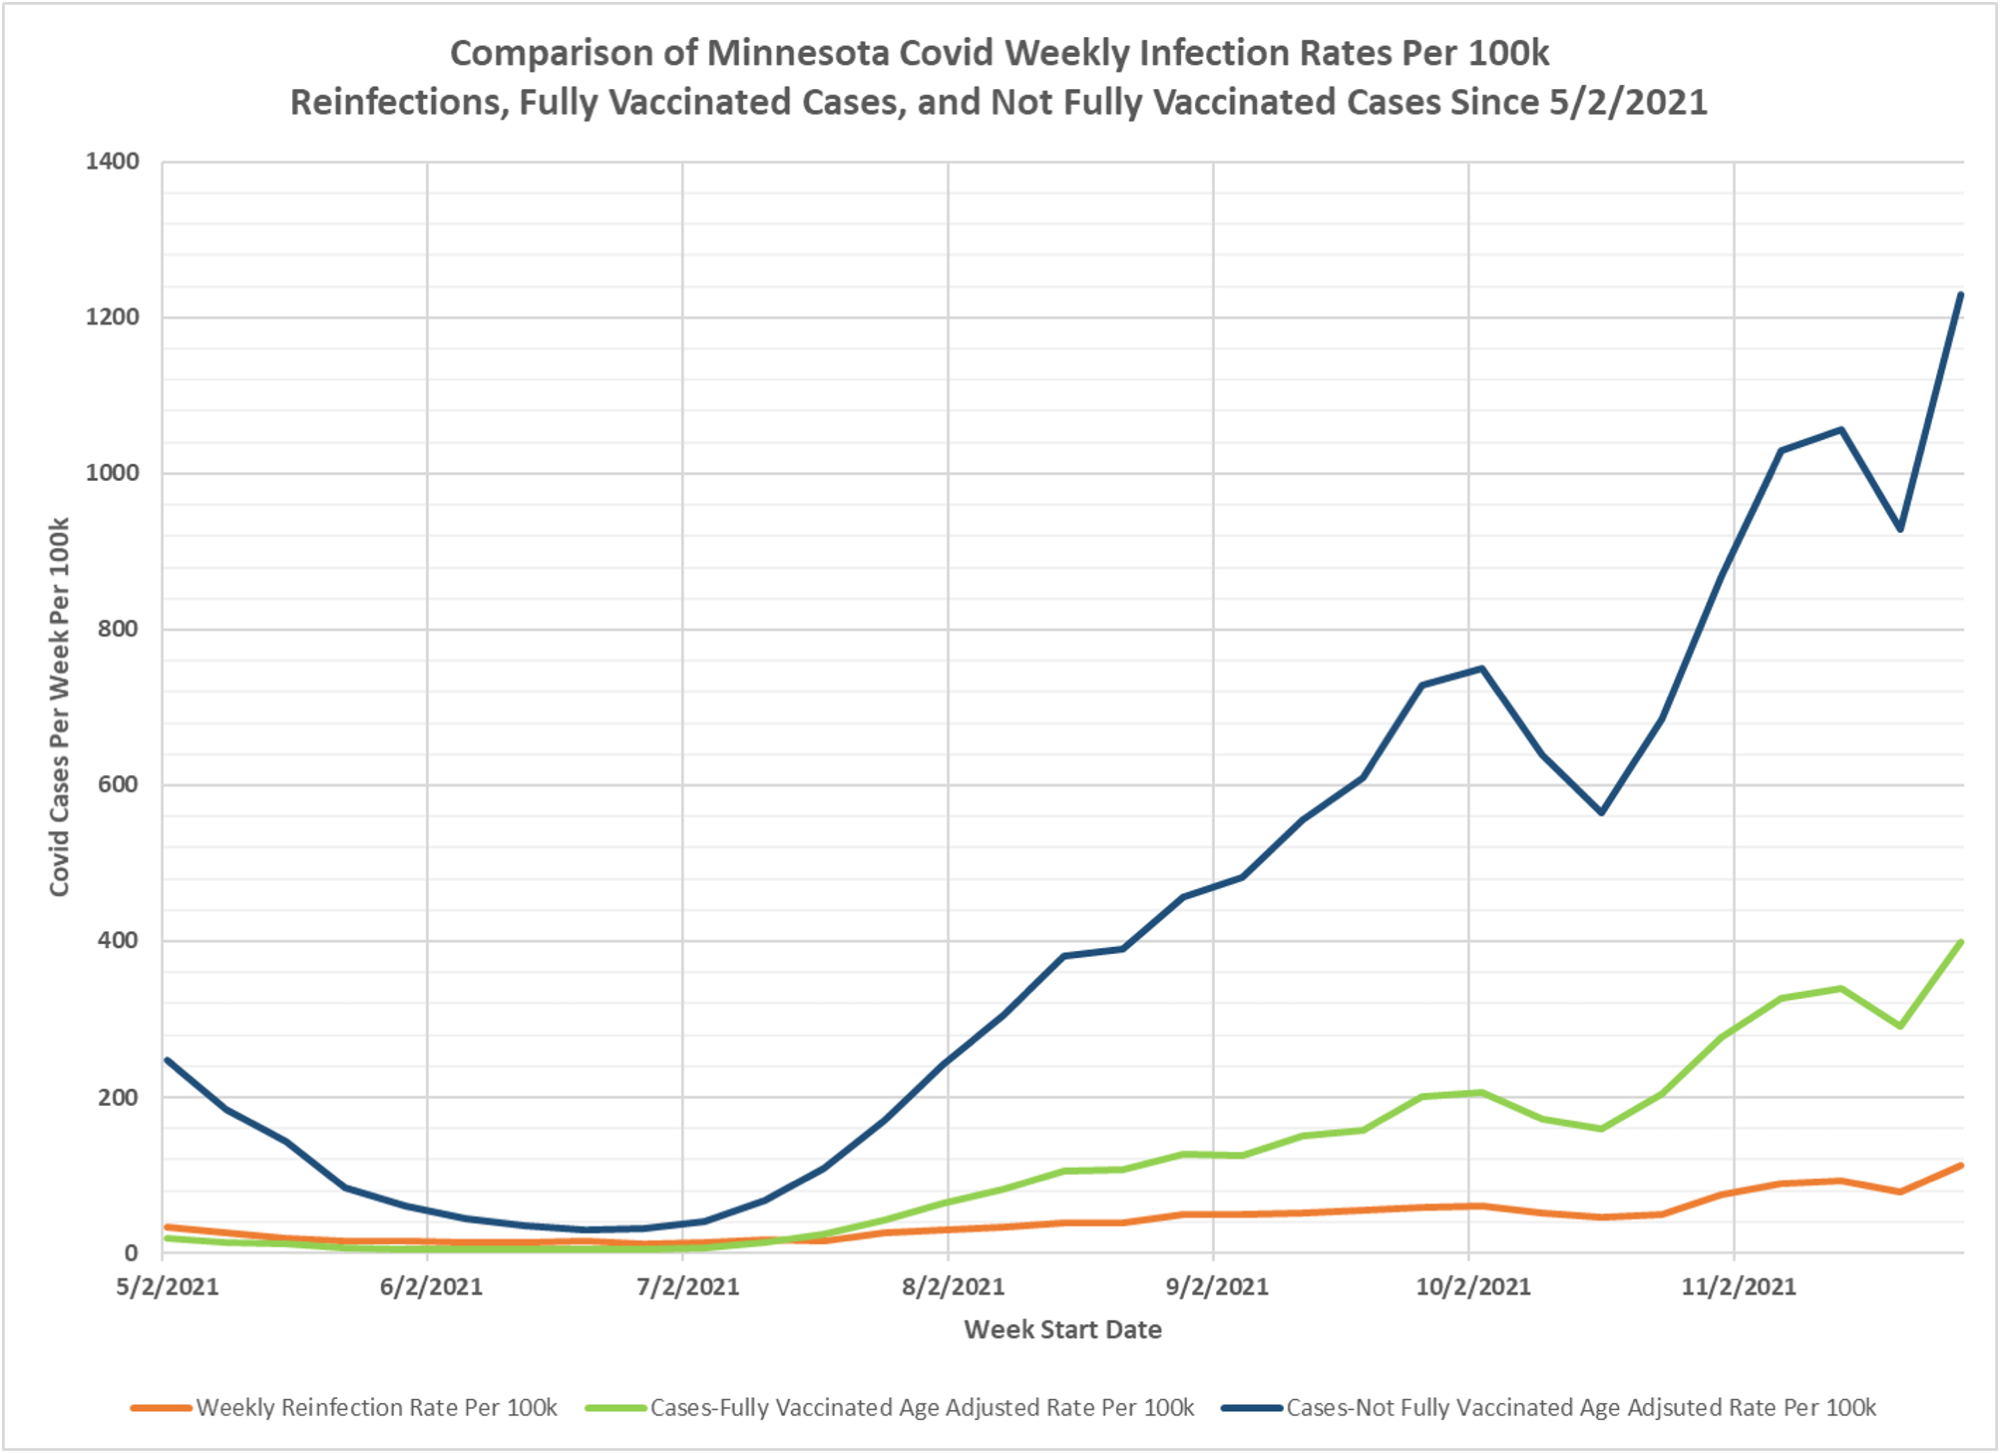
3. The weekly Covid reinfection rate displayed on the chart is calculated as the number of weekly reinfections (confirmed and probable) divided by the cumulative Total Positive Cases 90 days prior to the start of the week being considered, and the result multiplied by 100k to yield the reinfection rate per 100k per week. This is the red curve on the chart.
4. The Fully Vaccinated Age Adjusted Case Rate Per Week (green curve) and Not Fully Vaccinated Age Adjusted Case Rate Per 100k (blue curve) are taken directly without modification from the Vaccine Breakthrough Report https://www.health.state.mn.us/diseases/coronavirus/stats/vbt.html from the data file for Cases, Hospitalizations, and Deaths Over Time graphic (vbtaarates.xlsx linked on this page).
Data is plotted starting 5/2/2021, the earliest date we have breakthrough data. Reinfection data goes back to 6/28/2020, but the earlier data is more variable possibly due to the smaller population of previously infected people.
5. We have no knowledge of what age adjustments DOH performs in order to calculate the Age Adjusted Rates, and we have not yet submitted a formal query to MDH for this information.
6. It is likely that there are people who may have contracted a mild enough Covid infection that they did not seek medical attention or get tested, causing an undercount of the true number of breakthrough infections, non-breakthrough infections, and reinfections.
7. We do not know how thorough and comprehensive MDH’s process is in identifying reinfections or breakthrough infections.
8. The main purpose in generating this chart is to try to compare the relative infection rates for previously infected people to vaccinated people, and then to unvaccinated people. We can see that throughout the Summer of 2021 the three rates were all low, during the time period in Minnesota when Covid cases were very low in general. However, unvaccinated infection rates were always the highest of the three, and for several months the reinfection rate was higher than the vaccinated breakthrough rate. For the week starting 11/28/2021, the most recent date where we can be considered to have complete breakthrough case data, the reinfection rate was 111.9 per 100k, the vaccinated infection rate was 399.4 per 100k, and the unvaccinated infection rate was 1229.8 per 100k. From these rates we might say that the vaccinated are 3.6 times more likely to test positive than someone who previously recovered, and the unvaccinated are 3.1 times more likely to be infected than the vaccinated.