Dave does his best to identify relative rates of hospitalizations and deaths. Every issue noted below could be very, very easily fixed by DOH, which has the exactly relevant data in its possession but won’t release it. Dave’s notes:
1. The case hospitalization rates and case death rates are simply the percentage of those who test positive for Covid in a given period of time who go on to be admitted to a hospital or die.
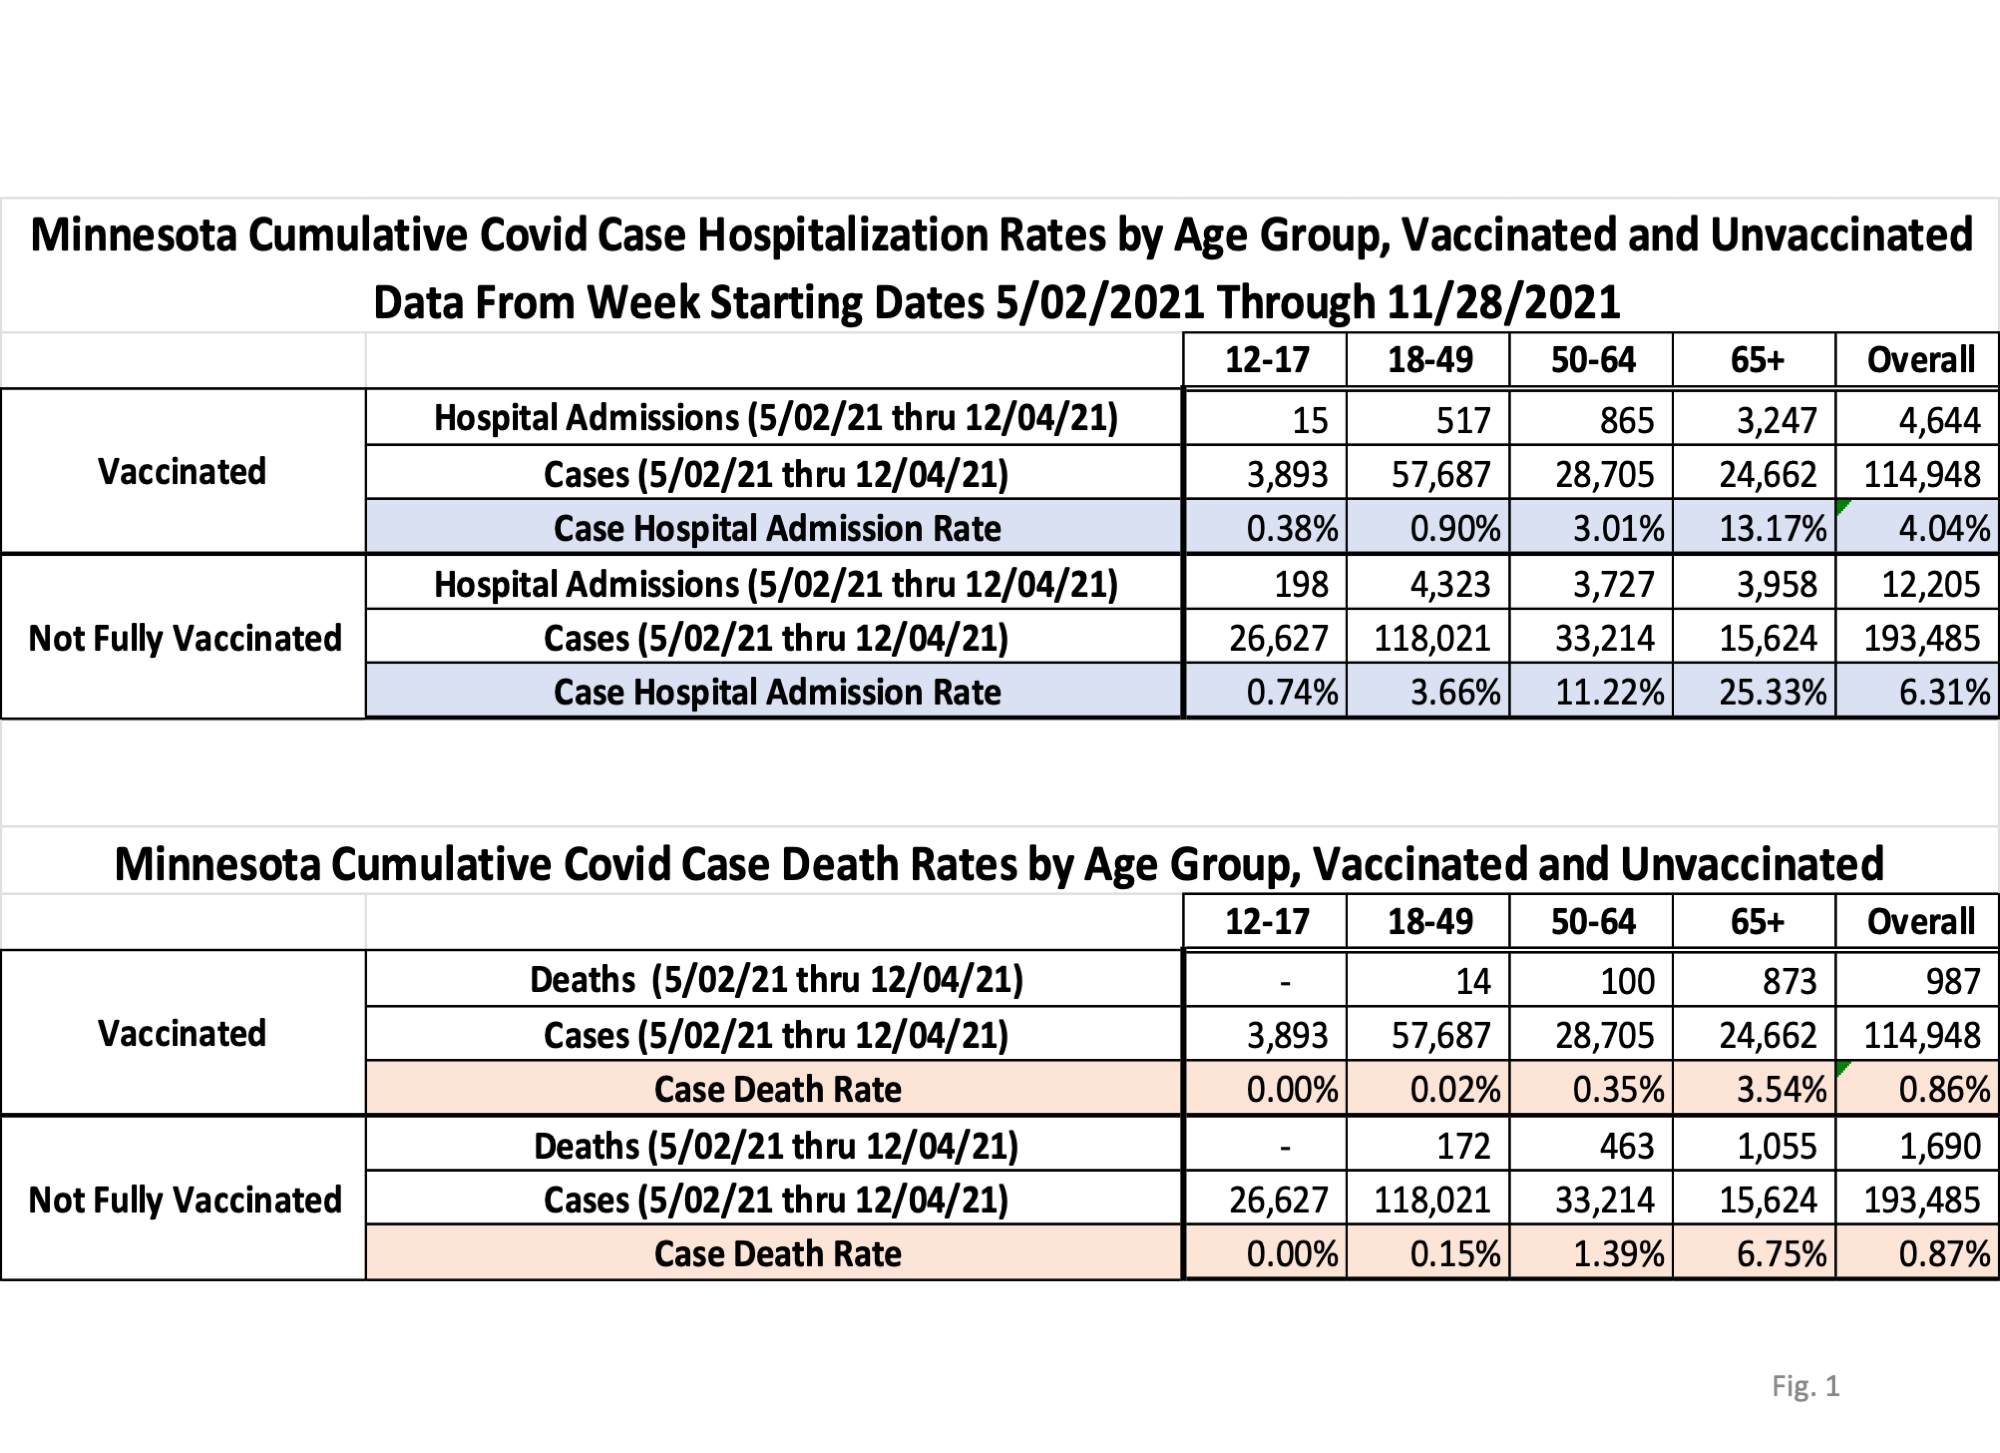
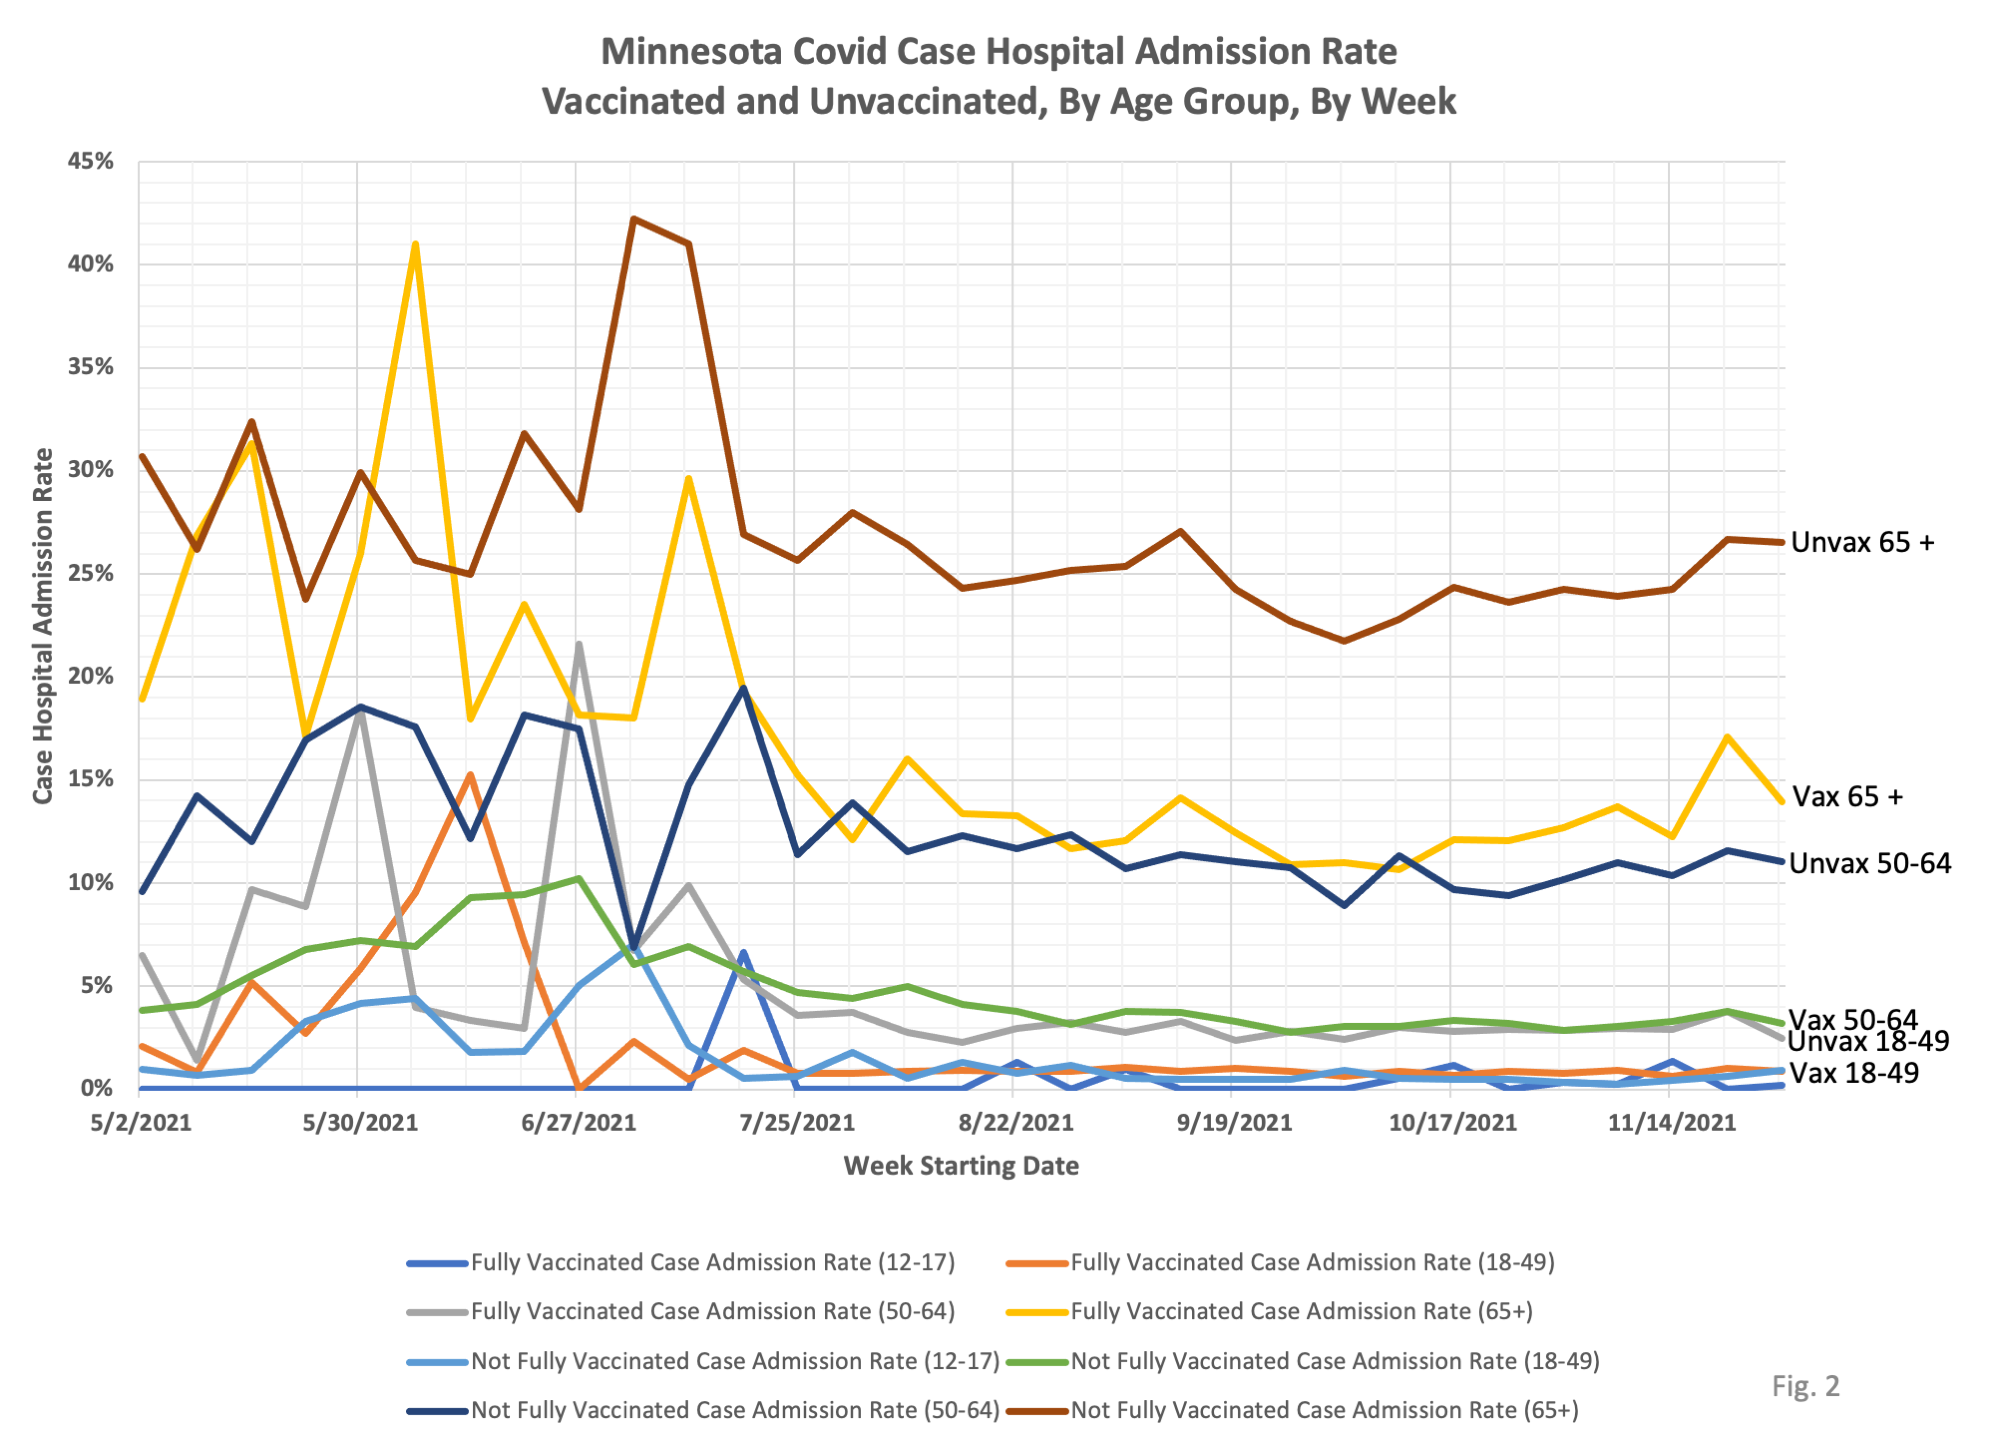
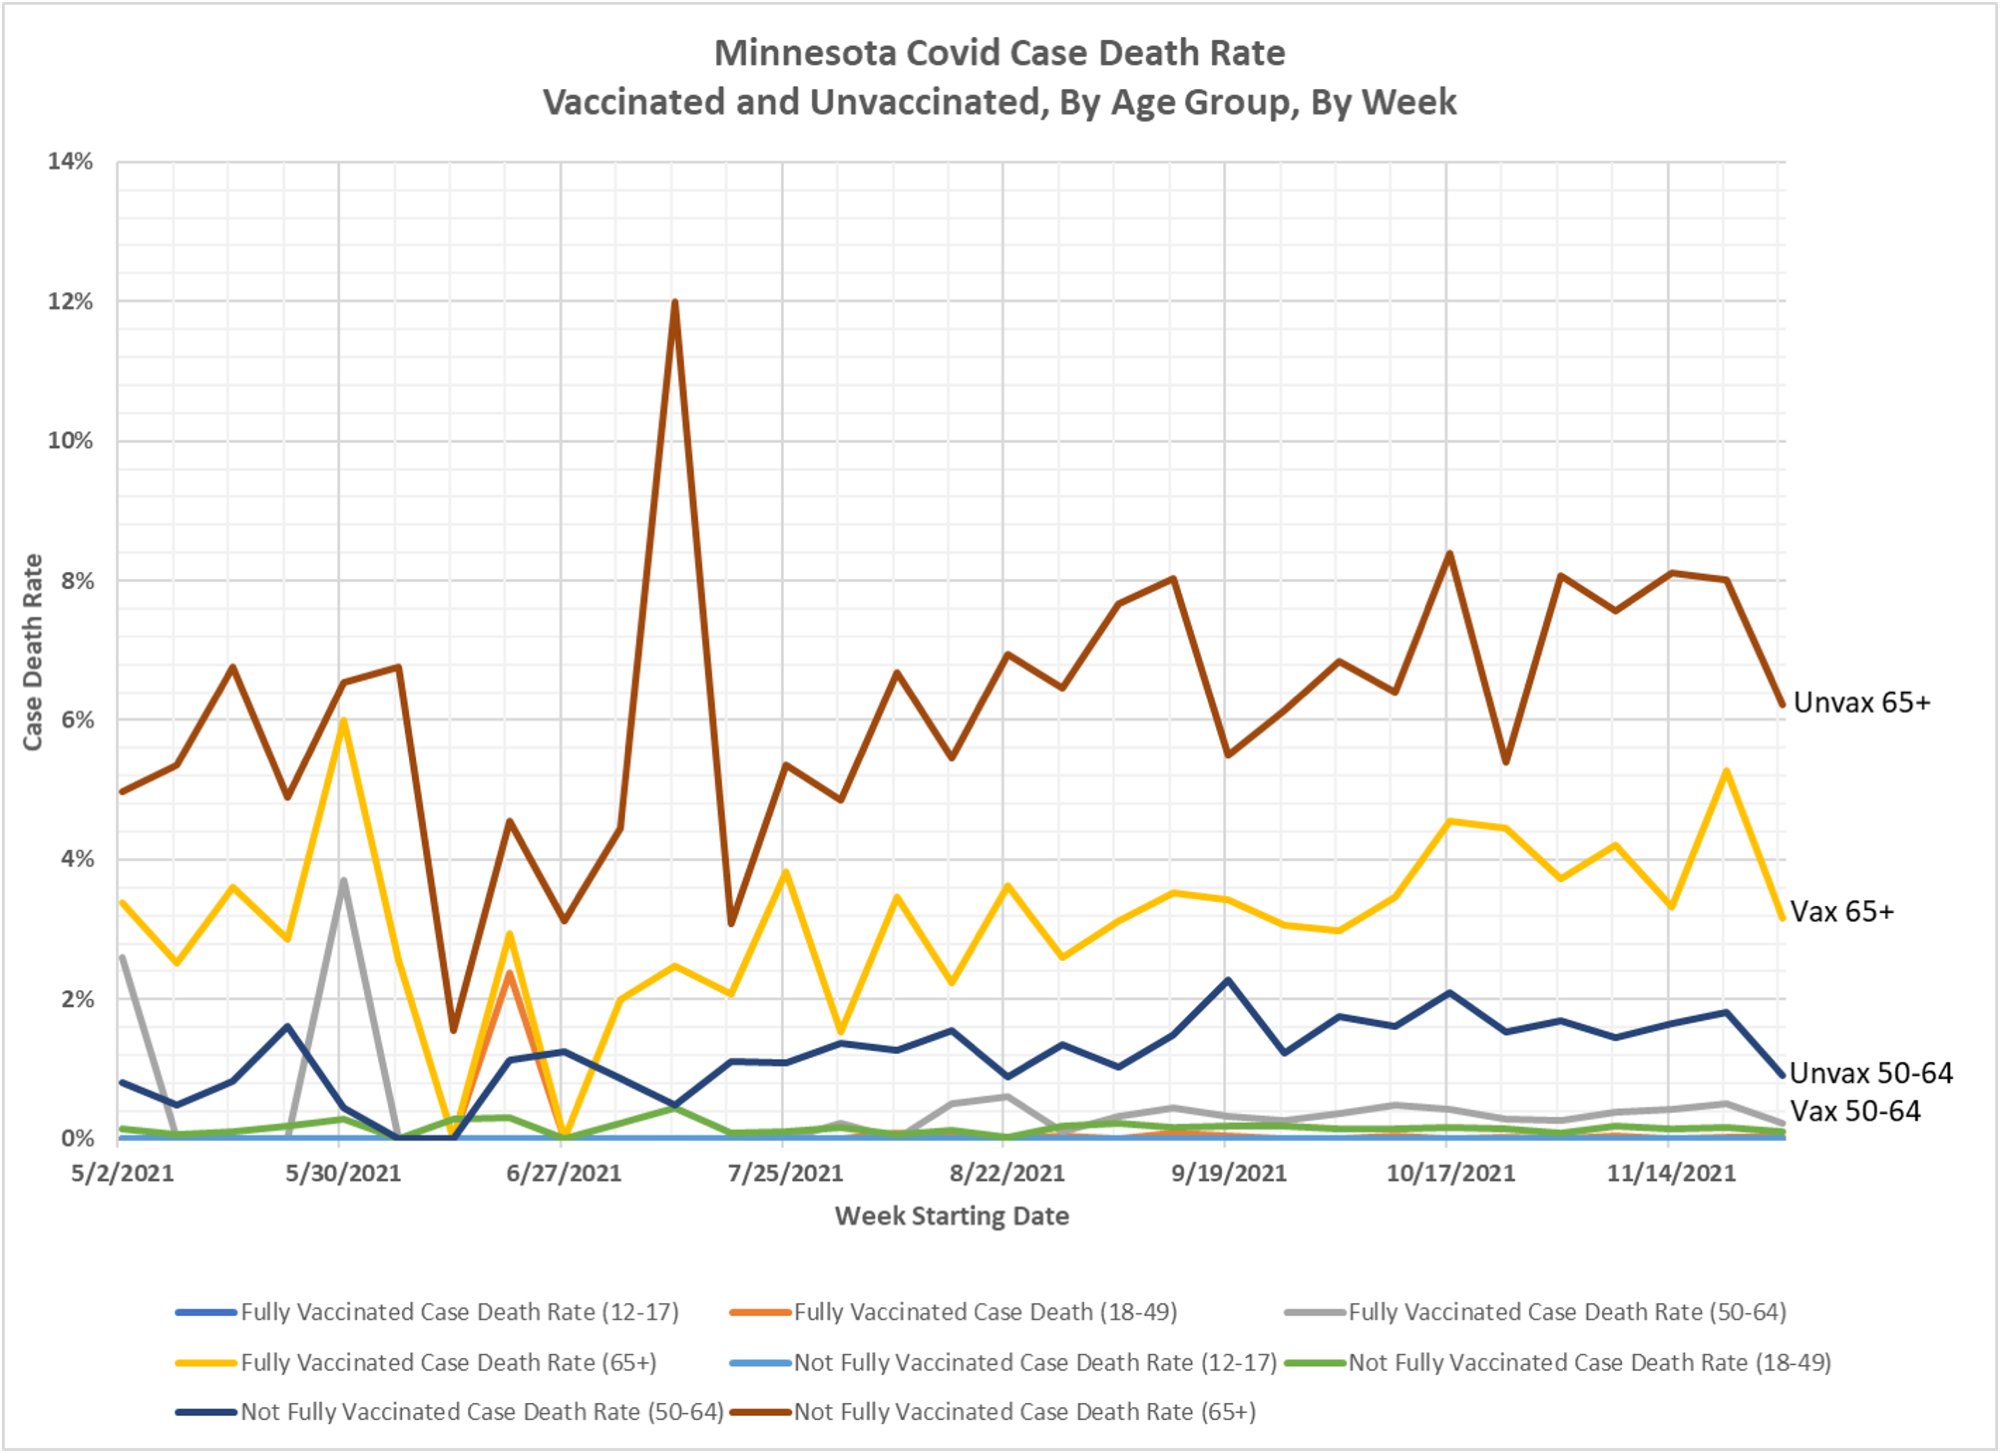
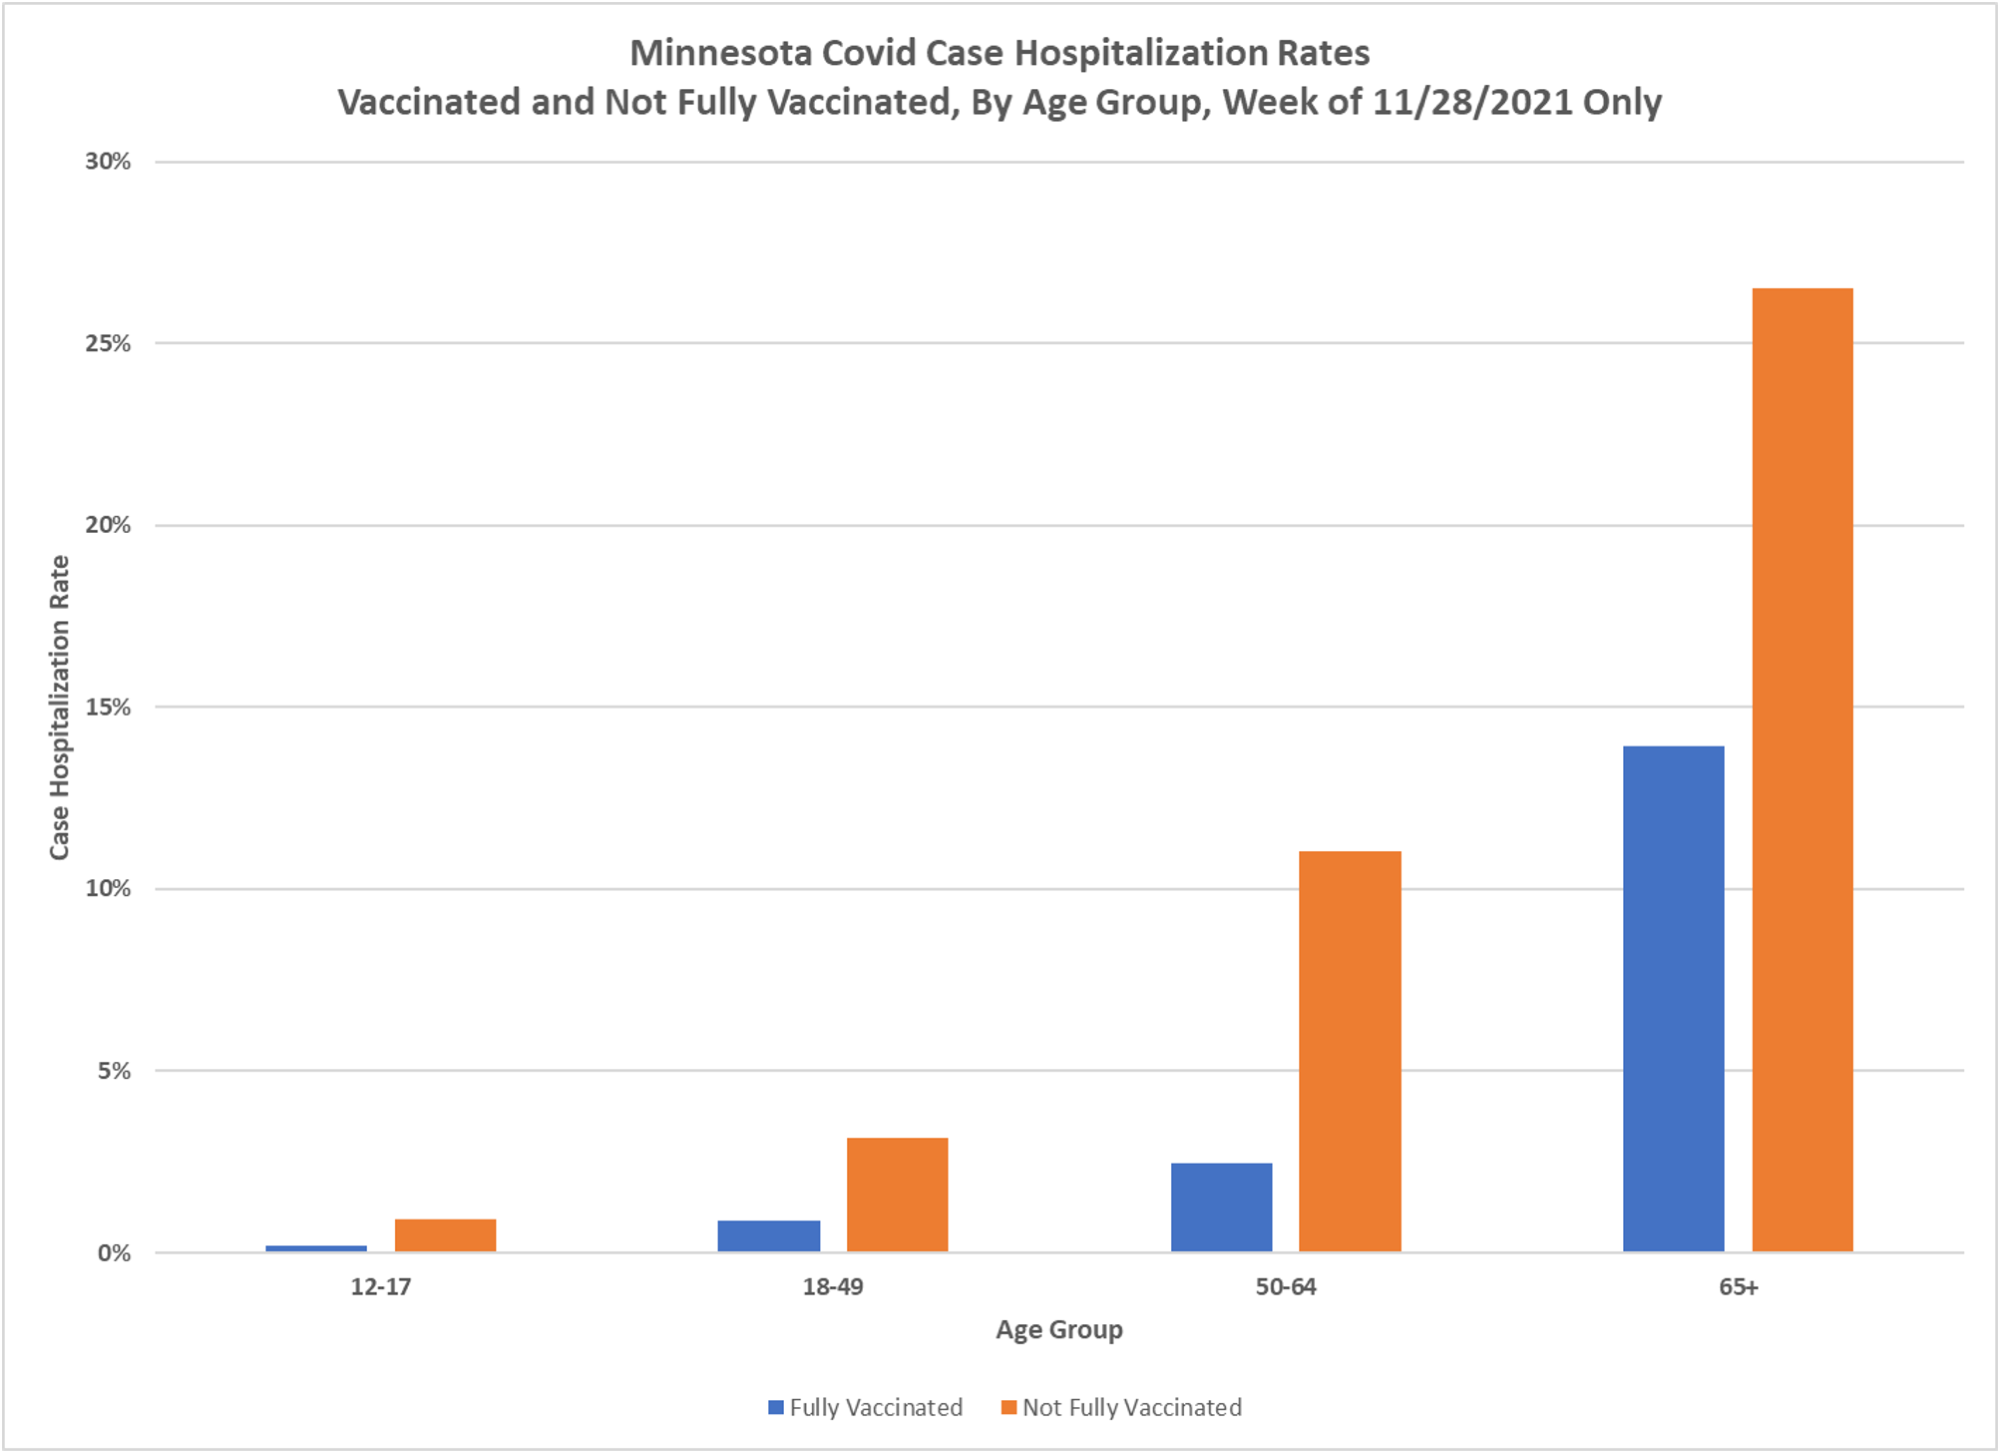
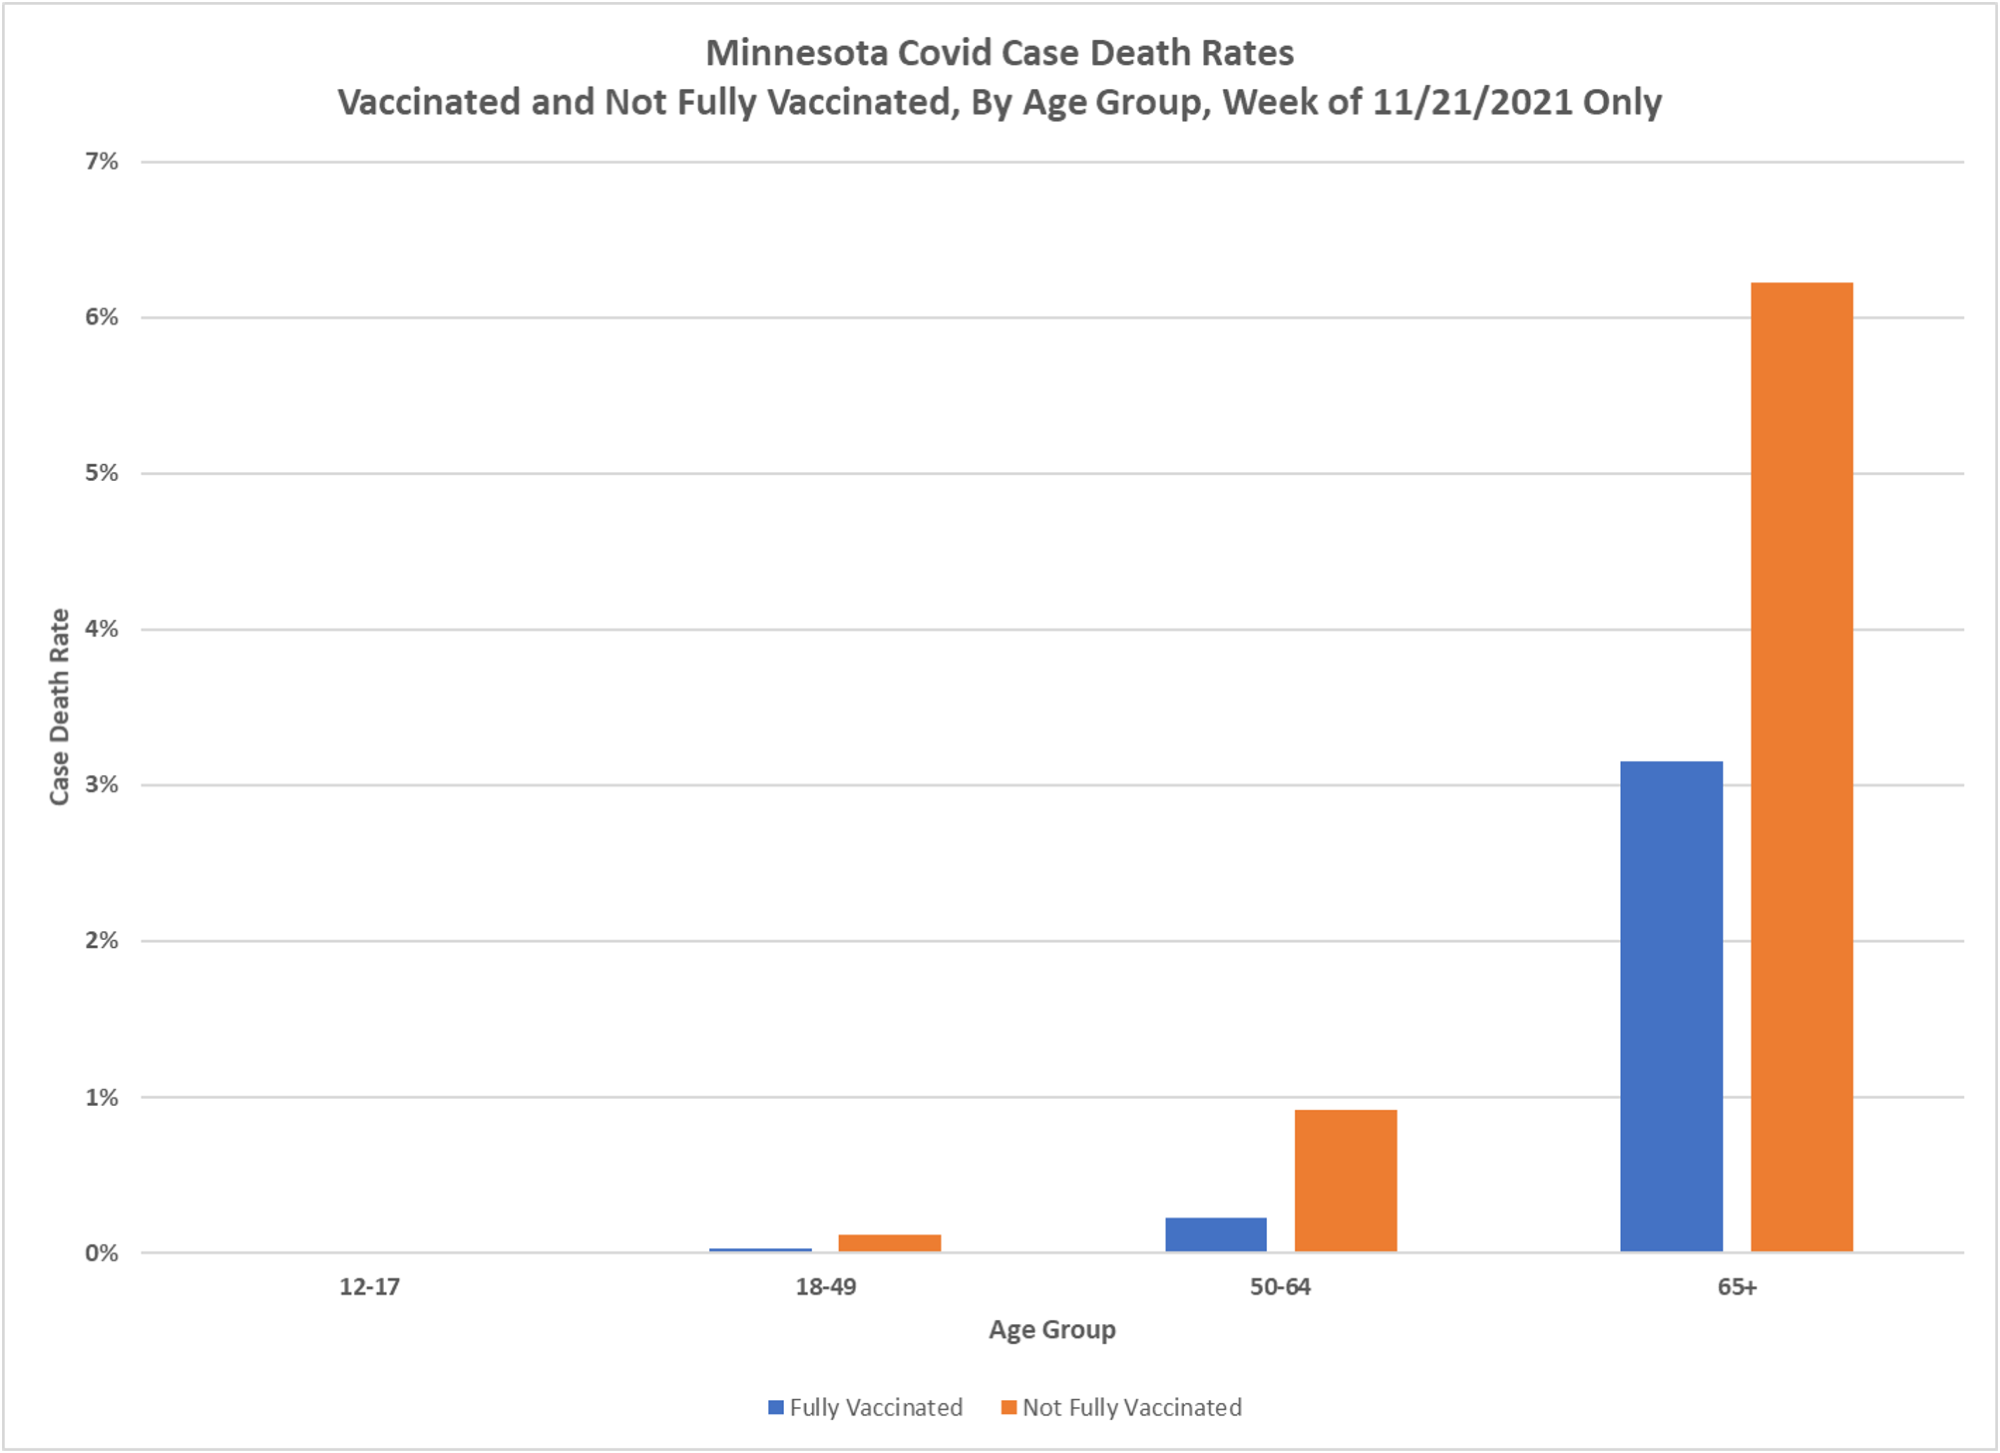
The charts below look at a Minnesota Department of Health (MDH) data set a couple different ways. Fig. 1 shows the cumulative case hospital admissions rates and cumulative case death rates for vaccinated and unvaccinated people by age group, over the time period data is provided for (5/02/2021 thru 12/04/2021 specimen collection dates). Figures 2 and 3 show the case hospitalization rates and case death rates over time on a week by week basis. Figures 4 and 5 shows the relative data for the most recent week we have data for, the week starting 11/28/2021. Figures 4 and 5 are simply another representation for the right end of the curves on Figures 2 and 3.
2. The source for this data is the MDH Vaccine Breakthrough Weekly Update https://www.health.state.mn.us/diseases/coronavirus/stats/vbt.html which is updated every Monday. In the notes under the graphic “Cases, Hospitalizations, and Deaths Over Time” MDH publishes an Excel file of the underlying data here: https://www.health.state.mn.us/diseases/coronavirus/stats/vbtaarates.xlsx . This data file contains rates per 100,000 for cases, hospitalizations, and deaths. In order to calculate case rates we must first calculate the actual cases, hospitalizations, and deaths that these rates represent. Cases, hospitalizations, and deaths are found by multiplying the rates per 100,000 times the vaccinated population of each age group, and then dividing by 100,000. The vaccinated population for each age group is defined as those who completed their vaccine series at least 14 days prior to the start of the week, from the MDH Vaccine Data web page, where the “People Vaccinated by Age data file is published: https://mn.gov/covid19/assets/People%20Vaccinated%2C%20By%20Age_tcm1148-513634.csv
3. Cases, hospitalizations, and deaths among the unvaccinated are found by multiplying the unvaccinated rates per 100k by the unvaccinated population, and then dividing by 100,000. The unvaccinated population is calculated by subtracting the vaccinated population from the total population of each age group, taken from the US Census American Community Survey 5 year data table S101 for Minnesota available by searching here: https://data.census.gov/cedsci/table. MDH has informed us that the ACS 5-year survey is the correct population data source.
4. Once the cases, hospitalizations, and deaths are calculated, the hospitalization and death case rates are found by dividing the hospitalizations and deaths by cases for each group and time period.
5. The key takeaway from Fig. 1 is that for all age groups the not fully vaccinated are much more likely to be hospitalized than the vaccinated, once testing positive. The rows highlighted blue are the vaccinated and unvaccinated hospitalizations rates. Similarly, the case death rates for the unvaccinated are much higher than for the vaccinated, as seen in the peach colored rows.
6. Also note in Figure 1 that the cases for the Fully Vaccinated 65+ are much larger than for the Not Fully Vaccinated over the 5/02/2021 to 12/04/2021 time period, calculating cases from the provided case rates. Even though the Not Fully Vaccinated have a much higher chance the testing positive than the vaccinated, the much larger 65+ vaccinated population causes the 65+ vaccinated cases to be higher than the Not Fully Vaccinated cases. This seems perhaps a little counterintuitive, but if MDH would provide data in response to several of our Data Practice Act requests we could more fully confirm this finding.
7. Figures 2 and 3 show how the case hospitalization and case death rates change week to week. Note that when testing rates are low, and fewer asymptomatic positives are found, then that may tend to increase the rates, as seen for June and July 2021. Some irregularities, like the 12% case death rate for the unvaccinated 65+ age group the week of 7/11/2021 are likely data anomalies.
8. Figures 4 and 5 display all of the rates for the most recent week we have data, the week starting 11/28/21. These are a good visual representation of the relative rates, and therefore risks, between the vaccinated and unvaccinated, and between the age groups. It is not clear why the data shows the vaccinated 12-17 year old age group was more likely to be hospitalized than the unvaccinated. It is likely that many young people are asymptomatic positives and therefore never tested, which would tend to lower the unvaccinated case rate.
9. The rates presented here should be considered indicative, and not actual representations of the true rates. Attempts to reconcile this data with other MDH data sets consistently yields discrepancies of roughly +/- 10%, likely due to differences in the vaccinated and unvaccinated populations used in this analysis vs. that used by MDH. In addition, there are numerous sources of errors, such as people who are positive without being tested, people who were vaccinated in jurisdictions which don’t share data with MDH, etc.

Many have noted this, but it remains striking how, after almost 2 years, fractional outcomes across age groups remain very similar to what was found from the cruise ship experiences, prior to any mitigation measures.
I’m going to take a slight issue with footnote #6. It doesn’t seem a little counter-intuitive to me at all. The 65+ group is the group most likely to have multiple visits to doctors, especially the vaccinated 65+. So they are getting tested more often. The more you get tested, the better your chance of a positive test.
The bottom line is the more data you get from the DOH, the more suspect you will find it to be. The data is garbage because the approach to collecting it was garbage. The quick tests are garbage, and there it gets muddied by testing the symptomatic and the asymptomatic. It will never be clean; the best one can do is take the crummy data and run in through some models and see which model closest resembles reality. The problem with that is the model may only be circumstantially correct – it may never be correct again.
We all know the NIH, Bill Gates’ foundation, Johns Hopkins, etc. all engaged in some simulated pandemic run-throughs five years ago. If they couldn’t tell from that run-through that the data collection was this chaotic, they were either stupid, lazy, or arrogant (and likely all three). I’m sure there were people on the team(s) that pointed it out and they were summarily dismissed. And I’d bet these alpha tests assumed a pandemic of a fairly constant virus rather than a quickly mutating virus.
I’ve worked in IT for 35 years. I’ve worked on my share of successful projects as well as my share of disastrous failures. The failures all had one thing in common: arrogant mandates from on high. There’s a reason we’ve known for millennia that hubris is the deadliest of sins. But the arrogant can only learn the hardest way if they can learn at all.
Assuming my math is correct for the 65+ age group
an unvaxed person is approx 10x -11x more likely to die from covid than a vaxed person
Assuming 90% vaxed rate for the 65+age group (plus or minus a few percentage points)
873/.9 = 970
1055/.1 = 10,550
10550/970 = 10.88x
similar math results for hospitalizations
I think the case rate table post gives that information as directly as pssible from the Mn data
So you probably have to use the case rate post and the post on relative rates of infections among the vaxed and unvaxed and reinfected. Some probability multiplying in there, I suspect. And the timing may be a little disjunctive. But I suspect you are directionally accurate
Sorry to see the state stonewalling your requests. And the data you are getting is garbage because the DOH want it to be really, really difficult to get to any kind of statistical conclusion. DOH would much rather you just take their word for it. Rob above suggested hubris at work, and hubris is almost always followed by nemesis. It will be interesting to see what form it takes.
John, the nemesis is the virus itself.
I would say an issue with point number 5 would be… “that for all age groups the not fully vaccinated are much more likely to be hospitalized than the vaccinated, once testing positive.” Would be that the unvaccinated at this point would also be likely to not even get tested, even if mildly symptomatic. Taking this into account would mean that these percentages may not be that much different, and understandably it may be hard to calculate for…