As the whole country freaks out about a cold (it really is called the Moronic variant for a reason) we thought another look at the regional spread might be enlightening. Pretty similar pattern to last year, as you see in the animation. By all accounts, this case wave is not accompanied by a true hospitalization wave, although there are lots of “with” CV-19 hospitalizations. I don’t know, maybe it is just time to ignore this thing, but then I have been suggesting that for a while. Dave’s notes:
Notes:
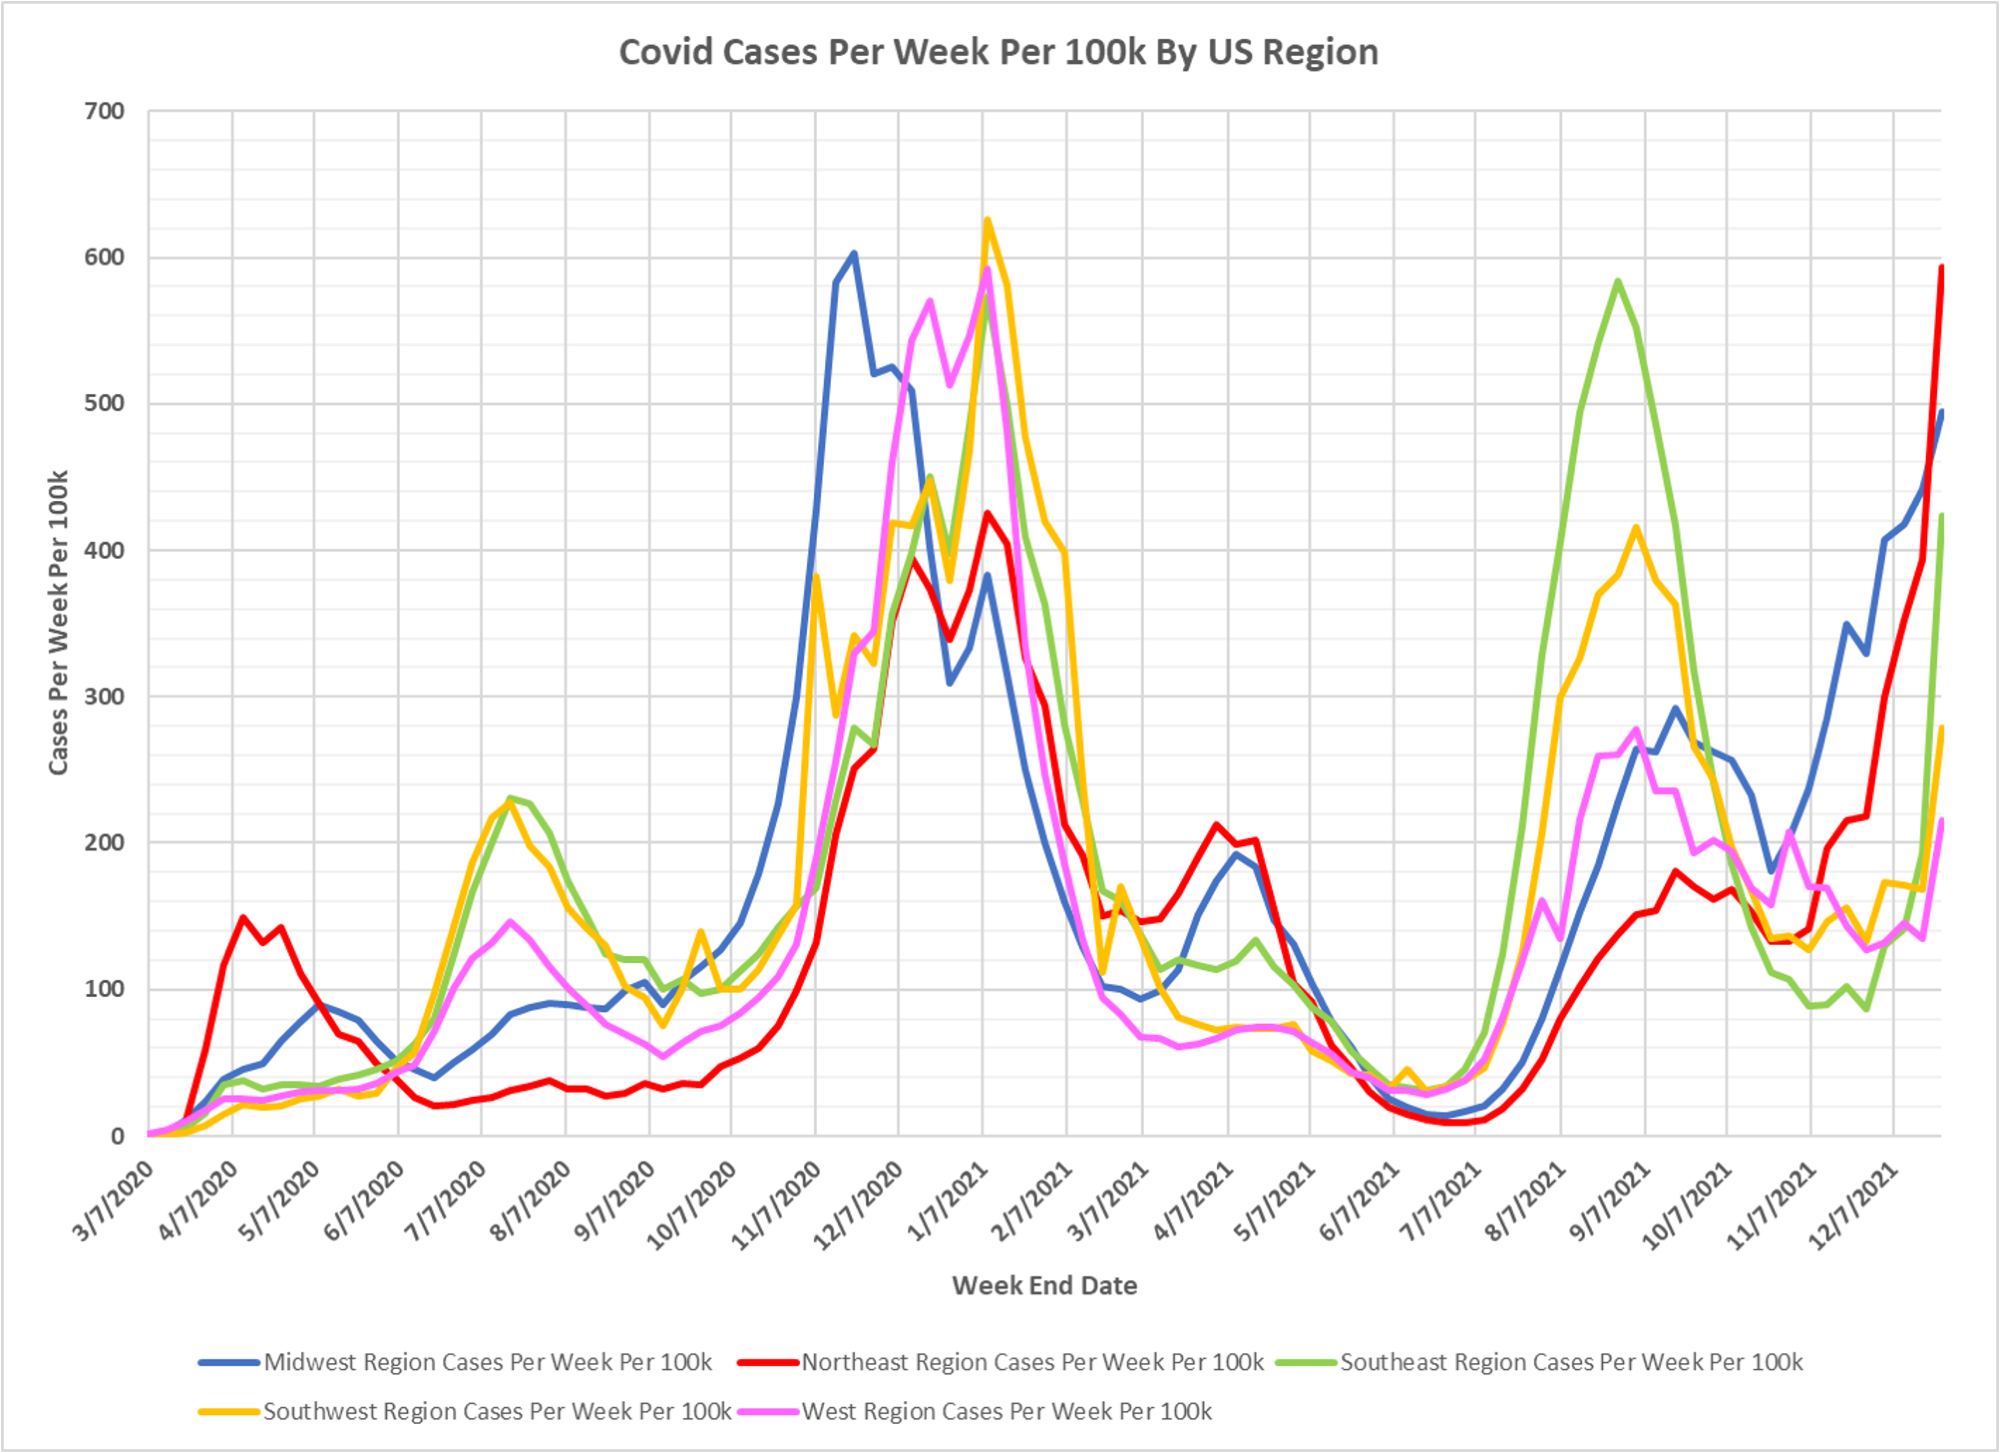
- The chart of US regional cases displays the entire pandemic. The animation of cases per week per 100k starts the week ending 7/03/2021.
- US case data by state is taken from a CDC database: https://data.cdc.gov/Case-Surveillance/United-States-COVID-19-Cases-and-Deaths-by-State-o/9mfq-cb36 , This database appears to be corrupted, especially for California, in early 2021. Therefore, all data for all states prior to 8/1/2021 is the version published by the CDC on 10/24/2021. All data starting 8/1/2021 is the most current available data, published by the CDC on 12/29/2021, plotted to 12/25/2021.
- State population estimates used to calculate rates per 100k are taken from the CDC data file nst-est2019-01.xlsx, available here: https://www.census.gov/newsroom/press-kits/2019/national-state-estimates.html
- The Northeast region currently has the highest case rate per 100k in the US, with all regions experiencing a rapid rise in cases.
- We have not attempted to analyze how tests per region might be affecting the cases per region. It seems clear from news reports that there was a surge in tests leading up to Christmas, and this might contribute to the rise in cases.
- It is striking that there are geographical waves of cases still evident, despite a variety of vaccination rates and government mitigation measures.
- The maximum scale on the animation is 1245.4 cases per 100k per week. This rate occurred the week ending 11/14/2020 in North Dakota, before the start of the this animation.