On Thursday the DOH weekly report comes out and Dave Dixon updates the age structure reports. In regard to hosps and deaths, I believe we may be seeing the effect of boosters. In lower age groups, some randomness as school is out and college students are home. The 20-29 cases may reflect that. Pediatric hospitalizations I don’t trust at all until the DOH gives us clear data on the real reason for admission.
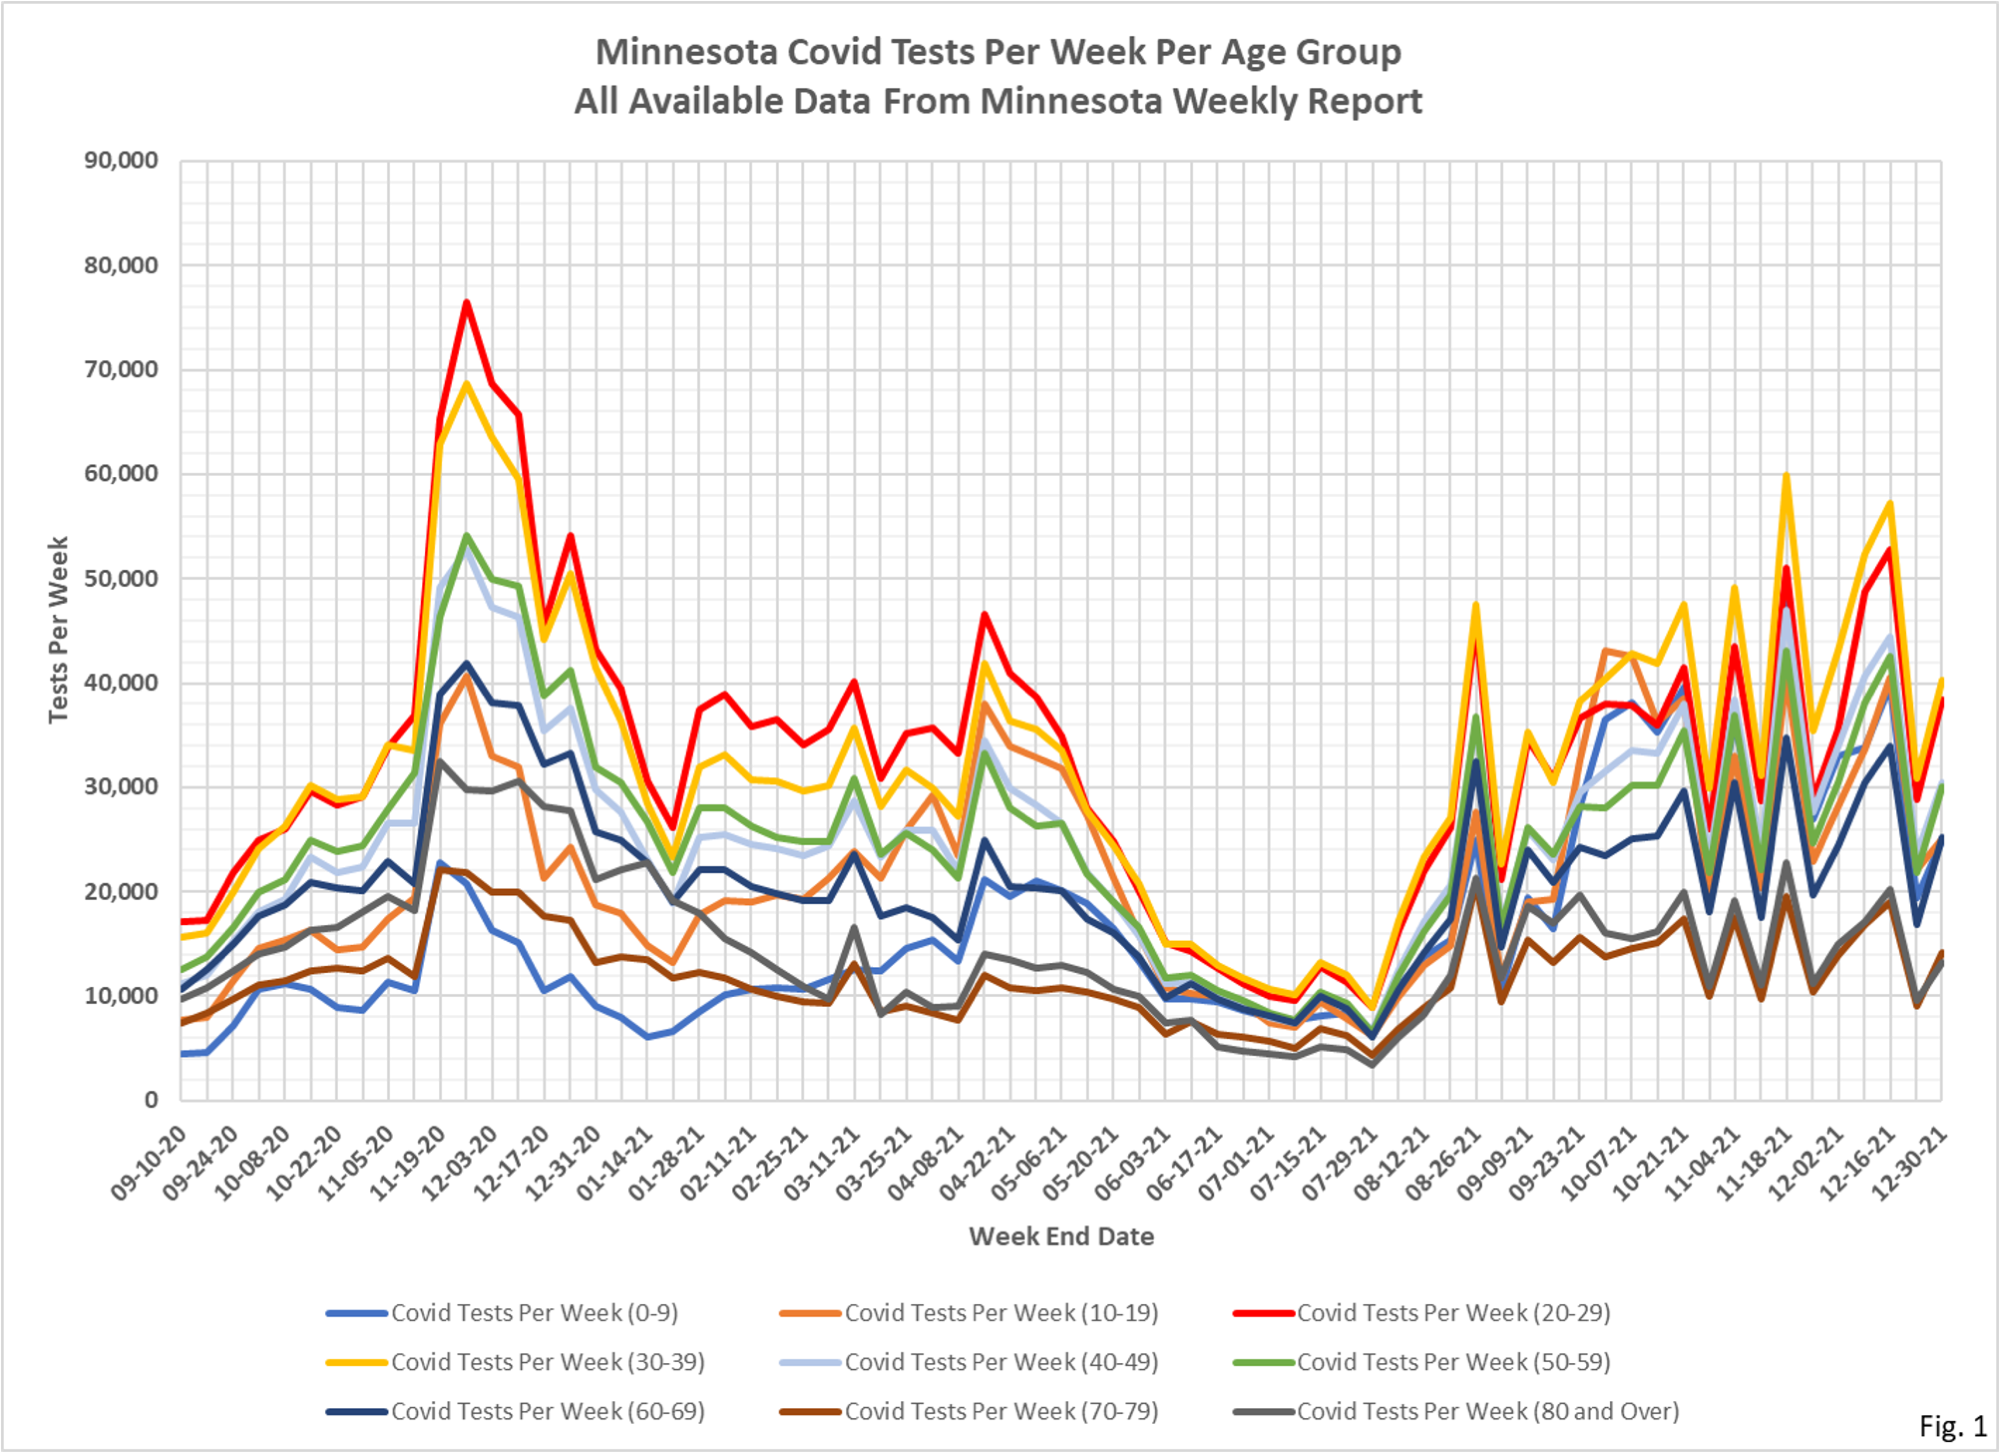
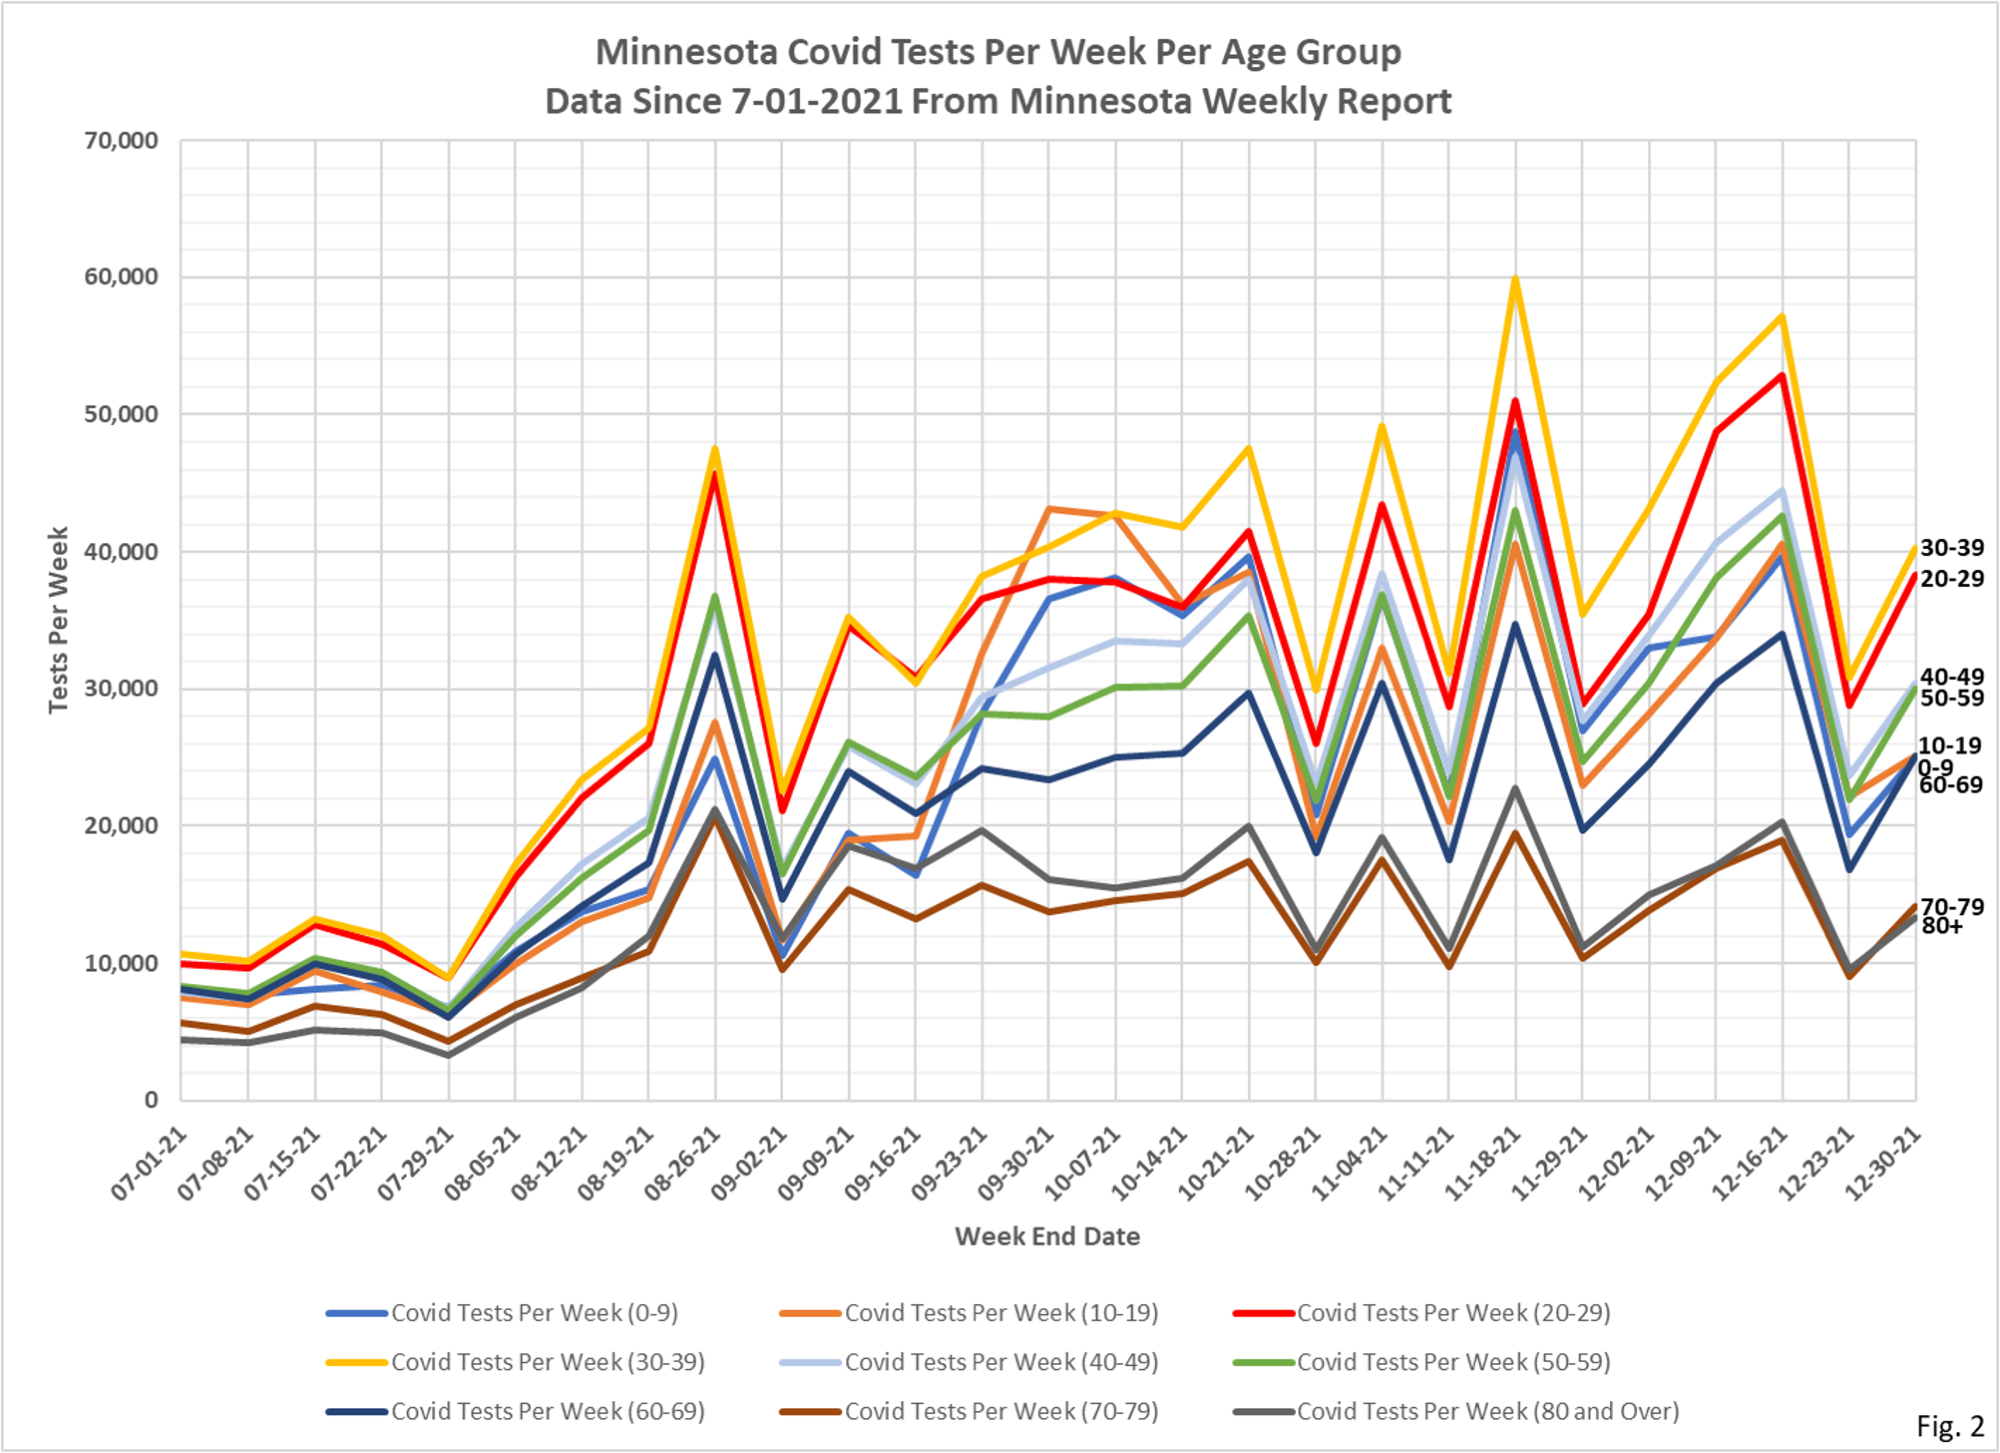
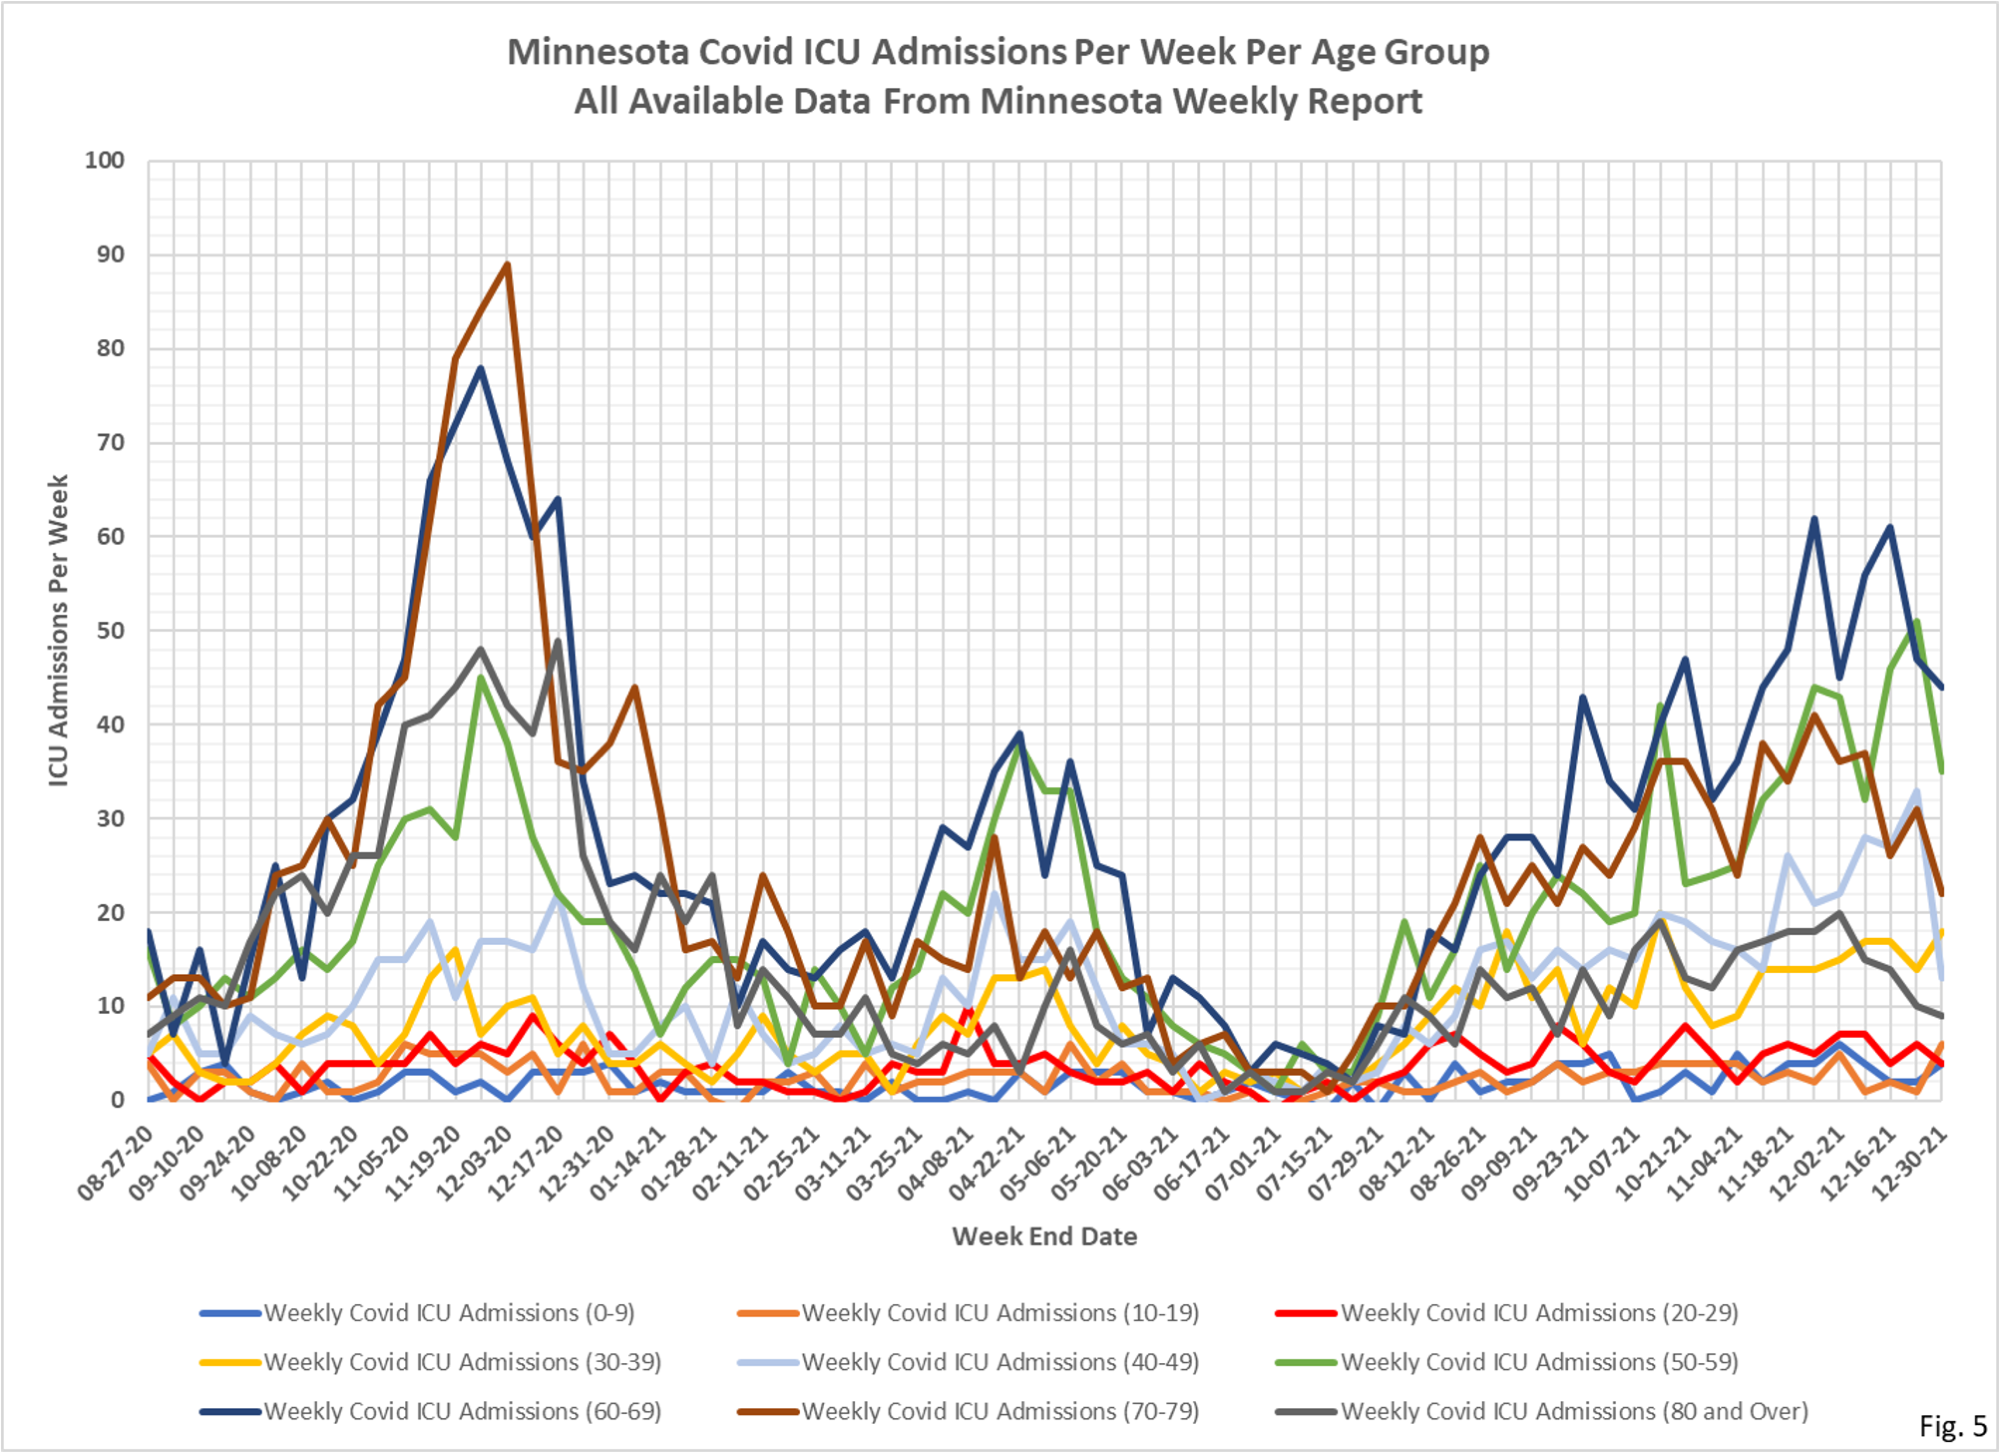
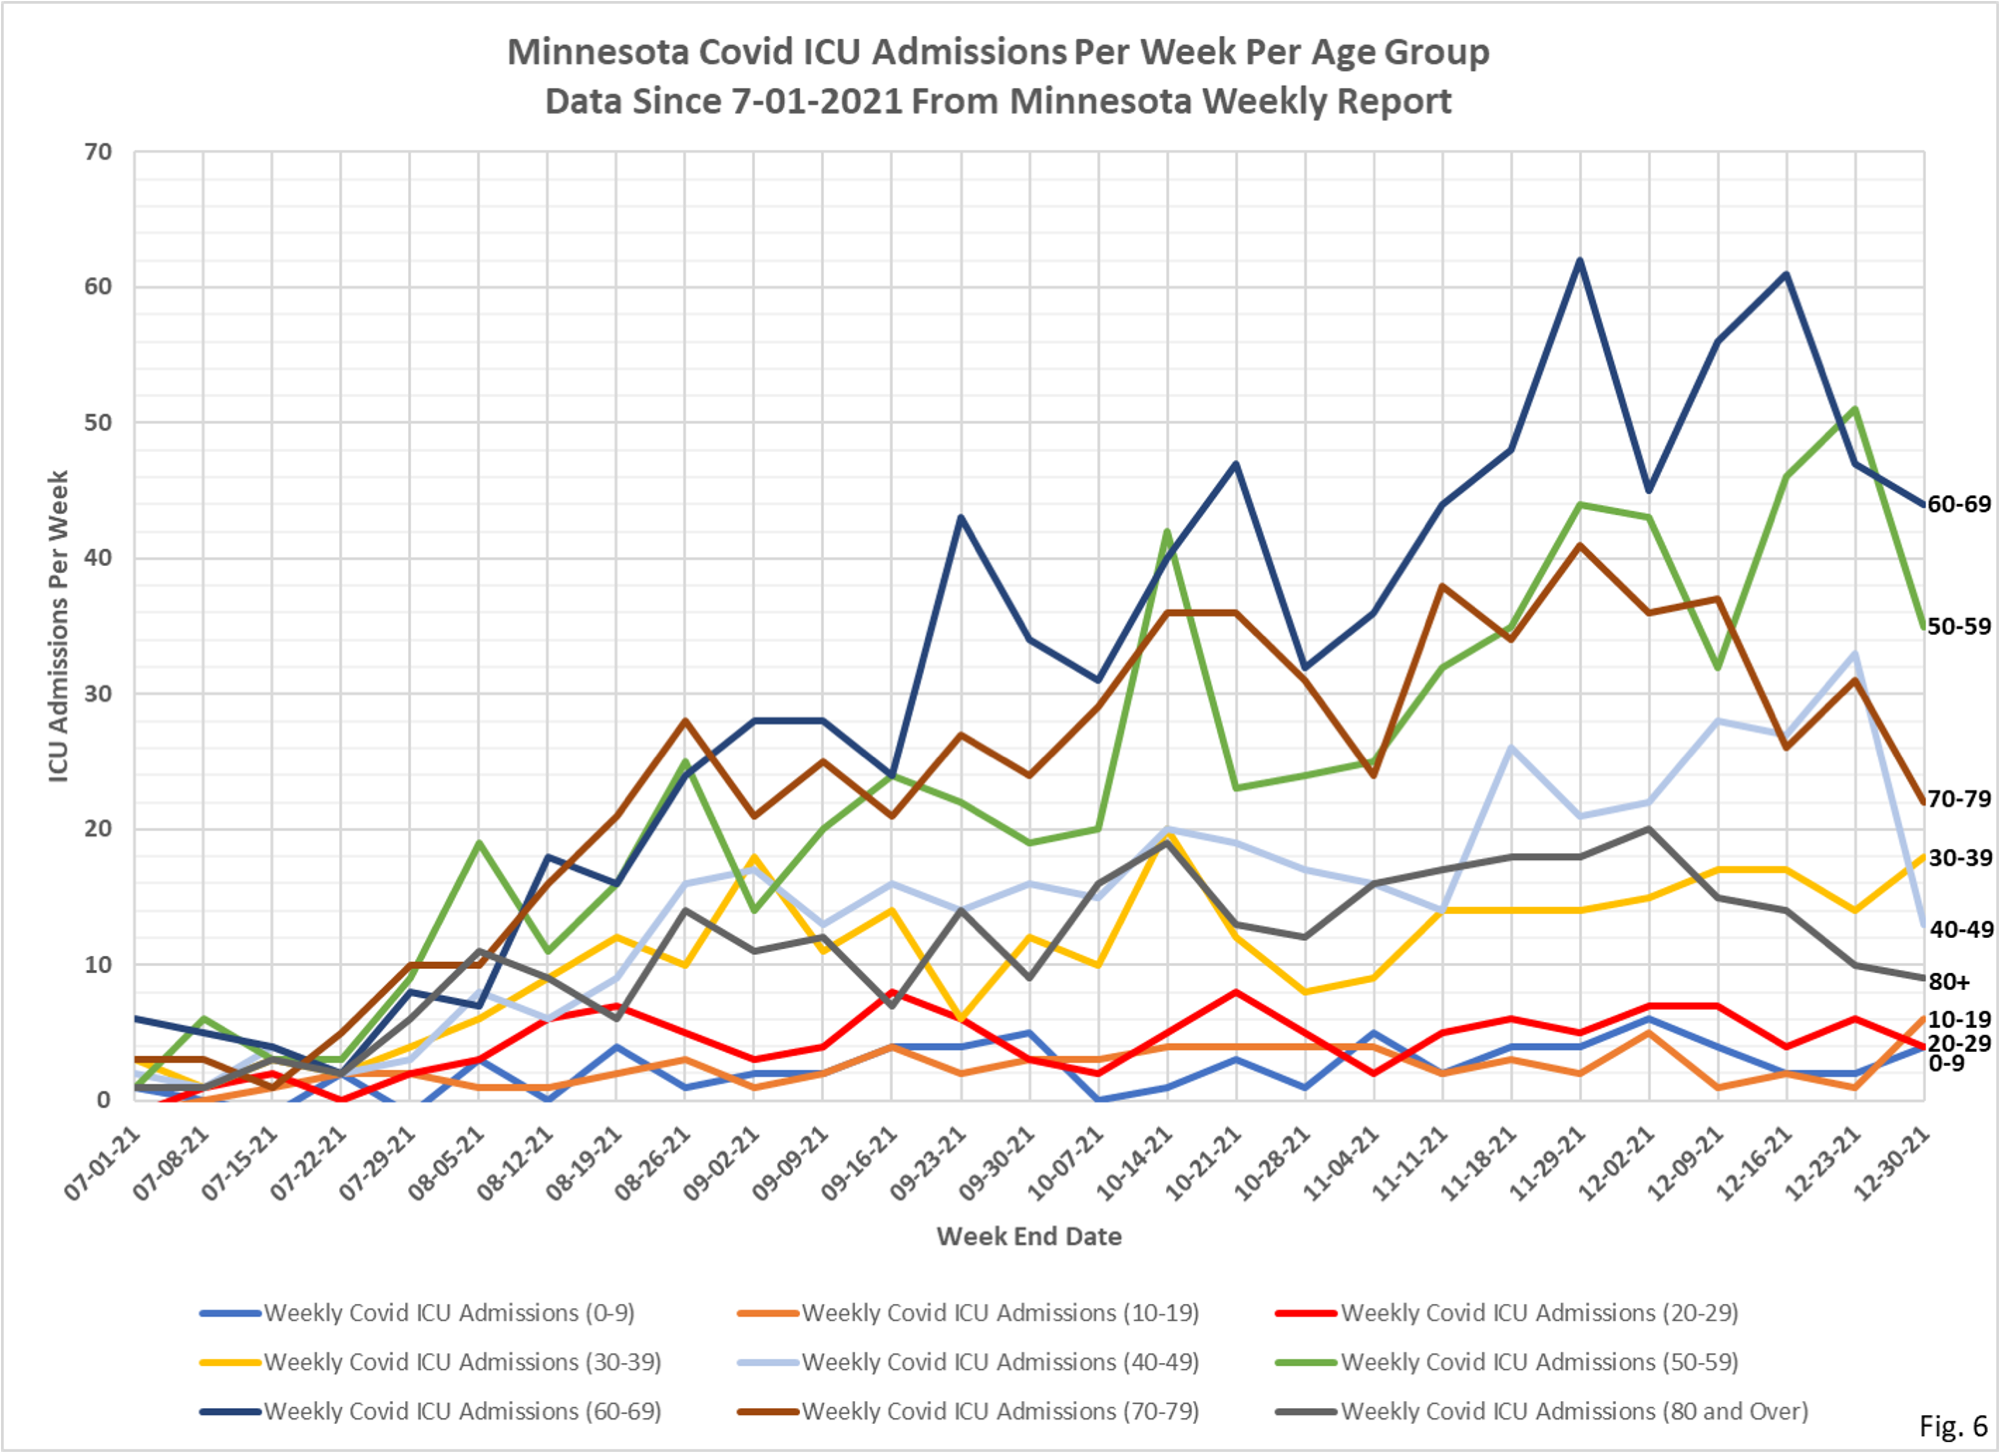
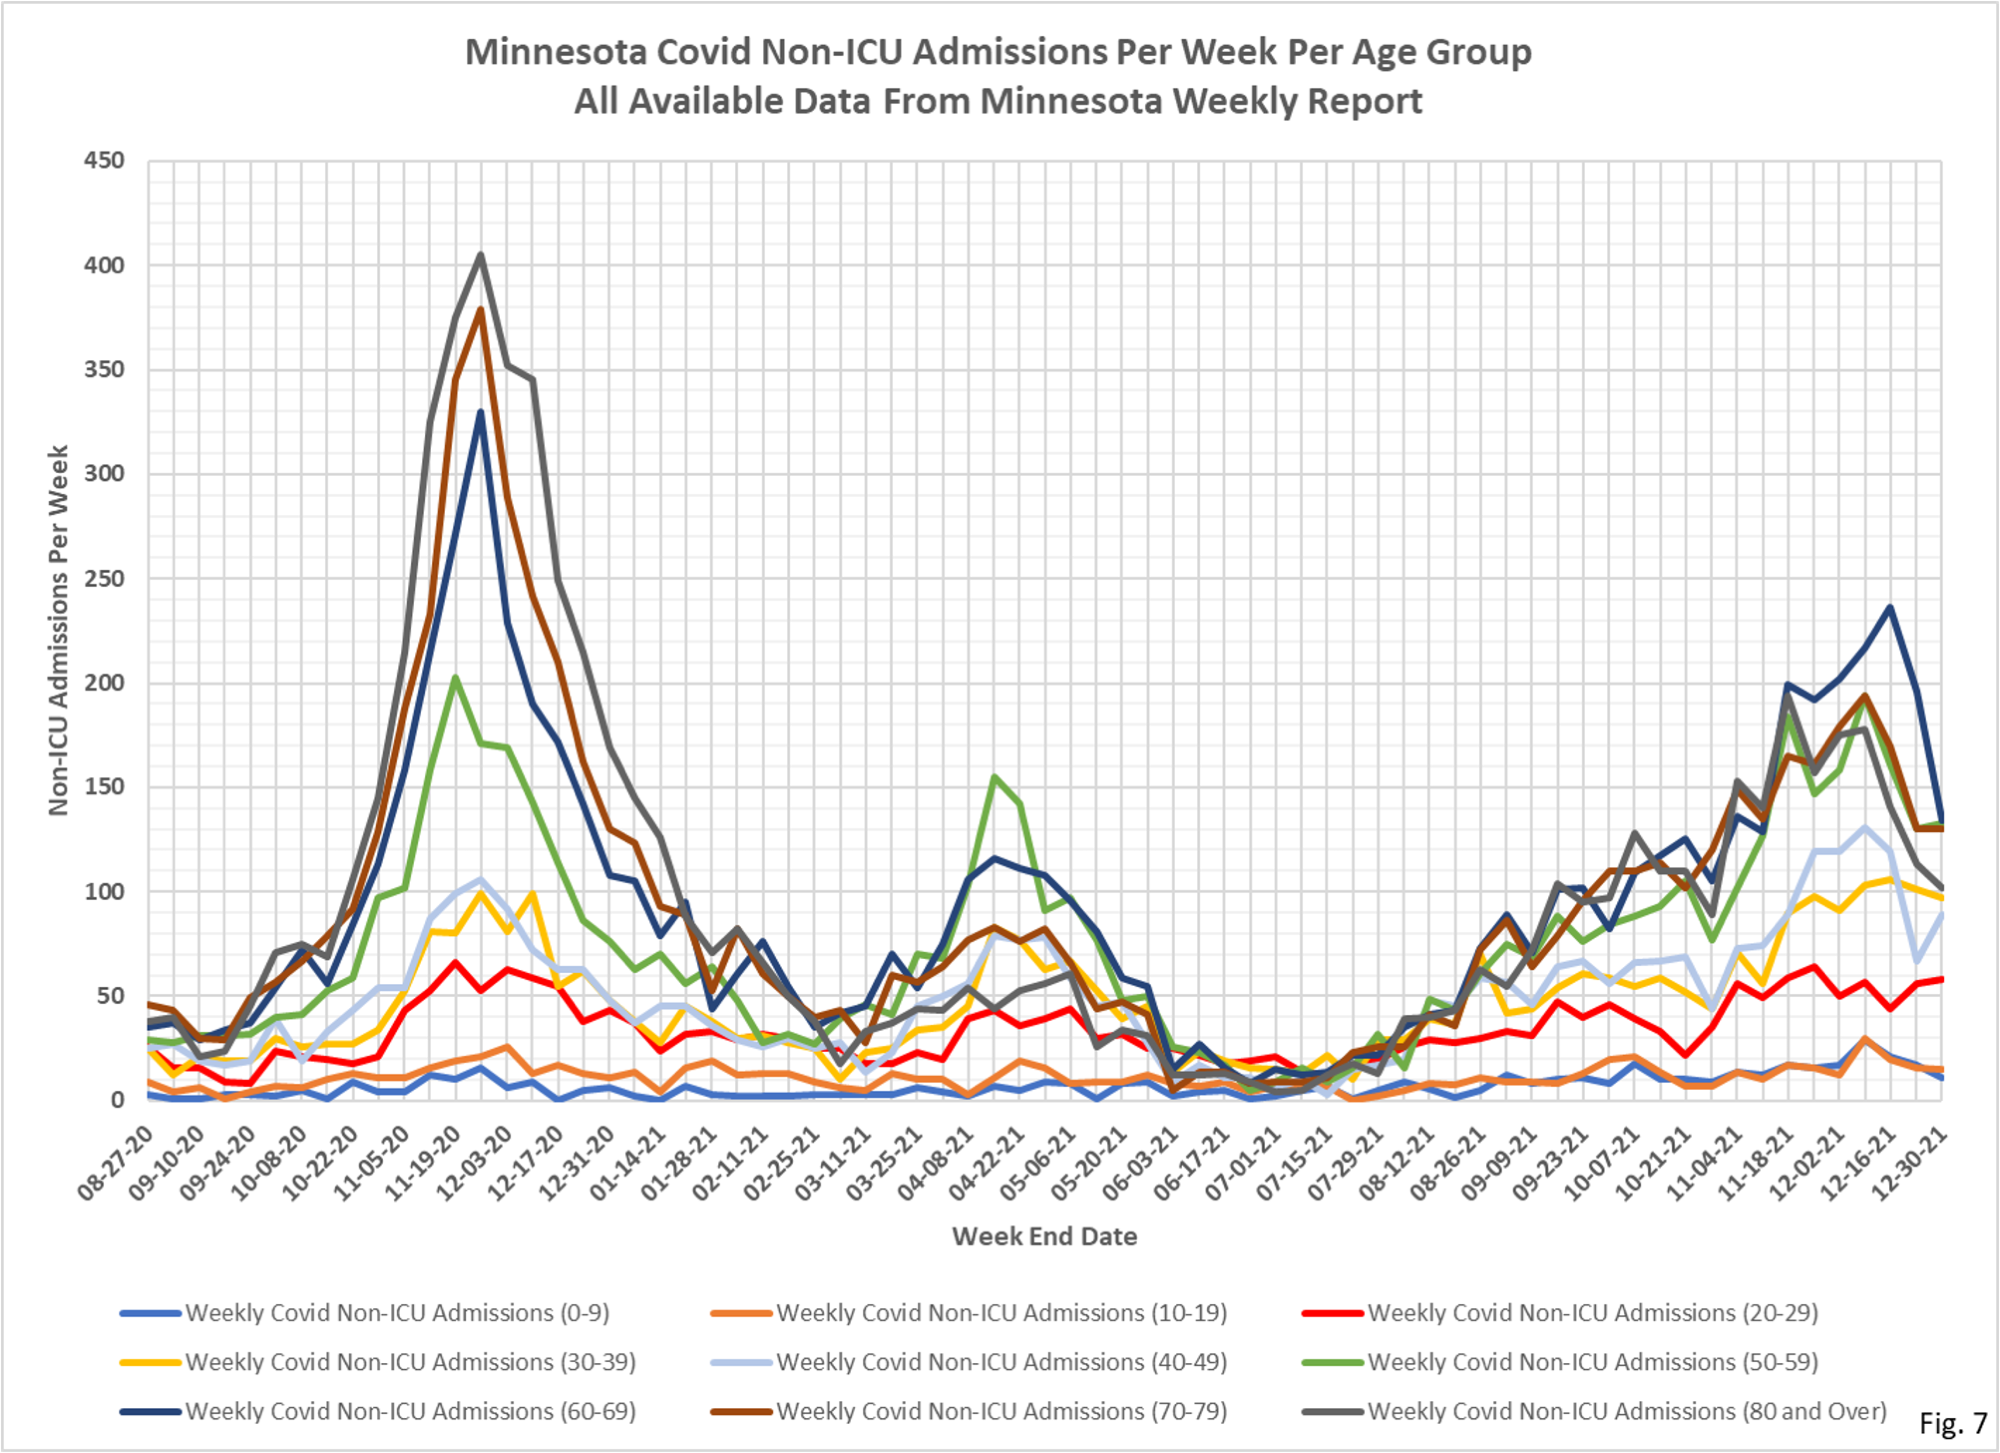
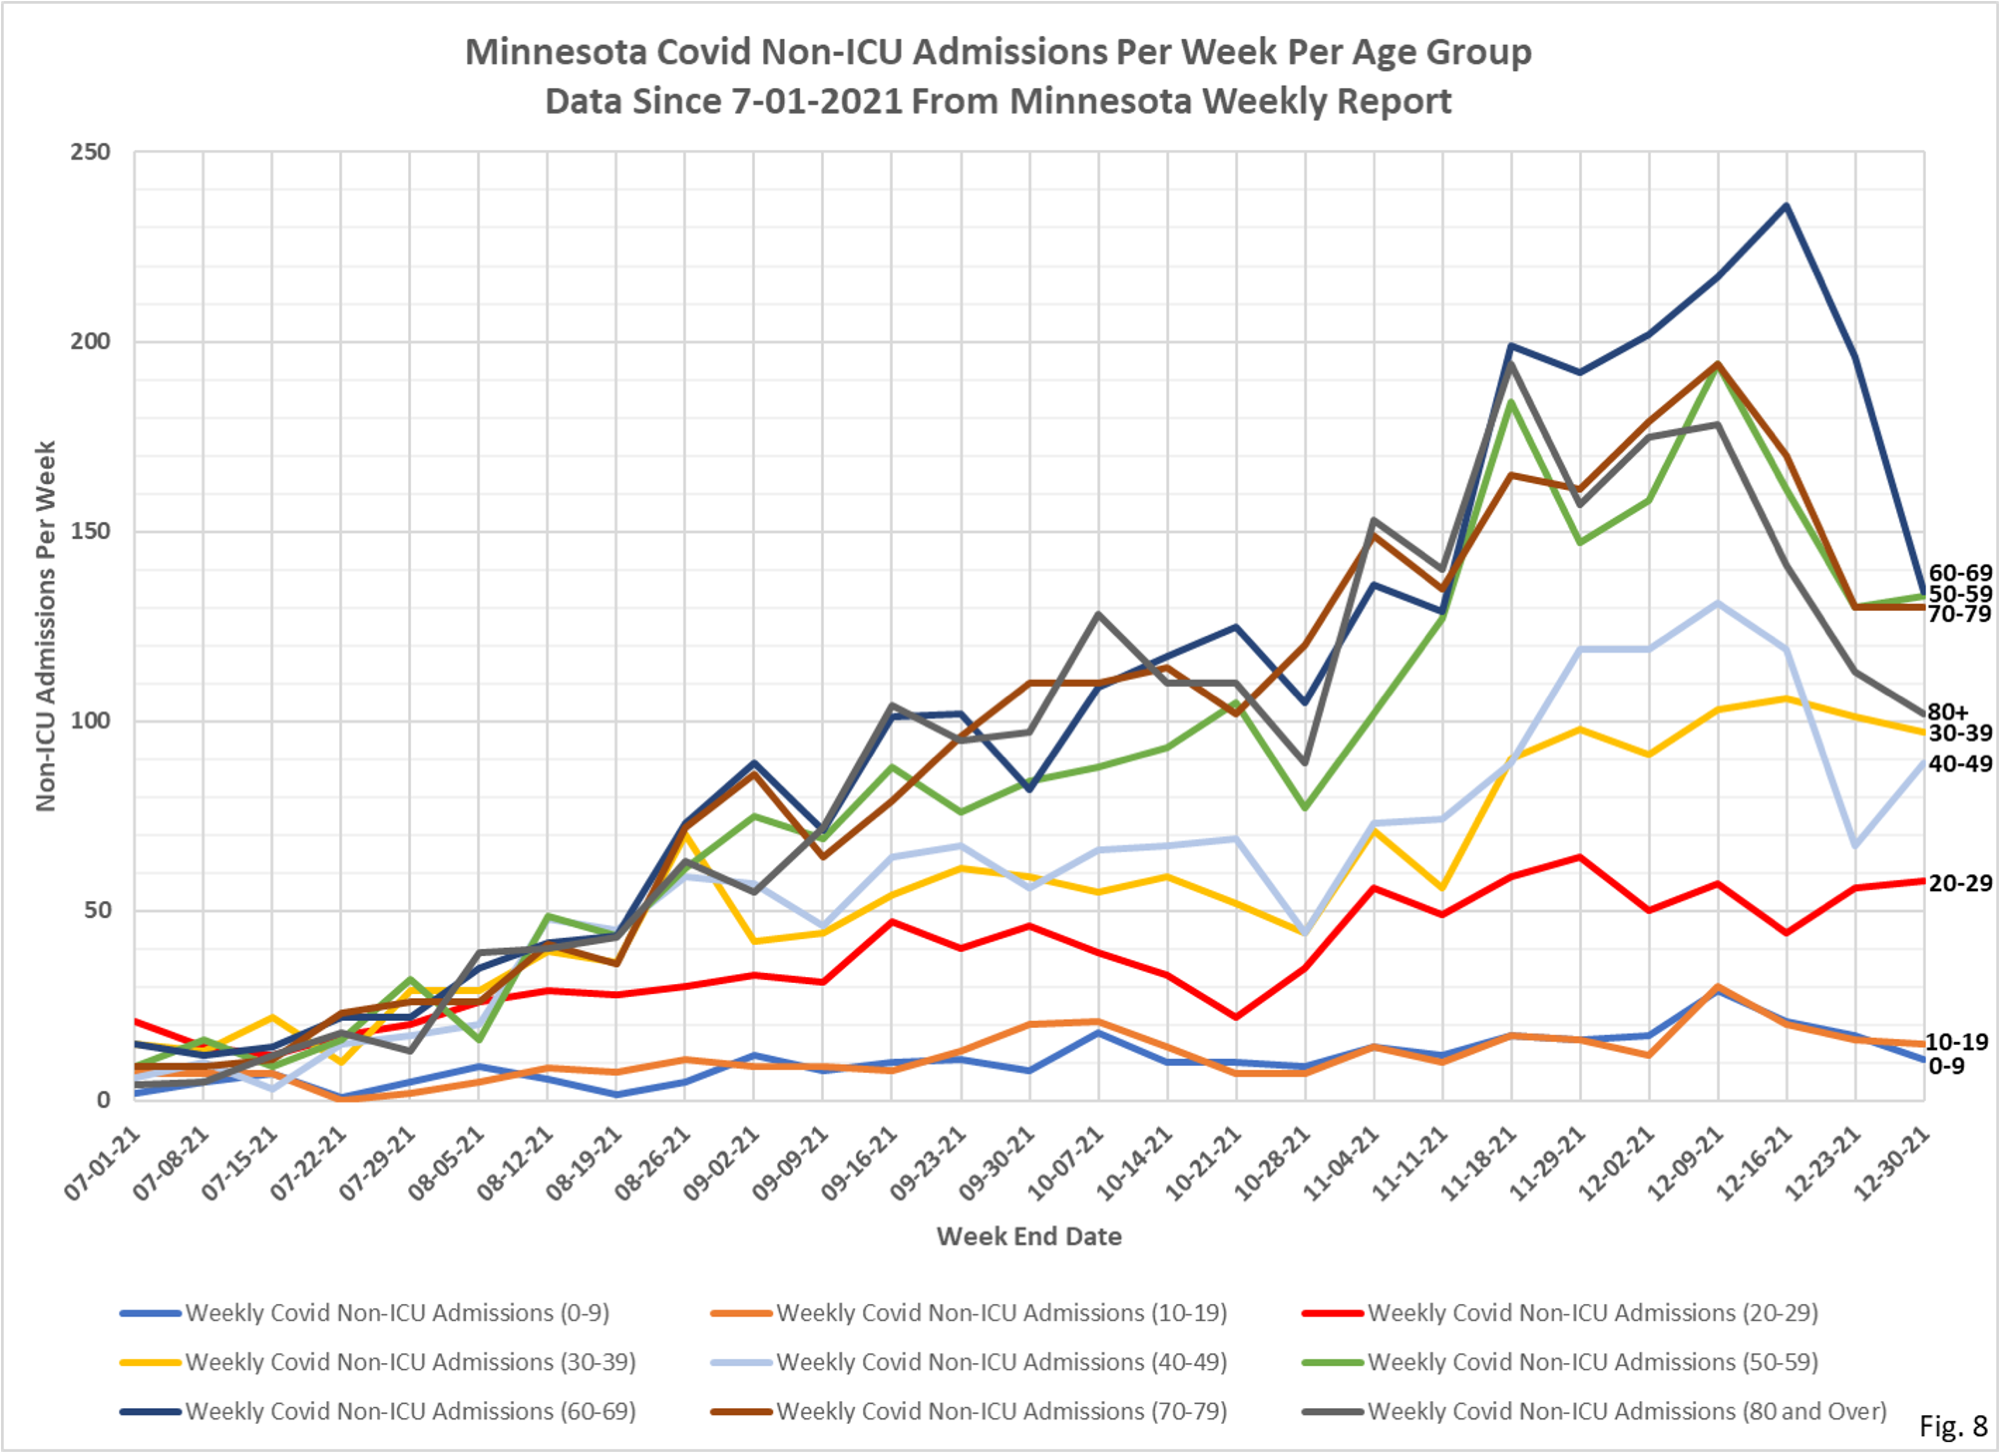
1. There are 2 slides for each set of data, one showing data for the whole pandemic and a second chart showing only data since early July, 2021. Note that the full pandemic slides have different start dates, because Minnesota Department started publishing different data on different dates.
2. The data for the charts on testing, hospital admissions, and deaths comes from the Minnesota Weekly Report (available here: https://www.health.state.mn.us/diseases/coronavirus/stats/index.html). The data in the Weekly Report is presented as cumulative totals for each data type each week. I am taking weekly differences and assembling the data into charts. This data is by date of report, meaning the charts are documenting new events reported this week, even though the underlying event occurred sometime in the past. The data is provided for 5 year age groups, and I am assembling into 10 year age groups to make the charts more readable.
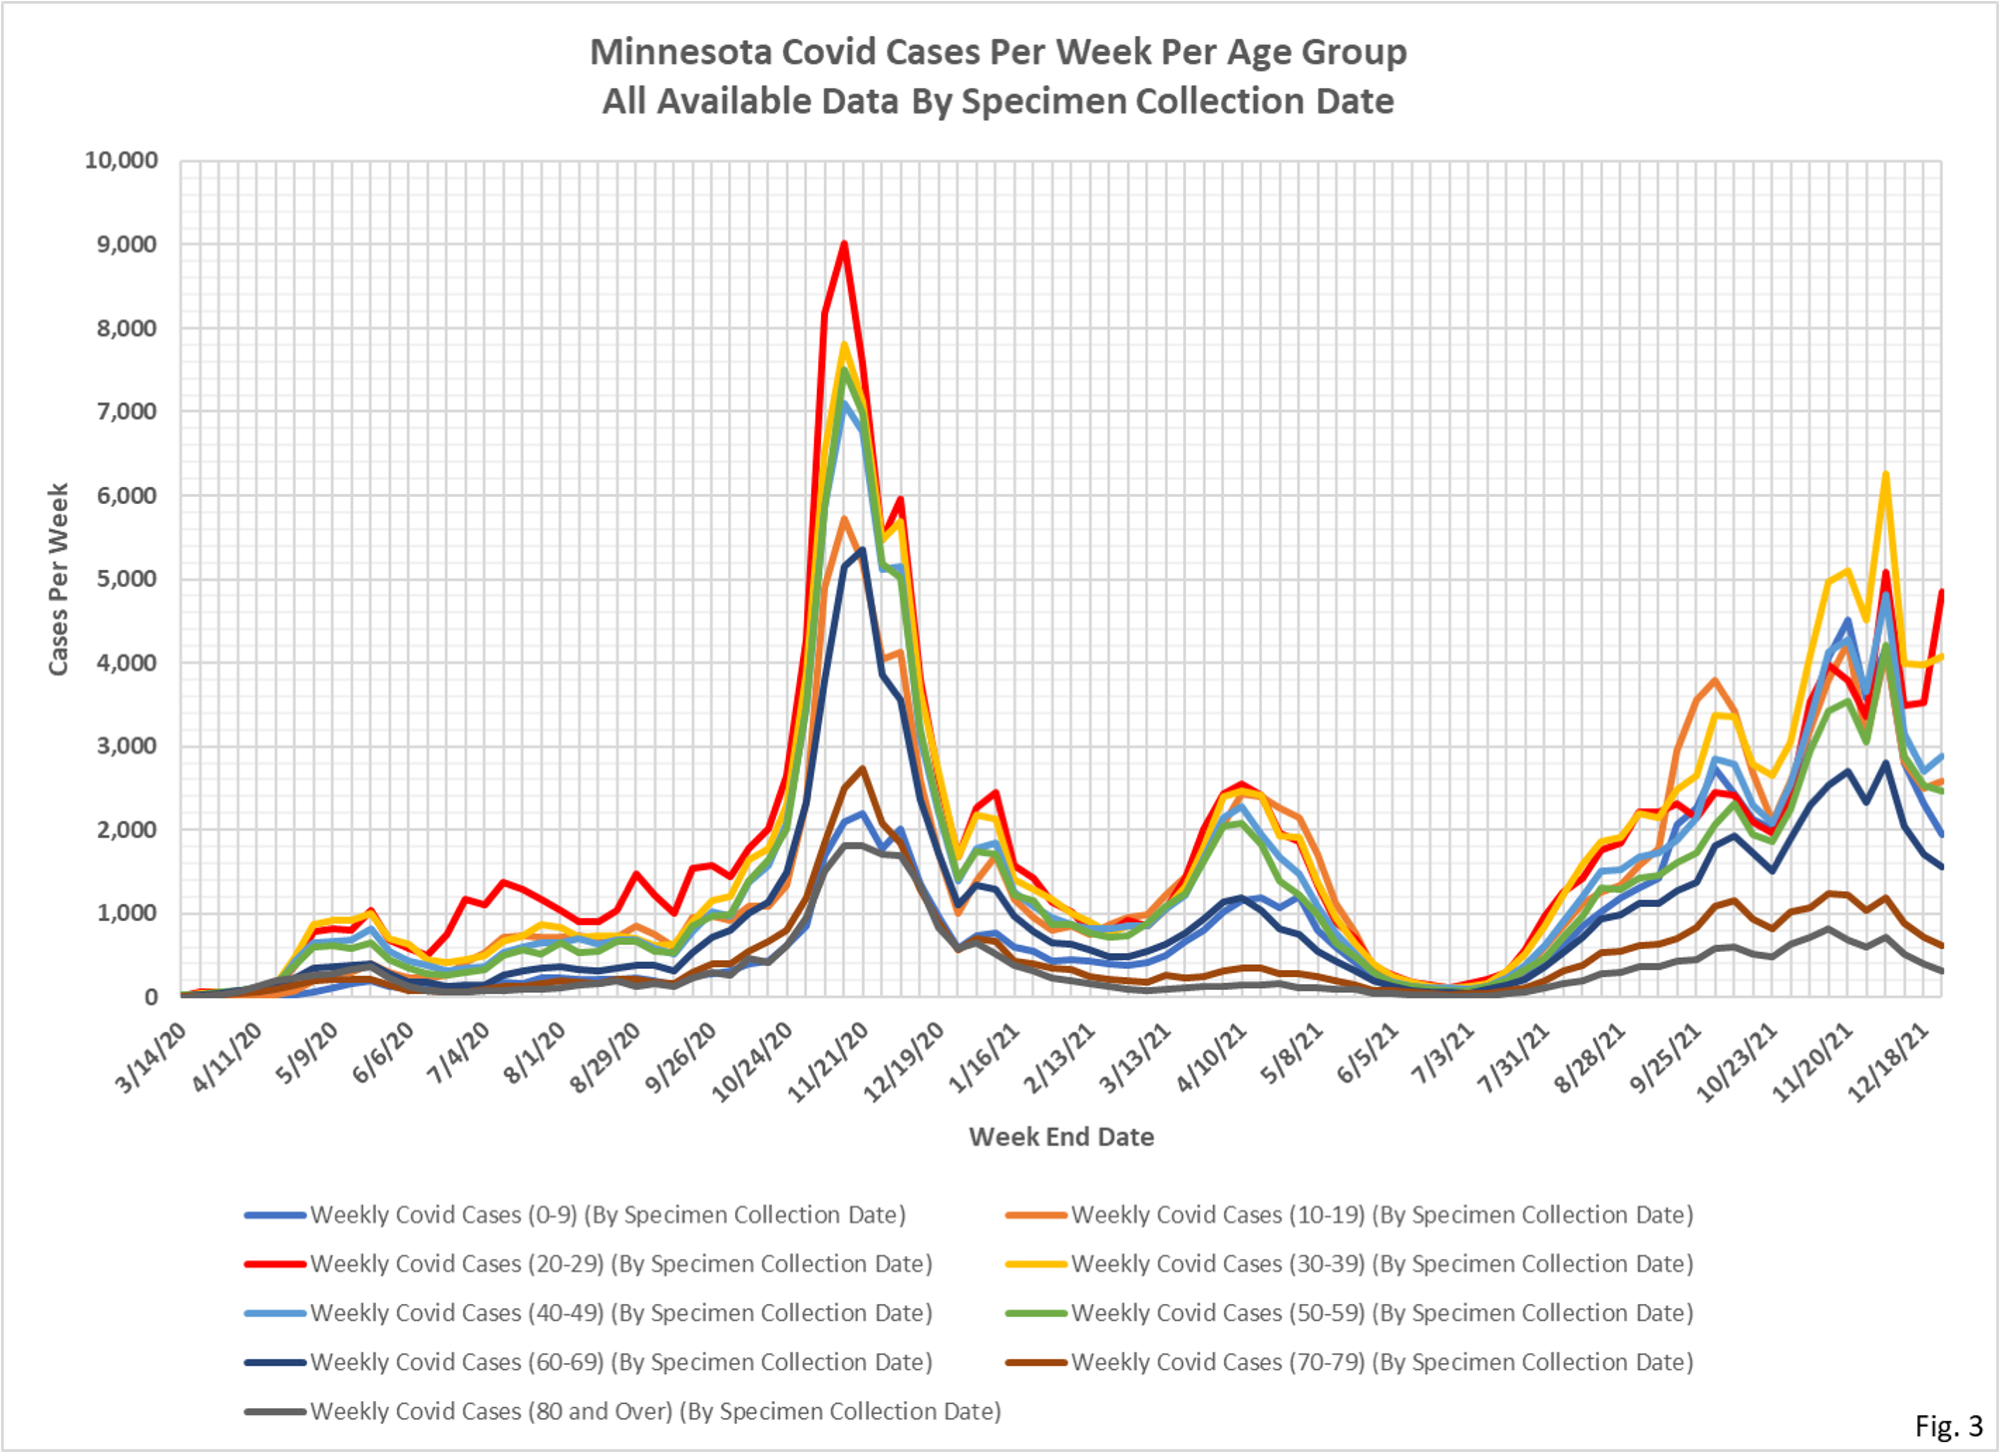
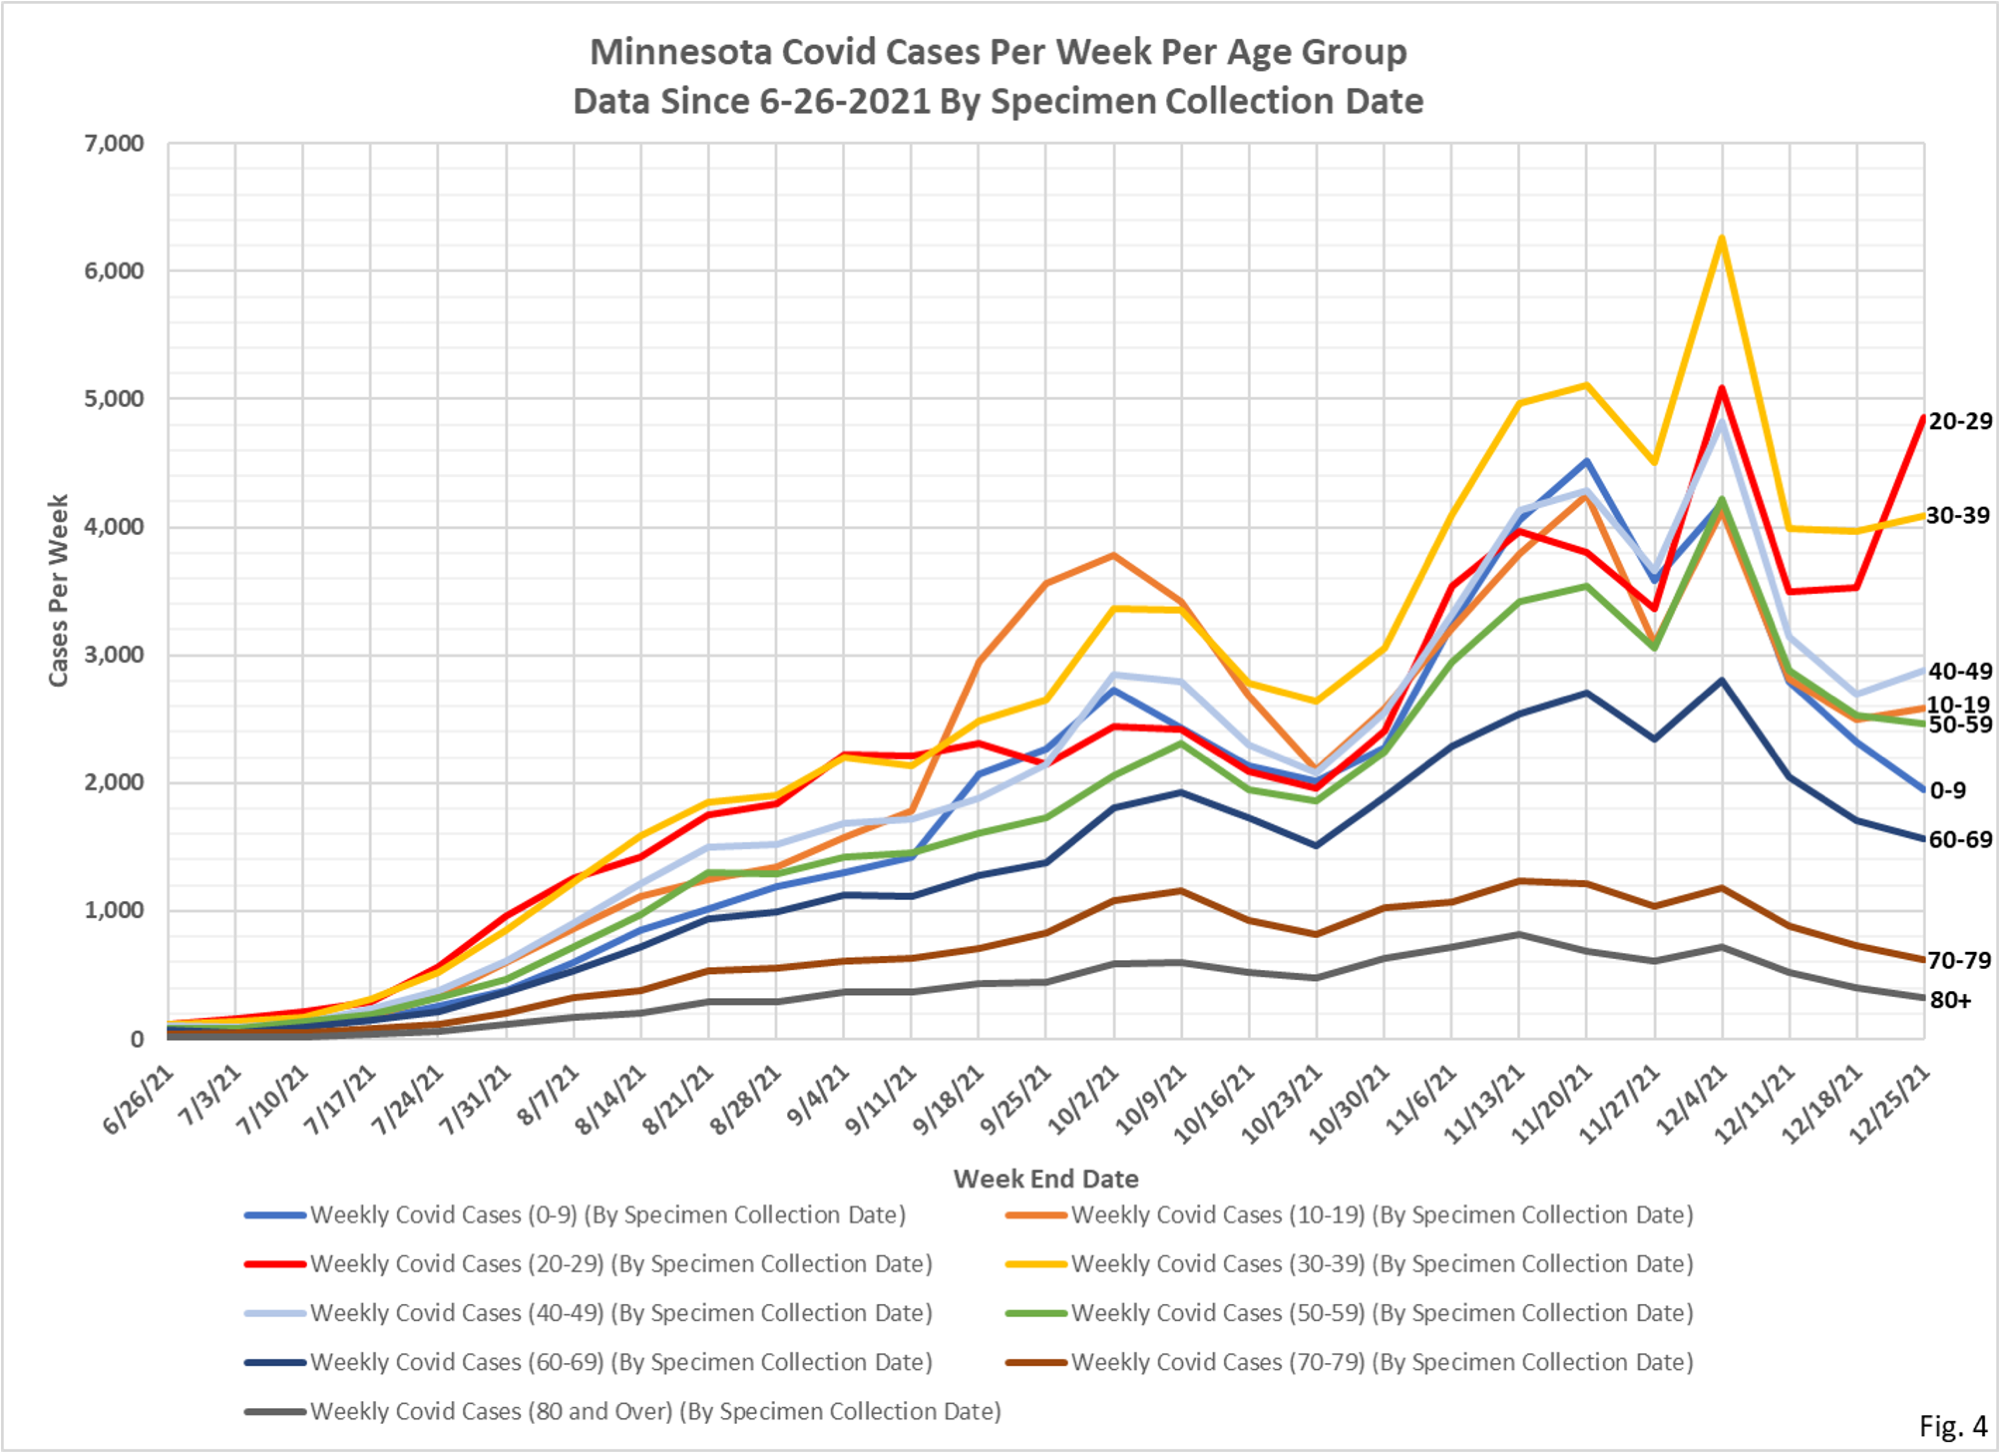
3. The data for the Covid cases per week come from a data file published along with the Minnesota Weekly Report, here: https://www.health.state.mn.us/diseases/coronavirus/stats/index.html#wagscd1 This data is published by date of specimen collection, rather than by date of report as the other data is. The data is provided as cases per week in 5 year age groups. I am compiling the data into 10 year age groups in order for the charts to be more readable.
4. Fig. 1 and 2: Covid Tests Per Week. Reported testing is up this week over last week, somewhat mirroring the increased testing reported on the Minnesota Covid Dashboard https://mn.gov/covid19/data/response-prep/public-health-risk-measures.jsp . I do not have much confidence in the testing by age group data, since the overall pattern does not seem to match the Covid Dashboard very well, especially the sawtooth pattern in reported testing in November 2021.
5. Fig. 3 and 4: Covid Cases Per Week. The Covid cases per week were quite mixed this week, with a sharp increase in cases for the 20-29 apparently driving the overall increase in cases seen statewide. College students coming home? There were slight increases in the 10-19, 30-39, and 40-49 age groups. There was a quite large decrease in the 0-9 age group, and small decreases in the 50 and older age groups. This data goes through 12/25/2021, so the Omicron variant should have been fairly well circulating in Minnesota. It is a little surprising that the 20-29 age group was the only group to see a sizeable increase in cases. This age group may be among the lowest vaccinated, but it is hard to know since they are part of the 18-49 age group. The 18-49 age group is currently 69% fully vaccinated, but it is likely that the older part of this age group is the more highly vaccinated. Total cases for the week were reported as 21,311, an increase of 4.6% from last week’s total of 20.366.
6. Fig. 5 and 6: ICU Covid Admissions Per Week. ICU Covid admissions were down sharply in all age groups, except for increases in the 0-9, 10-19, and 30-39 age groups. The young age groups continue to have very low Covid ICU admissions; the 0-9 age group increased from 2 to 4, the 10-19 age group increased from 1 to 6, and the 20-29 age group decreased from 6 to 4. Despite the panic-inducing news coverage about large increases in pediatric Covid patients nationwide, there does not seem much increase in young ICU patients in Minnesota. The decrease in ICU admissions for the older age groups is a relief. If this is the first indication of the impact of Omicron in Minnesota then this is good news, but of course we should wait to see a few more weeks of data to see if the trend continues. Total ICU admissions for the week were 155, a sharp decrease from 195 admissions last week.
7. Fig. 7 and 8: Non-ICU Covid Admissions Per Week. Non-ICU Covid admissions were flat or lower in most age groups, with an increase in admissions in the 40-49 age group. The younger age groups continue to have lower admissions. The 0-9 age group had 11 admissions, the 10-19 age group had 15 admissions, and the 20-29 age group was a little higher at 58, but still within the range of recent weeks. Again, no evidence here of the nationwide increase in young hospitalizations being talked about in the media. The decrease Non-ICU Covid admissions in the 60-69 age group the last 2 weeks has been remarkable, from 236 the week ending 12/16/21, to 196 the week ending 12/23/21, and then to 134 this week. Total Non-ICU Covid admissions for the week were 769, a decrease of 57 admissions from the 826 admissions last week, and down 364 from the 1133 non-CI Covid admissions the week ending 12/09/21.
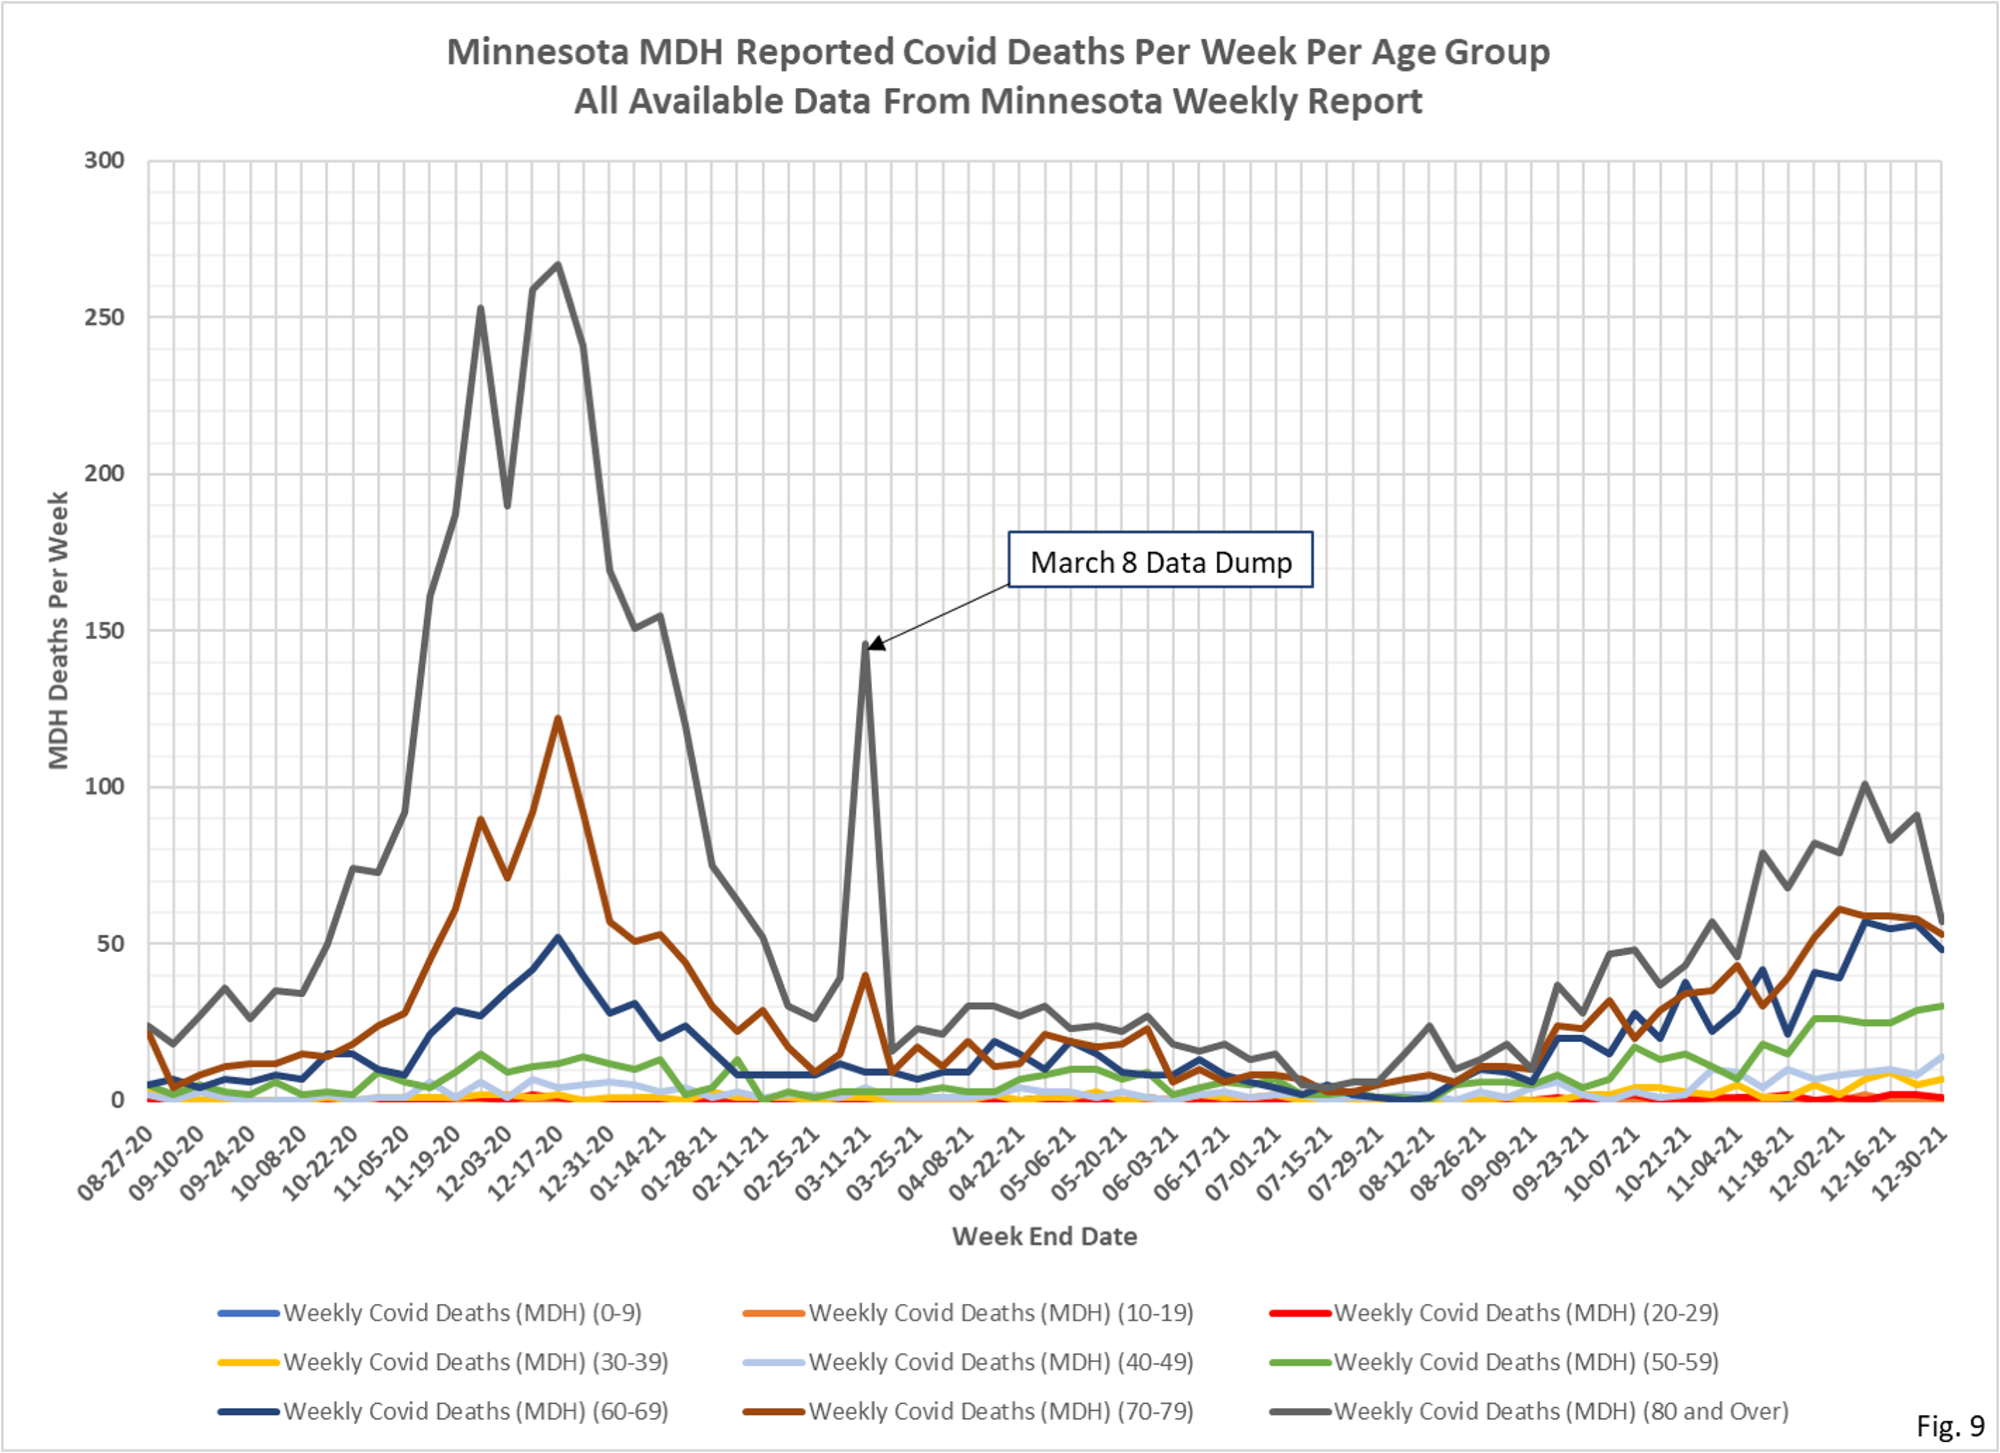
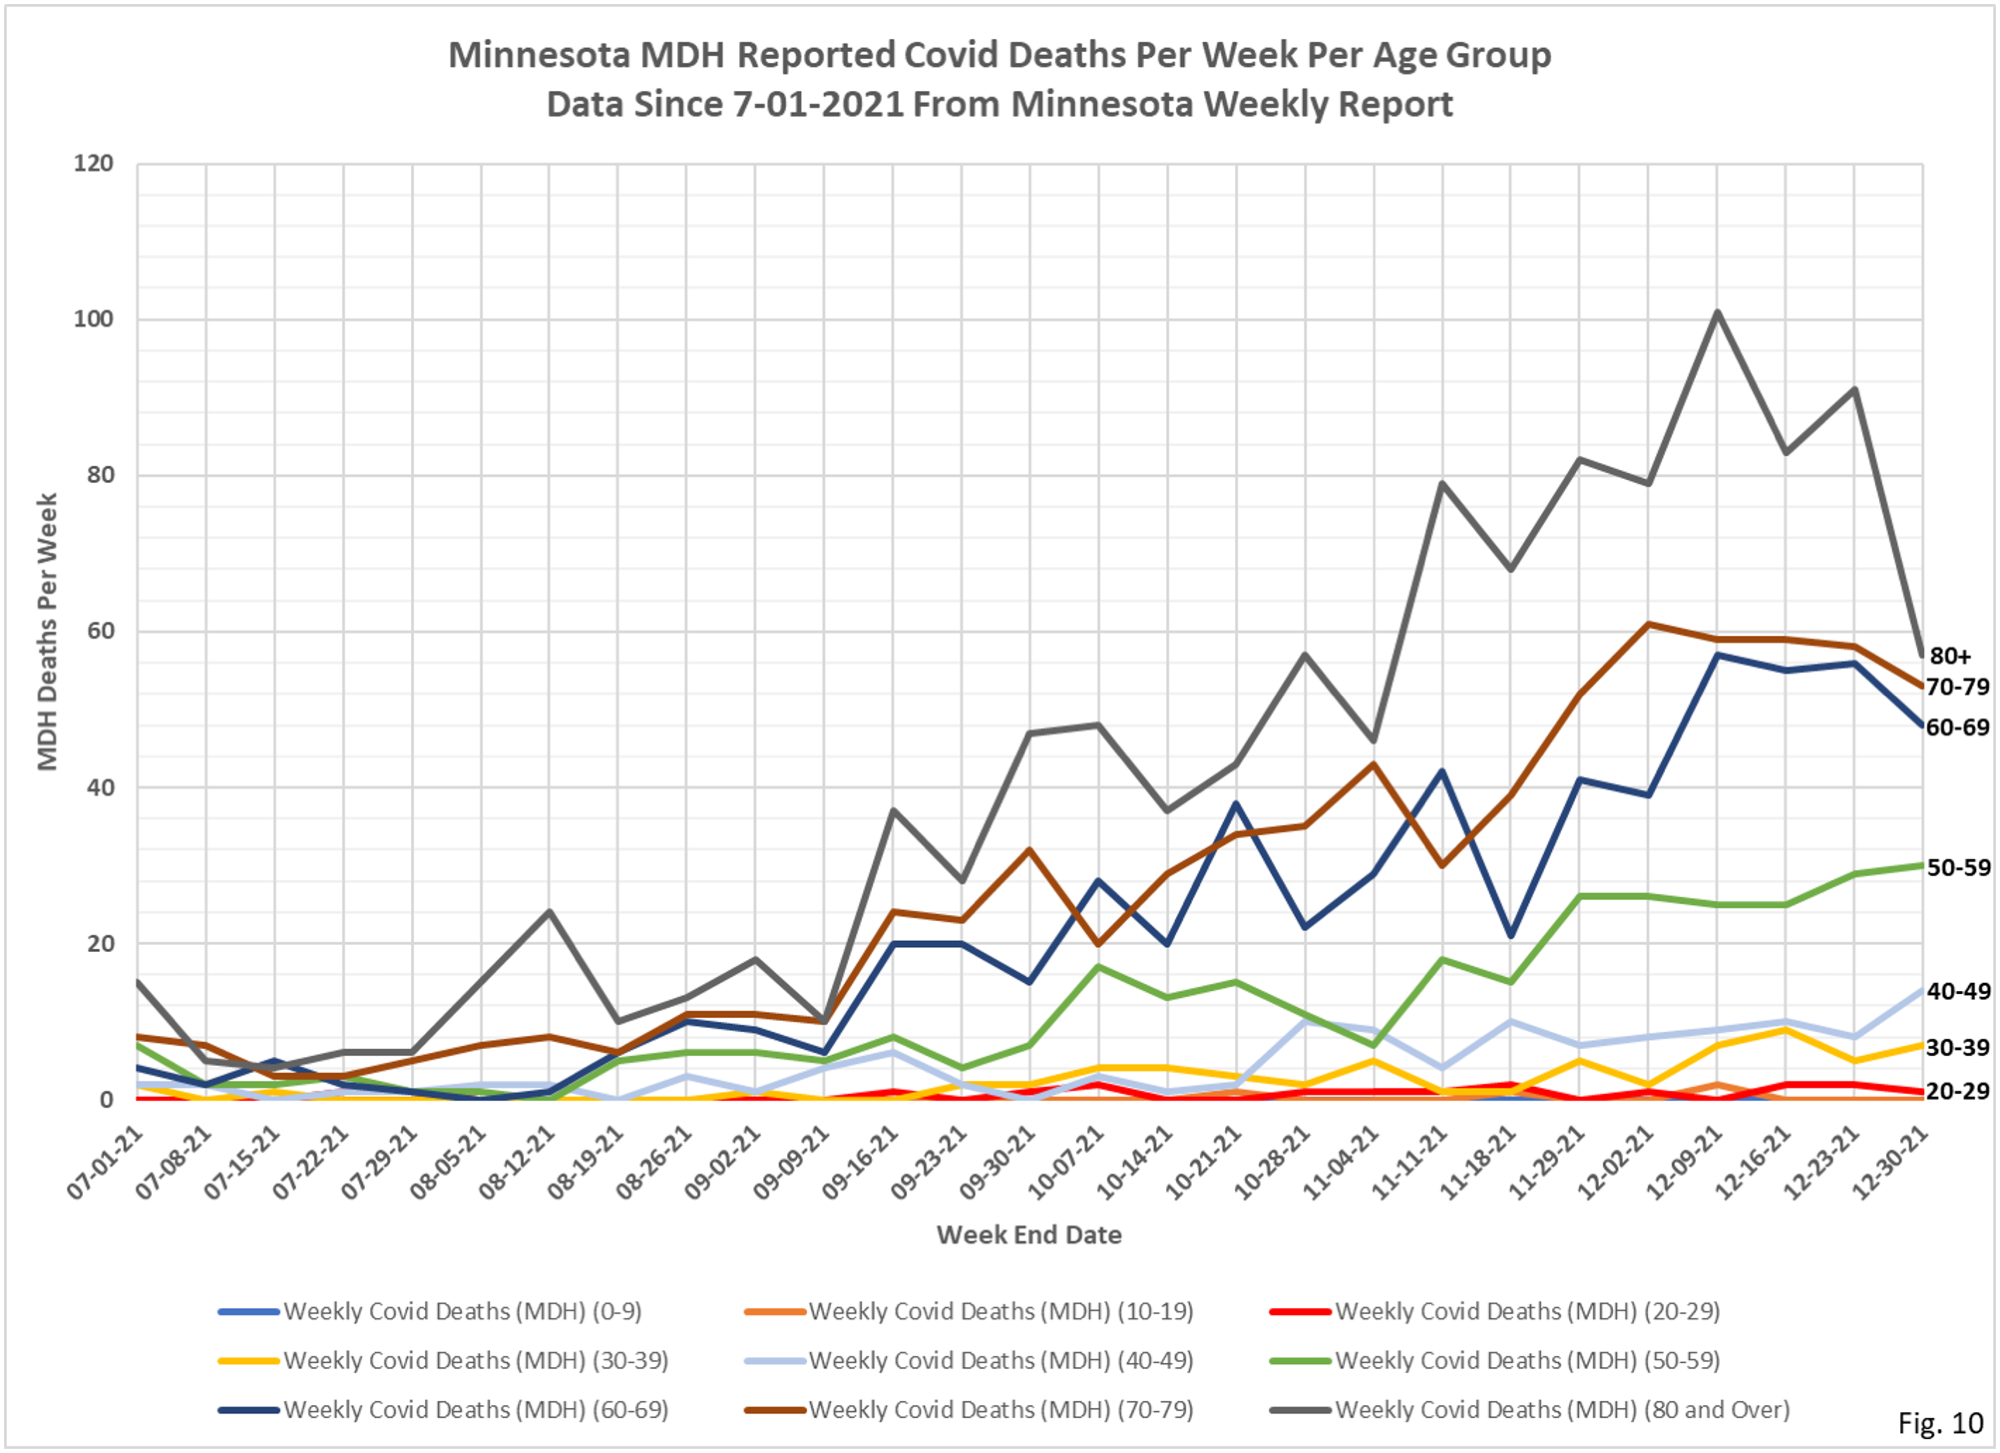
8. Fig. 9 and 10: Covid Deaths Per Week. Total reported Covid deaths for the week were 210, a good decrease from 249 reported deaths the week before. The 80+ age group continues to experience the most Covid deaths of any age group, but were reduced substantially for the week. There were 57 Covid deaths reported in the 80+ age group, the fewest since there were 79 reported Covid deaths the week ending 11/11/21.