People are doing a fair amount of research on deaths from various causes during the epidemic–which are up, which are down. It isn’t easy to do accurately. In Minnesota as elsewhere, we appear to have increases in deaths from dementia, heart disease, diabetes, hypertension and other causes, which are really due to the excessive response to the epidemic, not to CV-19. Dementia deaths were up a lot in 2020, but have declined, likely due to a pull-forward effect depleting the pool. Dave Dixon took an updated look at the data and here are his notes and a resulting chart.
1. An email correspondent asked how non-Covid deaths during the pandemic compare to the pre-Covid era. The CDC publishes data on a page titled “Excess Deaths Associated with COVID-19” here: https://www.cdc.gov/nchs/nvss/vsrr/covid19/excess_deaths.htm#dashboard . This page attempts to estimate the number of deaths that might be indirectly attributable to COVID-19. The deaths tabulated on these charts do not have a Covid diagnosis and COVID-19 does not appear on the death certificate. However, the CDC states that “…some deaths due to COVID-19 may be assigned to other causes (for example, if COVID-19 was not diagnosed or not mentioned on the death certificate)…”. In other words, they are tracking deaths to these select comorbidities because they may indicate undiagnosed COVID-19. The CDC also states that excess deaths may be “deaths from other causes occurring in the context of heath case shortages or overburdened health care systems.”
2. The Excess Deaths web page contain links to download data files. The data file Weekly Deaths by State and Cause of Death https://data.cdc.gov/api/views/u6jv-9ijr/rows.csv?accessType=DOWNLOAD&bom=true&format=true%20target= was used to generate the bar charts and data tables presented here.
3. The provided data file lists deaths per week for 13 different diseases for each state and also the total for the US. In addition, they provide both weighted and unweighted estimates. The weighted estimates are adjusted to account for underreporting, and are the basis for the charts below. The accuracy of the weighting process is unknown and open to debate.
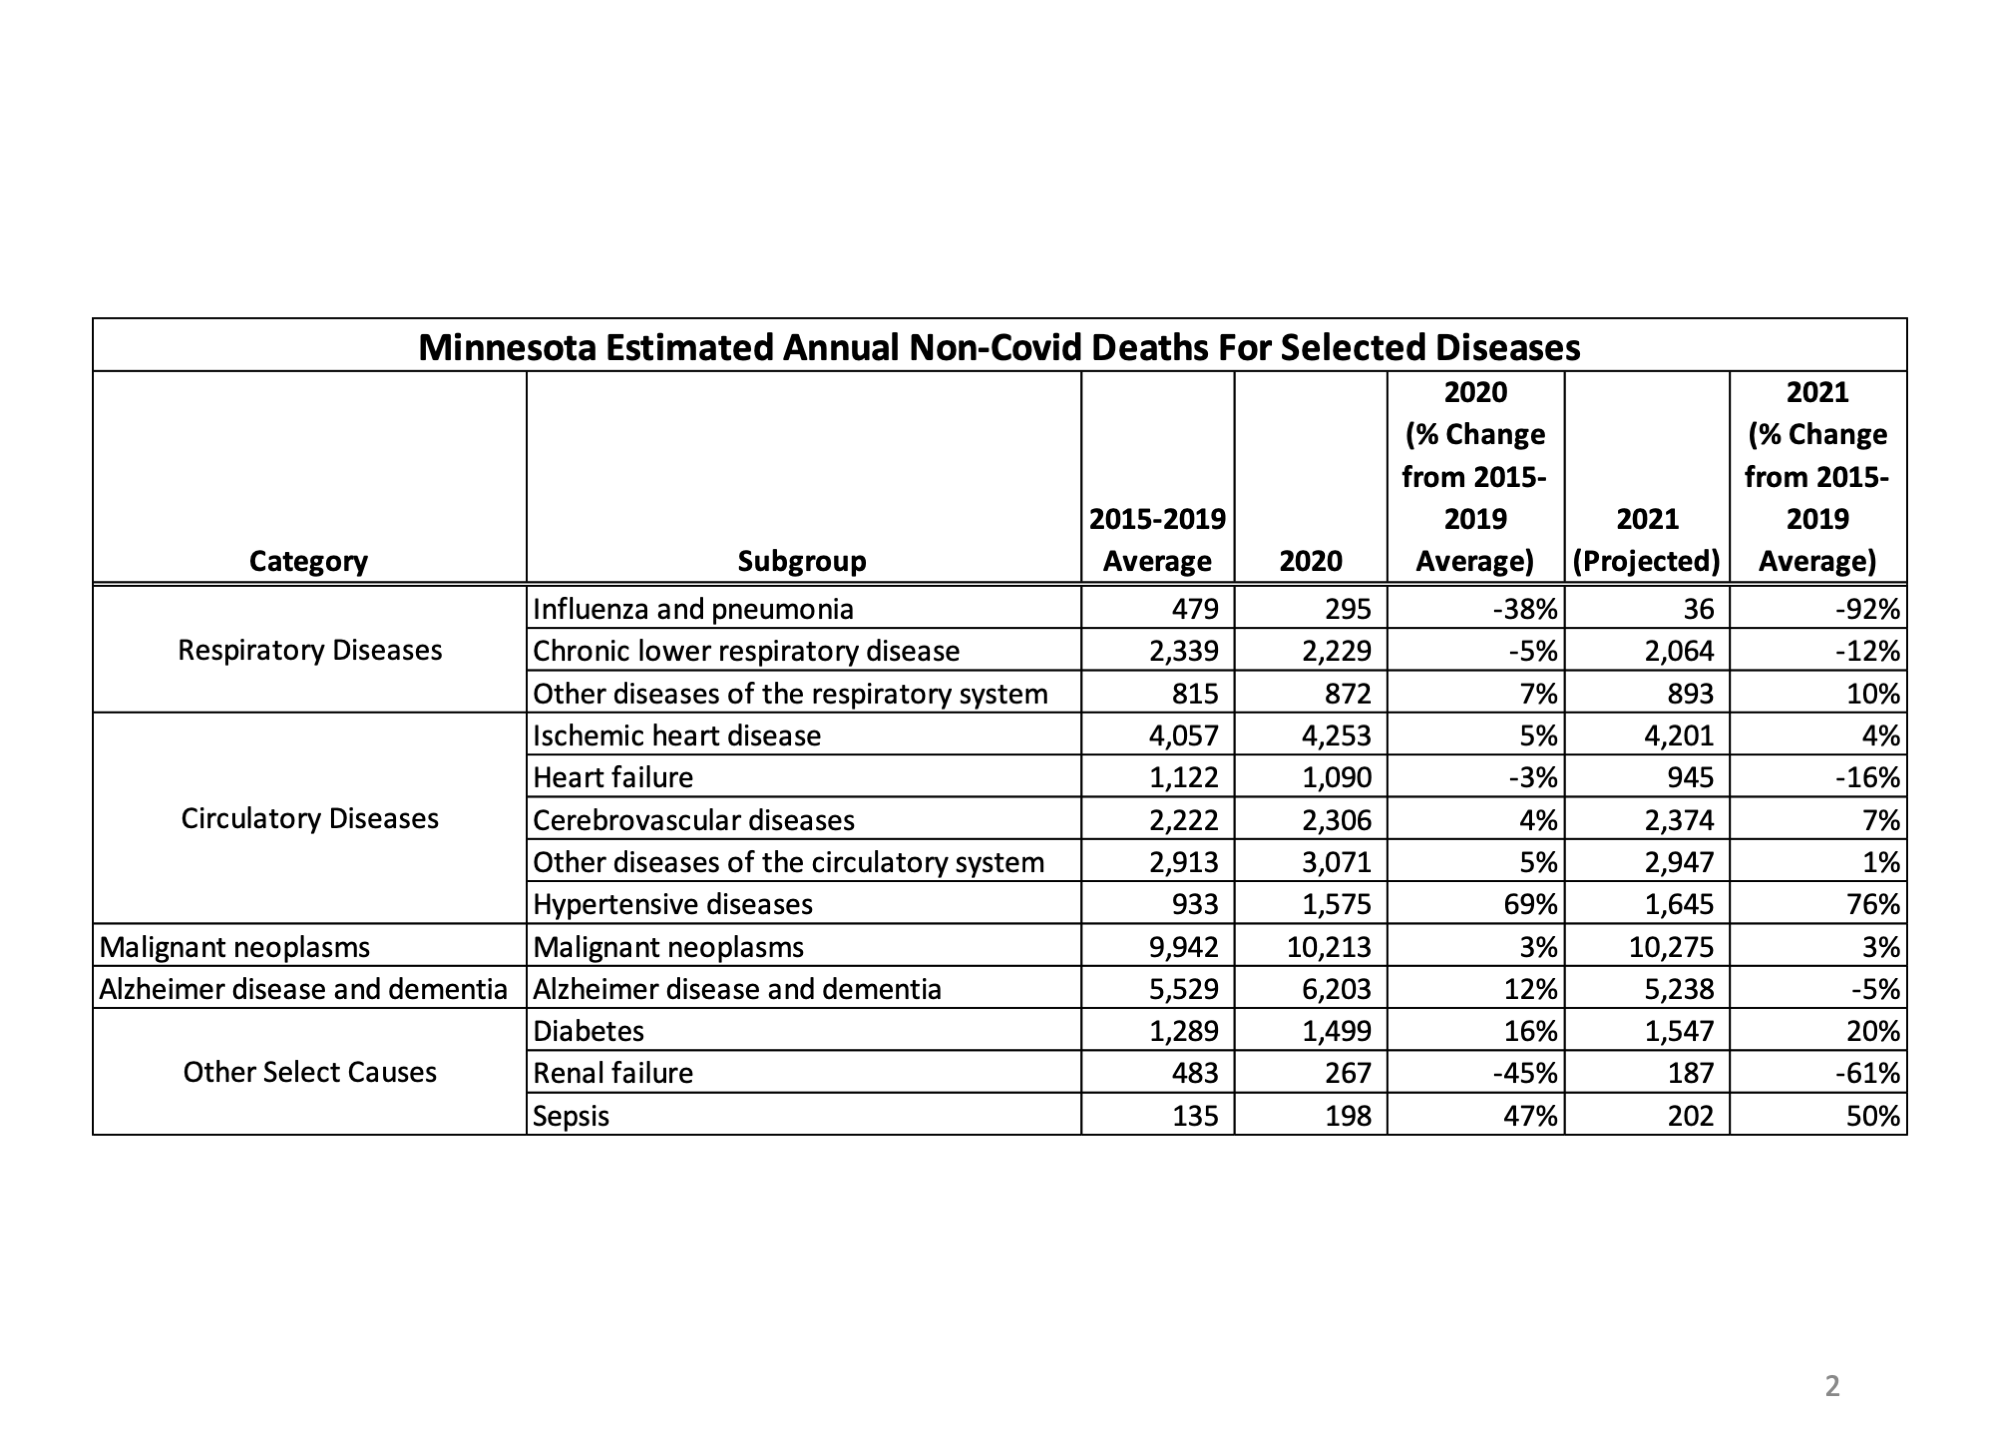
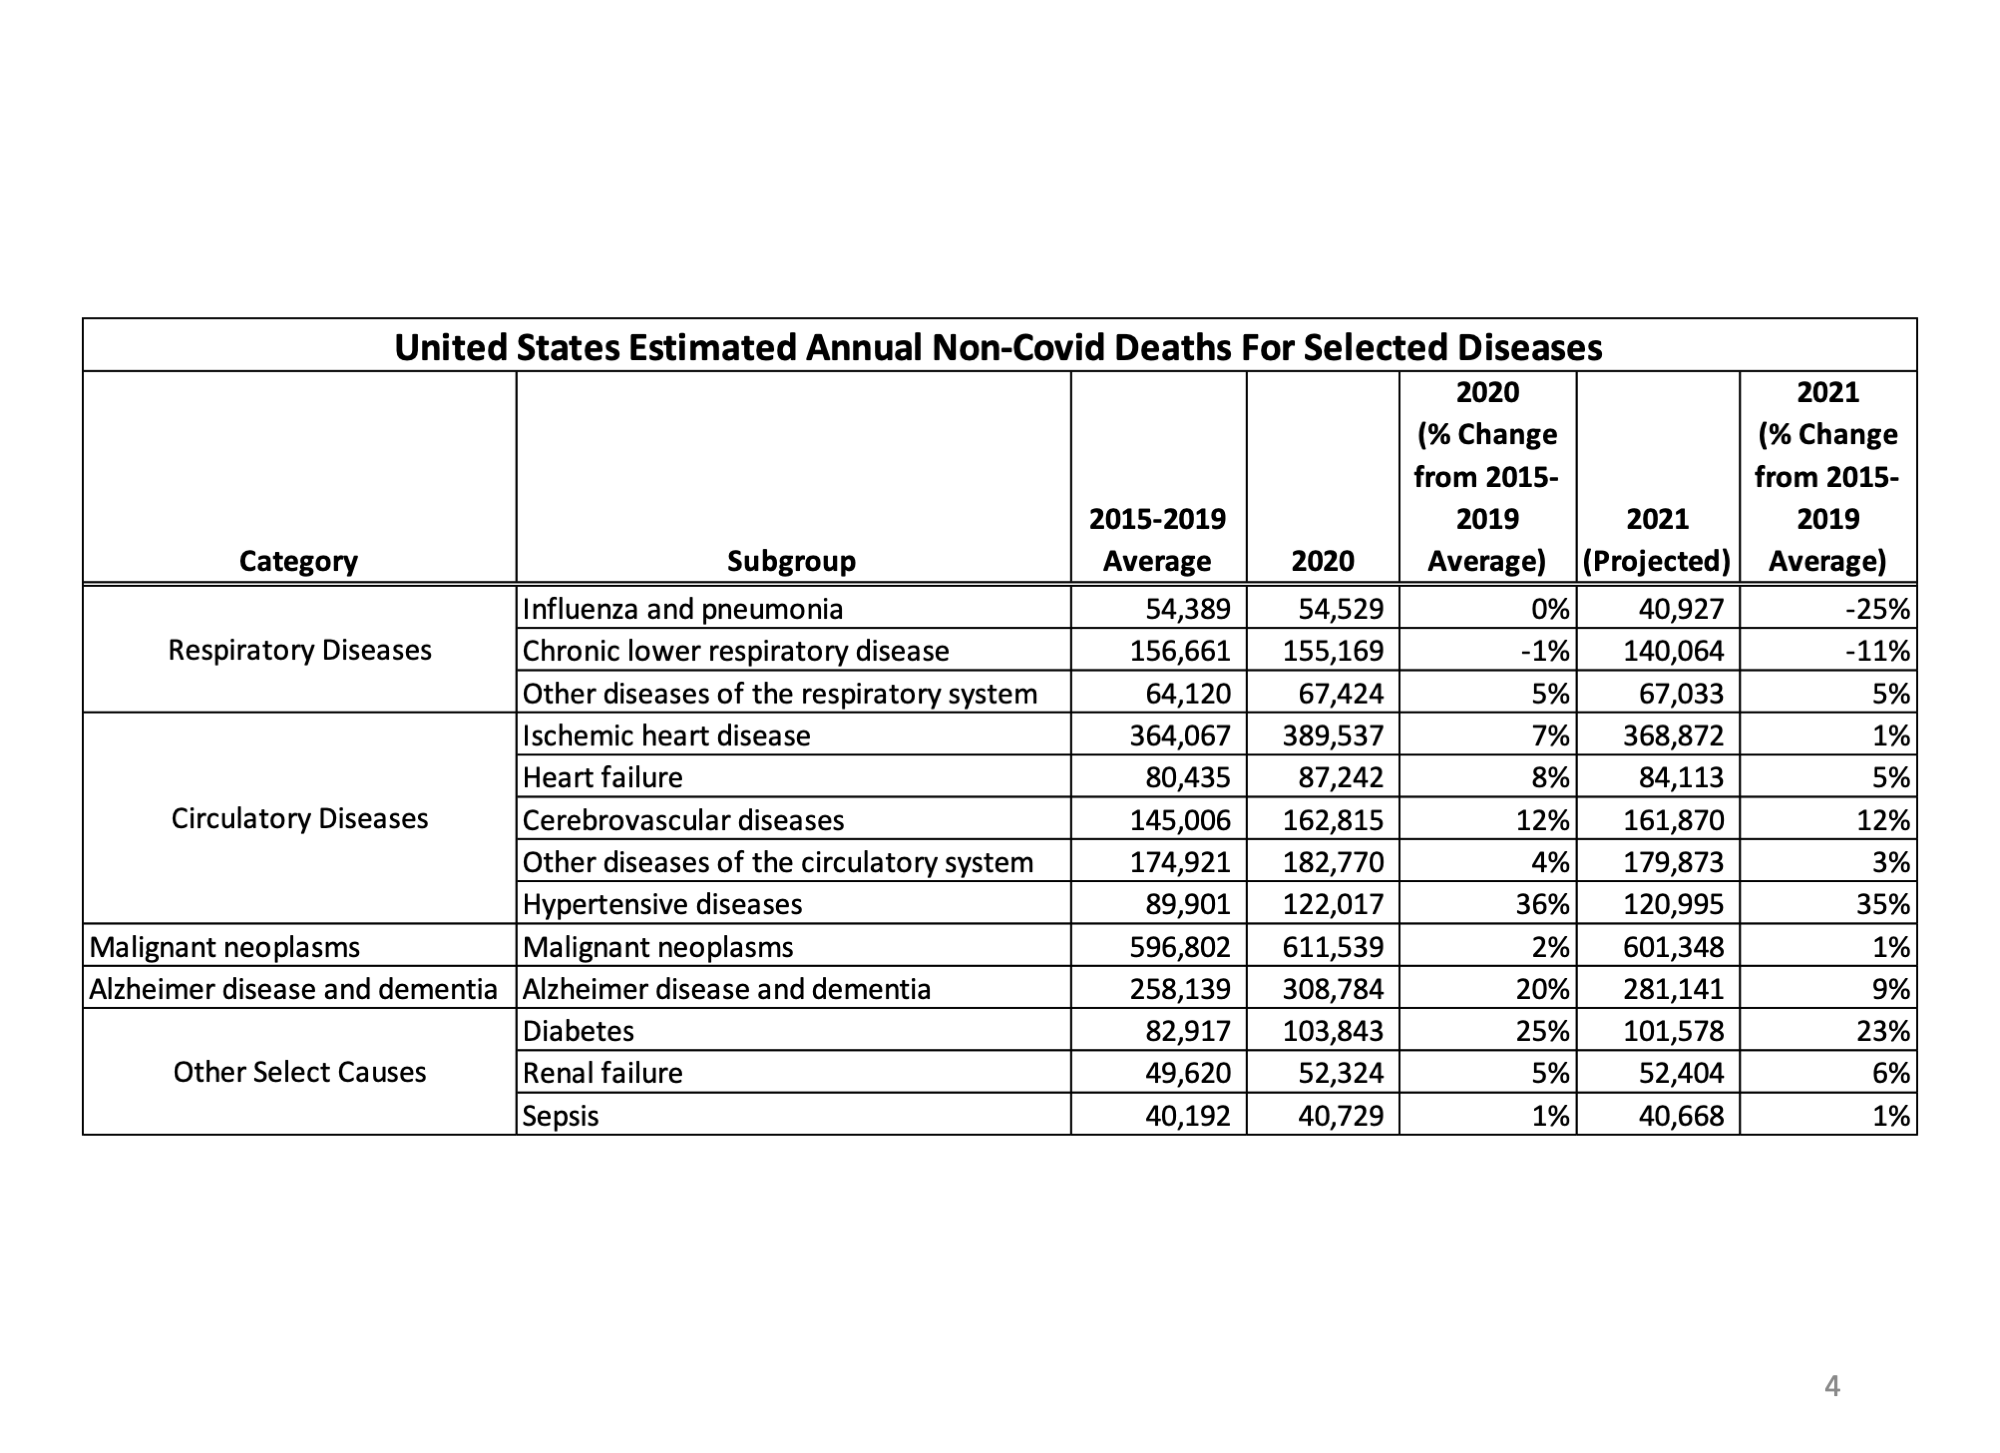
4. The provided data file also provides an average for 2015 to 2019 for each disease, and this average is used as the reference baseline.
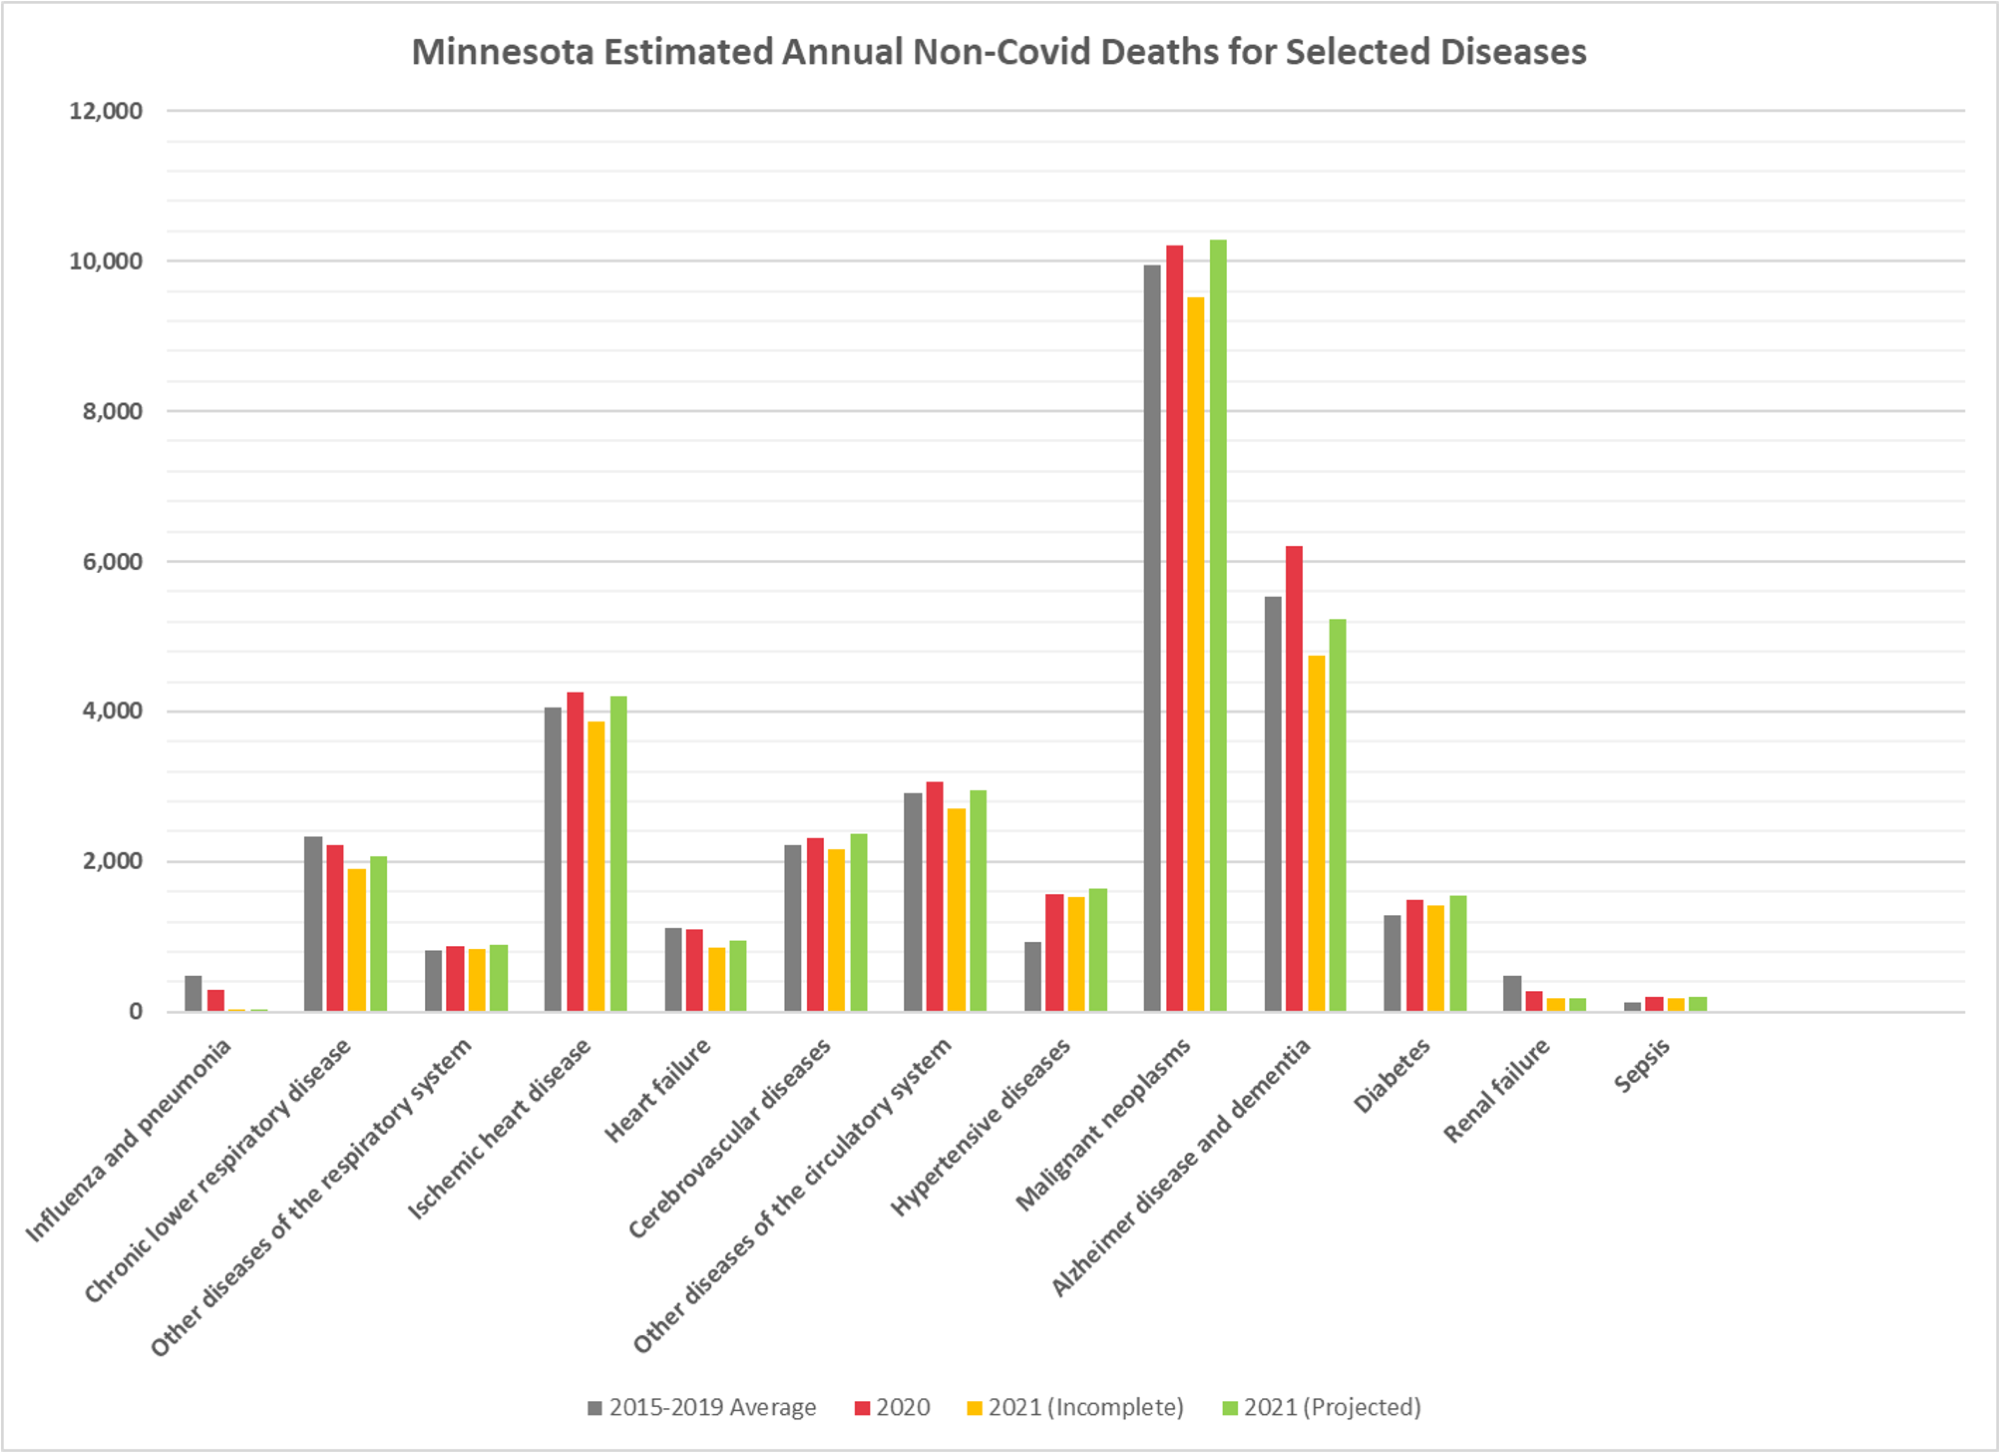
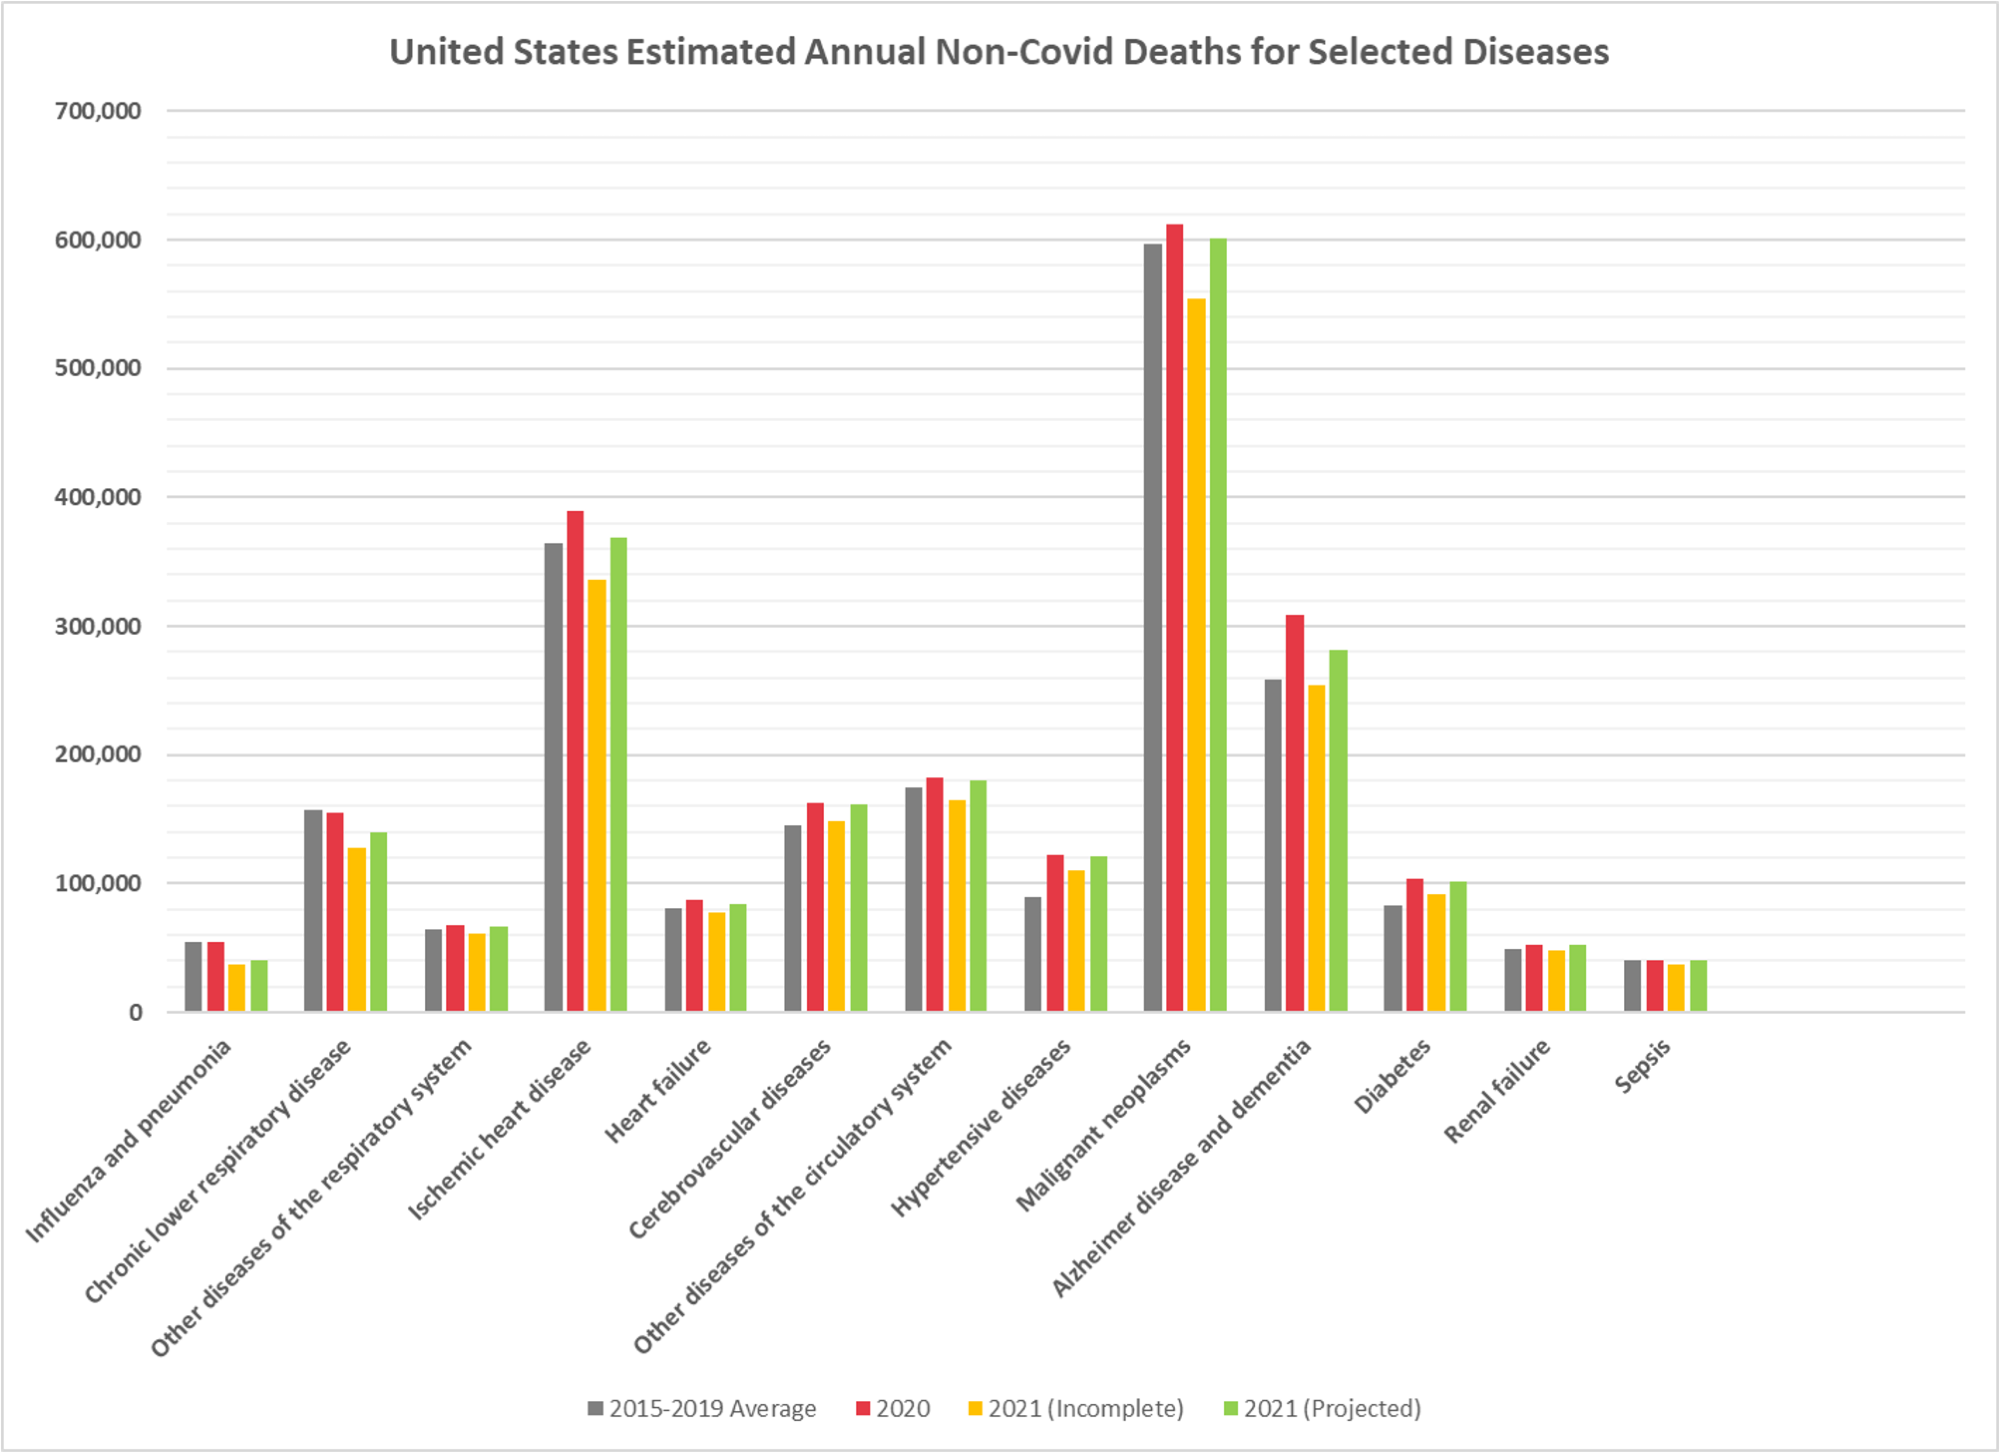
5. The provided data file does not include estimates for the last 4 weeks of 2021. This incomplete data as published by the CDC is shown on the bar charts as “2021 (incomplete)”. The columns for “2021 (Estimated)” are calculated by simply using the death counts for the last 4 weeks of 2020 in place of the incomplete weeks of 2021.
For Minnesota the non-COVID-19 diseases which have exceeded the baseline in 2020 and 2021 are most notably Hypertensive Diseases and Diabetes. Sepsis also exceeded the baseline but affected relatively few people.
Nationally Hypertensive Diseases and Diabetes were also notably above the baseline, as well as Cerebrovascular Diseases.