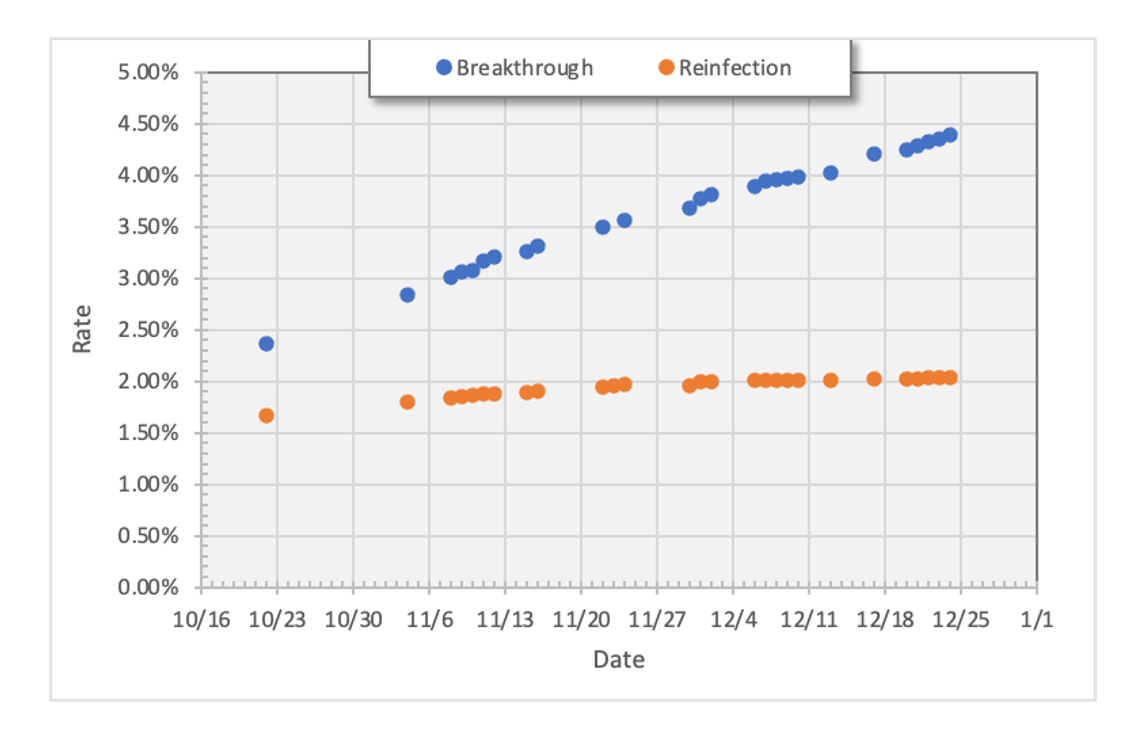
A reader provided this chart to me. As with Minnesota, it shows that in North Dakota people with prior infection are less likely to get reinfected than vaccinated individuals are to get breakthroughs. As always, I caution about confounding by undetected prior infections. Notes from the reader:
1. The reinfection rate for each day is taken as the number of reinfections reported for that day on North Dakota’s DOH site:
https://www.health.nd.gov/diseases-conditions/coronavirus/north-dakota-coronavirus-cases
That number only accounts for reinfections since 26 June 2021. To get the total number of reinfections, I add the 947 reinfections cited in a DOH summary report to the cumulative daily total above. The summary report can be found at:
Click to access ND_Historical_Reinfections.pdf
2. The percent reinfected is calculated by taking the total reinfected and dividing by the number of eligible infections. This number is calculated as the total infections 90 days prior to each date, minus the number of deaths 90 days prior to each date. I use the cumulative infections and deaths from the Worldometers site:
https://www.worldometers.info/coronavirus/usa/north-dakota/
3. I have to plot these numbers on the day they are posted, so the gaps in the chart are for days that I did not update the numbers.
4. Breakthrough infection is directly specified on the ND DOH website (“% Vaccinated” under the ”Breakthrough” tab).
https://www.health.nd.gov/diseases-conditions/coronavirus/north-dakota-coronavirus-cases
5. I simply plot the breakthrough percentage each day. Gaps in the data are days that I did not update.