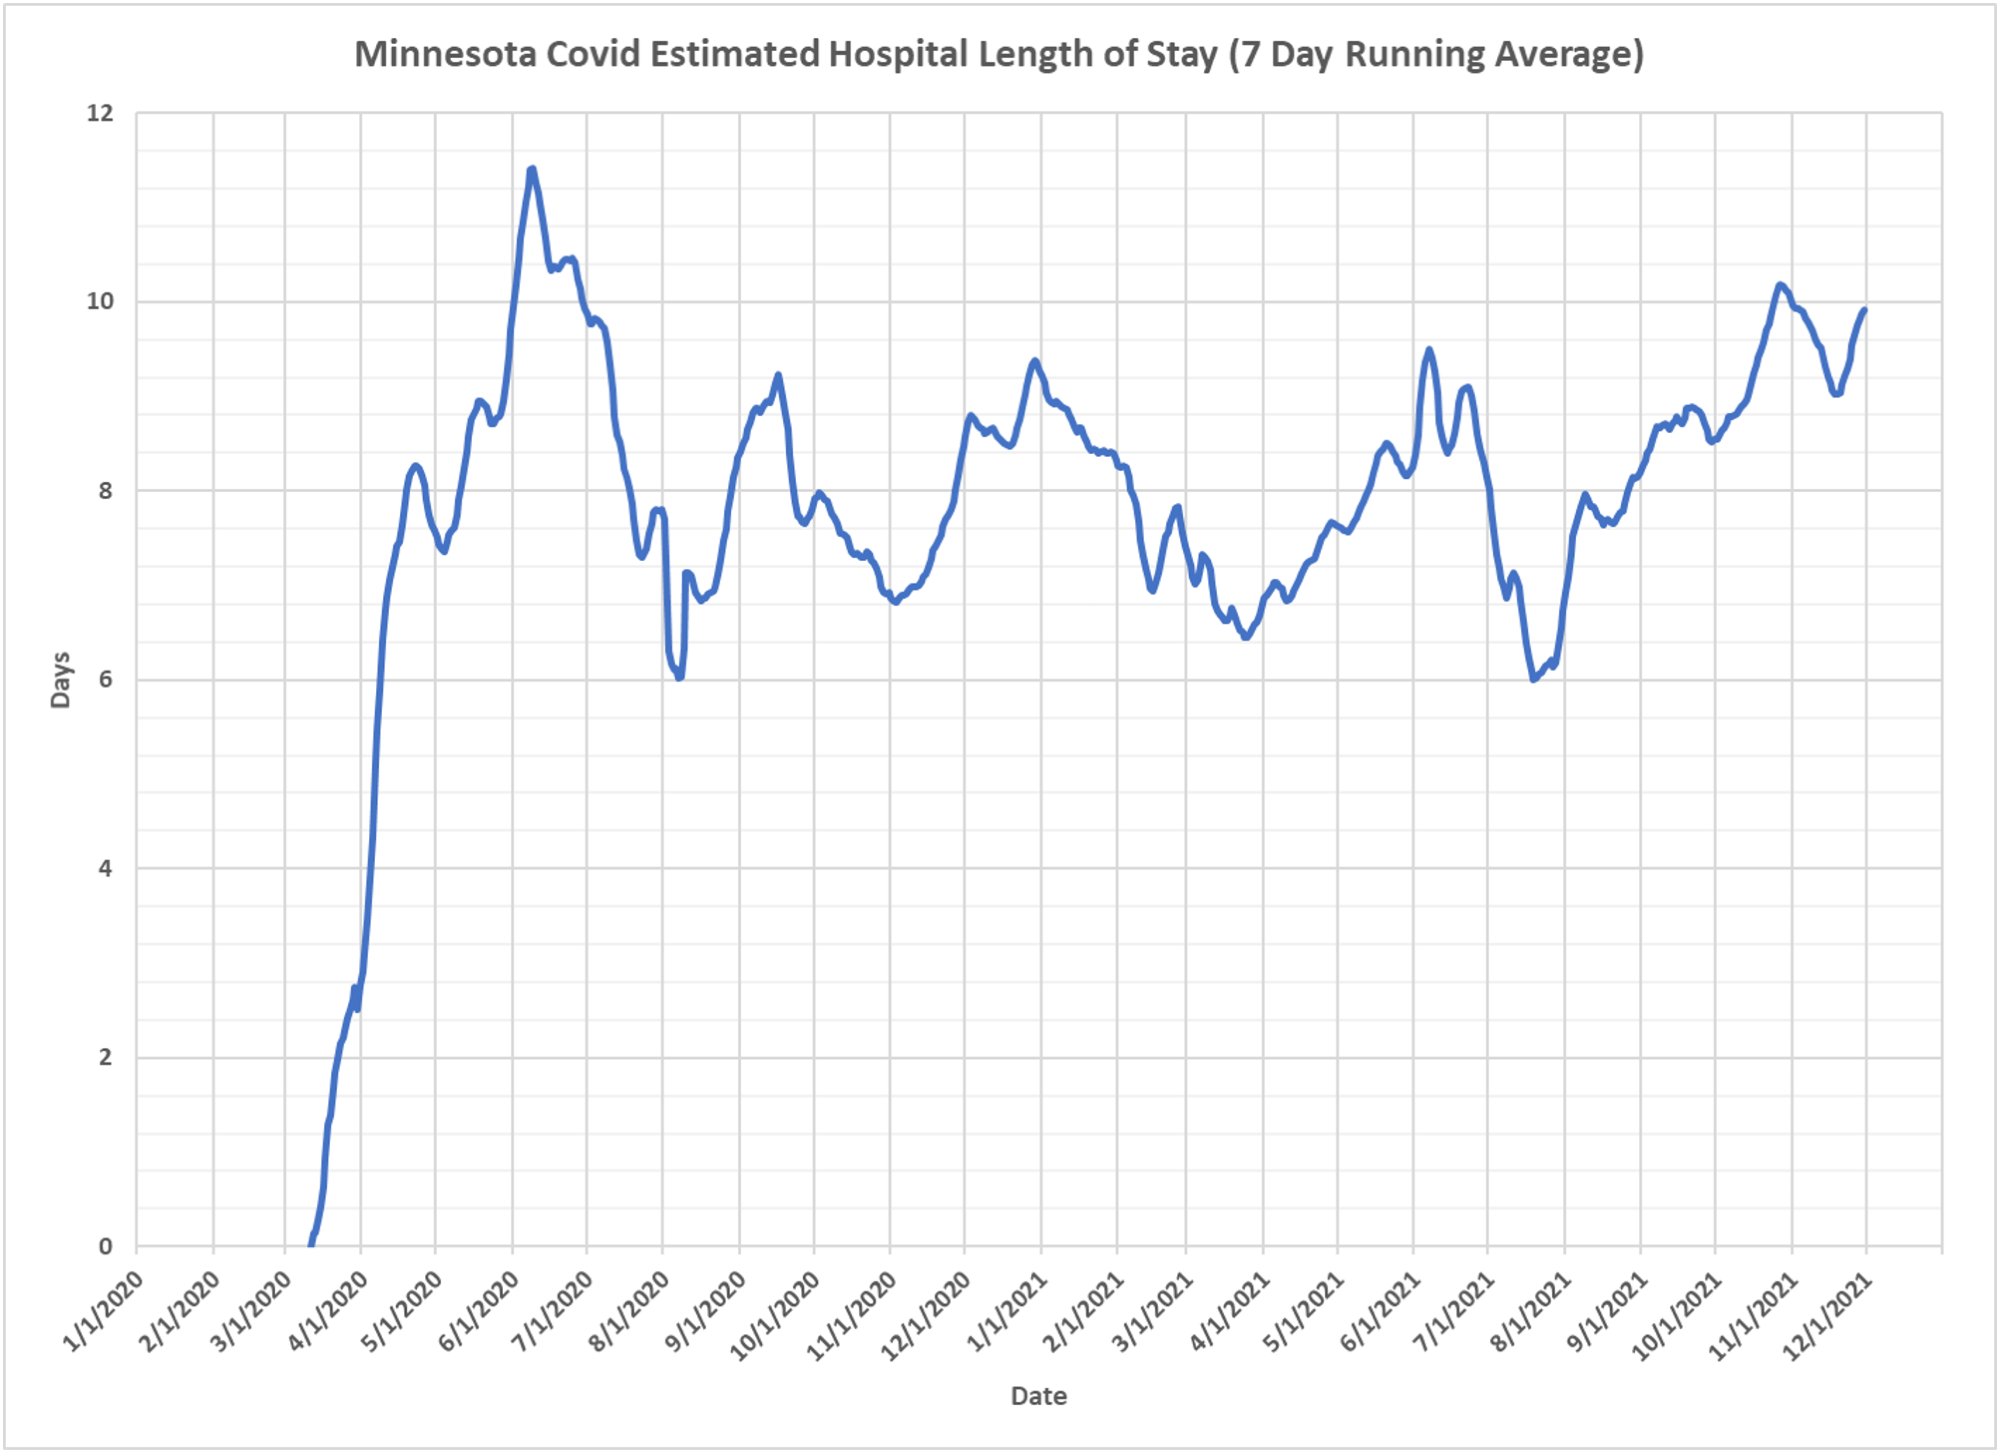
Dave Dixon noticed that maybe hospital beds in use were increasing faster than admissions, which would indicate an increase in length of stay, so we decided a little length of stay analysis would be useful. The chart is below, as are Dave’s notes. The most remarkable thing is how steady length of stay has been since the first wave when they were unnecessarily sticking everyone on ventilators. Interestingly length of stay peaks are associated with wave peaks, suggesting that downstream capacity–step-down or skilled nursing beds–are more a factor than hospital bed capacity, and also indicating that neither Alpha nor Delta was creating more serious disease. The recent uptick by about a day I would attribute to the vaccine mandates exacerbating the staffing issues that limit downstream capacity.
1. We have been curious about how hospital length stay has varied in Minnesota over the course of the pandemic. As explained below we have been suspicious that average length of stay might be longer now than at the peak of the late 2020 surge in cases. We very recently filed a Data Practices Act request with the Minnesota Department of Health to try to get actual length of stay data, but it is unclear when, if ever, they will respond. Therefore, in the meantime, we have attempted to estimate length of stay using the data available to us.
2. MDH publishes daily Covid hospital admissions on the Situation Update web page, https://www.health.state.mn.us/diseases/coronavirus/situation.html . Although they break out ICU and Non-ICU admissions, for this analysis we are using total combined daily admissions.
MDH also publishes daily Covid hospital beds in use on the Response Capacity web page, https://mn.gov/covid19/data/response-prep/response-capacity.jsp. We are using the total of the ICU and Non-ICU beds in use for this analysis.
3. Using daily admissions and daily beds in use, we are able to calculate how many patients are released from the hospital each day, either recovered or deceased. The equation for each day’s discharges is: Today’s Covid Discharges = Today’s Covid admissions – (Today’s Covid beds in use – Yesterday’s Covid beds in use).
Using the daily admissions, we are able to construct a matrix of patients in the hospital each morning. Patients admitted that same day are in day 1 their stay. Patients remaining in the hospital from yesterday’s admissions are in day 2 of their stay, and so on. Knowing how many people were discharged daily, we subtract the discharges from the balance of patients who have been in the hospital for the most days. For example, if have currently have 5 patients in day 7 of their stay, and there happen to be 10 discharges, we would set the number of patients in day 7 to zero, and subtract the remaining 5 discharges from the patients in day 6 of their stay. This new matrix of patients remaining in the hospital after discharges are removed becomes the start of the next day’s matrix, with all remaining patients’ days of stay incremented one day higher.
4. The length of stay is calculated as the average of the days of stay for the total number of patients discharged each day. We then calculate a 7 day running average of the daily lengths of stay in order to smooth out the curve a little. The chart is run up to 11/30/2021, in order to allow complete data to be considered in the analysis.
We know the model we used of discharging the patients who have been in the hospital the longest is not accurate. In reality, there are an outlier of patients who are in the hospital for a long period of time, and undoubtedly some patients who are in the hospital for a very short period of time. It is hoped that the model we used will at least give a reasonable estimate of how the trends in length of stay may be changing over time.
5. The original topic which spurred us to look at length of stay was a comparison of the peak daily admissions now and in Dec. 2020, and hospital beds in use now and in Dec. 2020. From the Year to Year Comparison charts we frequently publish, most recently here https://healthy-skeptic.com/2021/12/20/year-over-year-charts-december-17/ we can see that daily admissions now are about 158, 68% of last year’s peak admissions of 231. However, daily Covid beds in use now about 1313, 92% of last year’s peak of 1423. One explanation for why beds in use are comparatively higher this year is that length of stay must be longer now than last year. Length of stay last year on 12/1/2020 was approximately 9.2 days, while length of stay now on 11/30/2021 is 9.9 days. It is not clear if this relatively small increase in length of stay is the reason why hospital beds in use now appear higher comparatively than last year. Another possibility is that the assumptions used to estimate length of stay in this analysis are not valid and actual lengths of stay are different than displayed here.

Recently I left the hospital after 13 days of Covid treatment. Comments by staff indicate that some patients are being held in hospital because rehab facilities are overwhelmed .. few available beds in MN. Many patients do not have adequate home environments.
I may not be able to check in during Christmas celebrations so I just want to express my gratitude to Kevin, DD and all the great commenters here. I may not agree with everything but we aren’t here to agree we are here to learn and I learn something here almost every day.
Wishing everyone a joyous Christmas!