This is important but the state makes it so hard to figure out. Biggest confounder is prior infection in the vaxed and the unvaxed, which state knows but won’t reveal. As best Dave can figure, it appears that vax is very protective and being infected before is even more protective. Dave’s notes again:
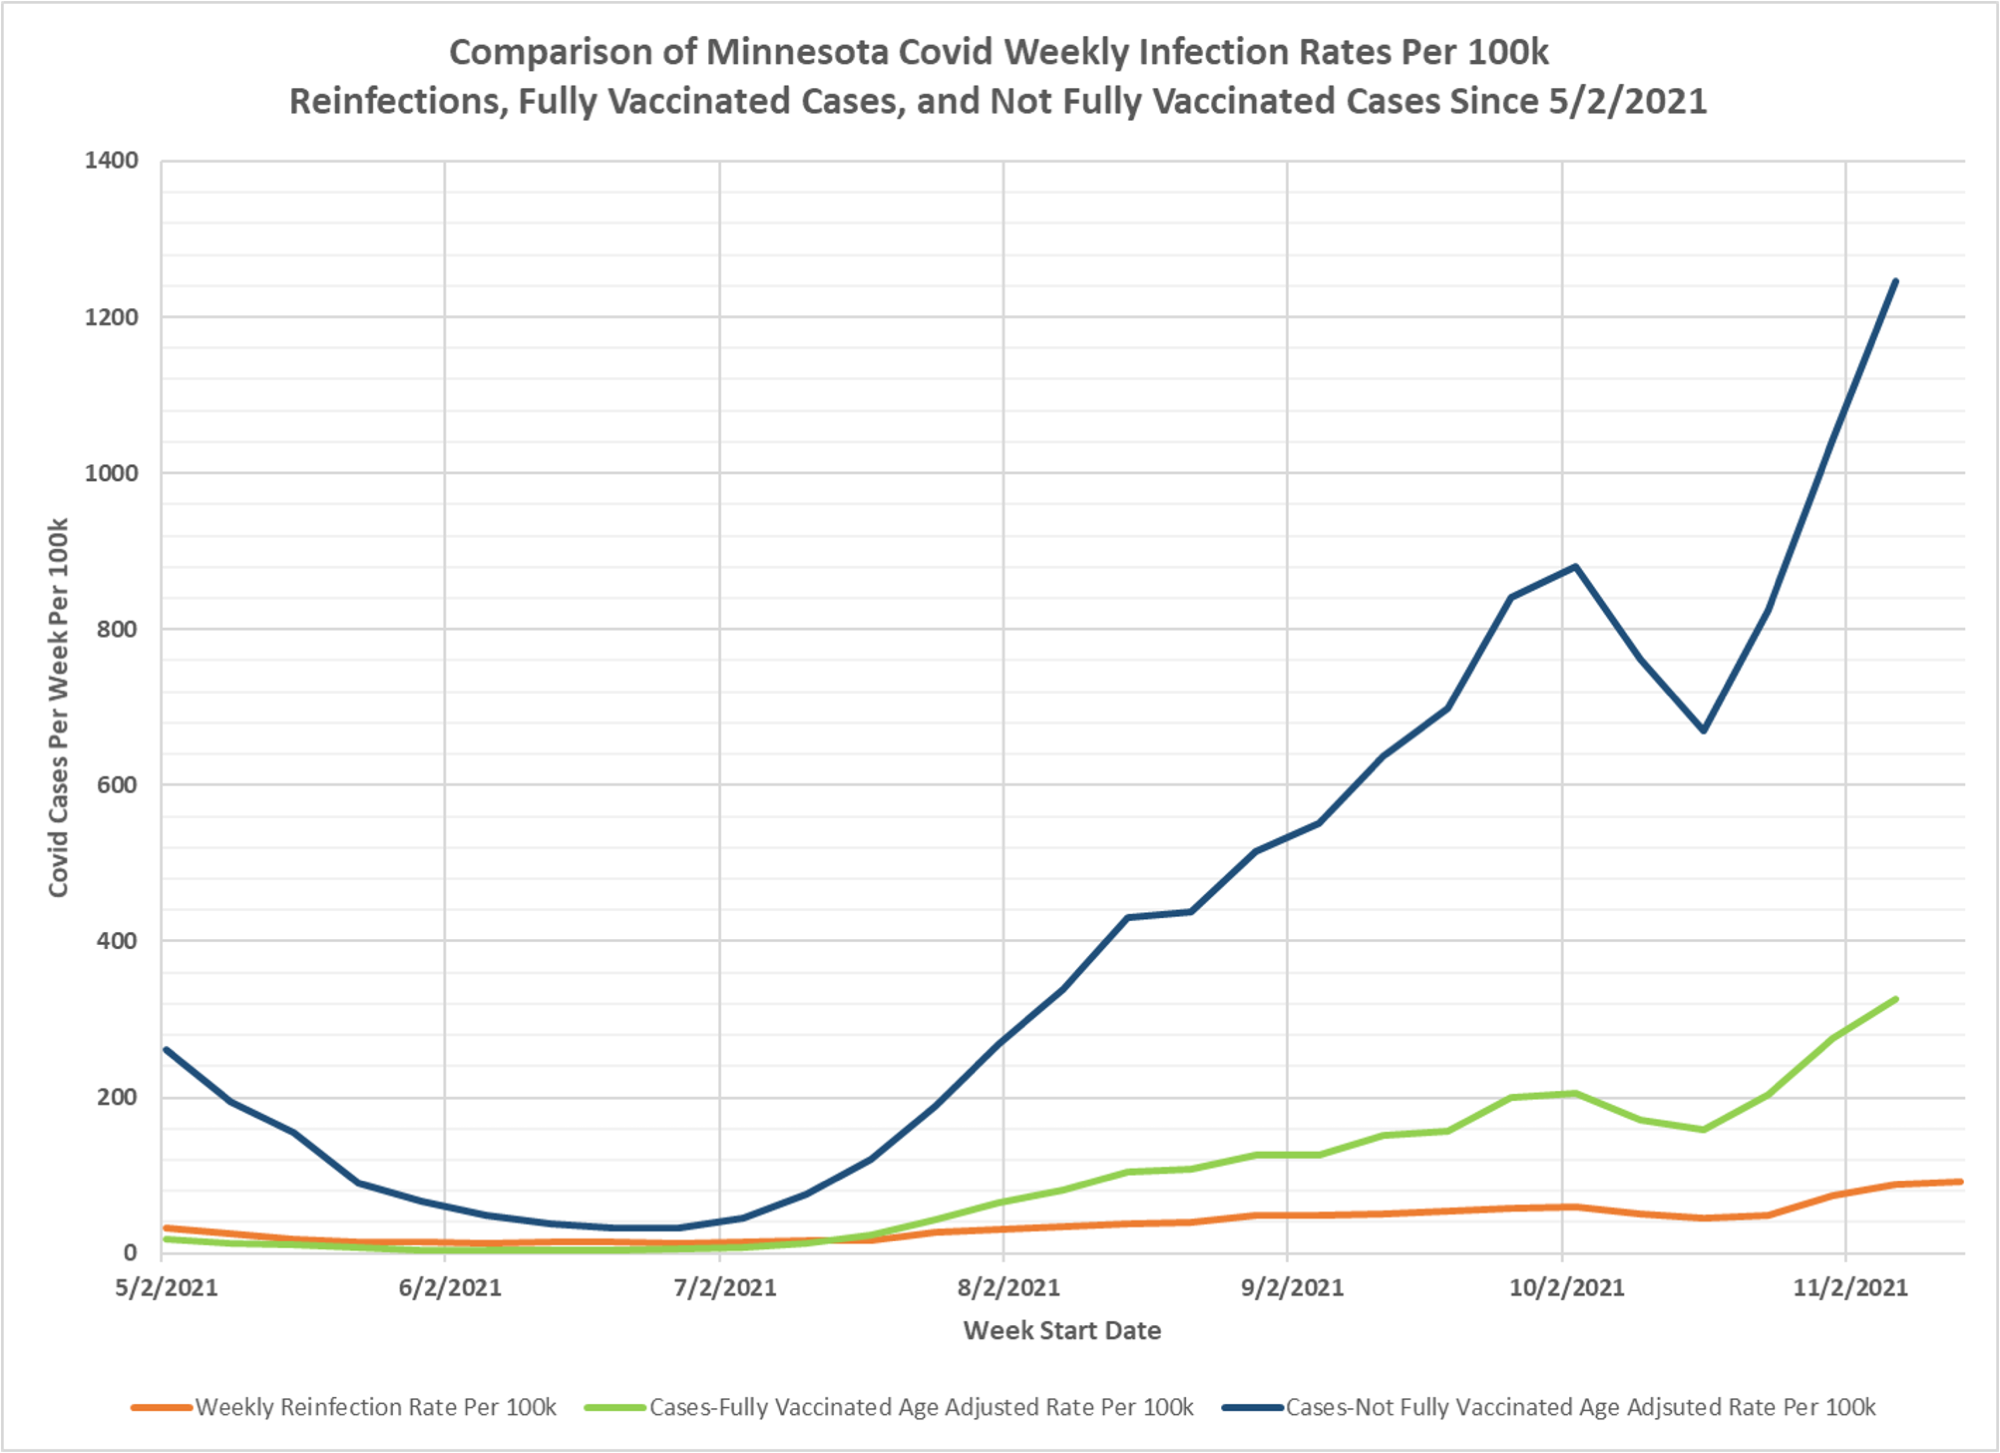
- Since 11/2/2021 Minnesota Department of Health (MDH) has published Covid reinfection data on the Minnesota Situation Update for COVID-19 web page: https://www.health.state.mn.us/diseases/coronavirus/situation.html Reinfections are defined as a person testing positive for Covid more than 90 days after a prior positive test.
- “Confirmed” reinfections are defined as a positive PCR test following a positive antigen test. Probable is defined as a negative PCR test following a positive antigen test. It is implied, similar to Cases, that a PCR positive test is considered “Confirmed” and a positive antigen test is considered “Probable”. For purposes of this analysis all Confirmed and Probable reinfections will be included.
- The weekly Covid reinfection rate displayed on the chart is calculated as the number of weekly reinfections (confirmed and probable) divided by the cumulative Total Positive Cases 90 days prior to the start of the week being considered, and the result multiplied by 100k to yield the reinfection rate per 100k per week. This is the red curve on the chart.
- The Fully Vaccinated Age Adjusted Case Rate Per Week (green curve) and Not Fully Vaccinated Age Adjusted Case Rate Per 100k (blue curve) are taken directly without modification from the Vaccine Breakthrough Report https://www.health.state.mn.us/diseases/coronavirus/stats/vbt.html from the data file for Cases, Hospitalizations, and Deaths Over Time graphic (vbtaarates.xlsx linked on this page).
- Data is plotted starting 5/2/2021, the earliest date we have breakthrough data. Reinfection data goes back to 6/28/2020, but the earlier data is more variable possibly due to the smaller population of previously infected people.
- We have no knowledge of what age adjustments performs in order to calculate the Age Adjusted Rates, and we have not yet submitted a formal query to MDH for this information.
- It is likely that there are people who may have contracted a mild enough Covid infection that they did not seek medical attention or get tested, causing an undercount of the true number of breakthrough infections, non-breakthrough infections, and reinfections.
- We do not know how thorough and comprehensive MDH’s process is in identifying reinfections or breakthrough infections.
- The main purpose in generating this chart is to try to compare the relative infection rates for previously infected people to vaccinated people, and then to unvaccinated people. We can see that throughout the Summer of 2021 the three rates were all low, during the time period in Minnesota when Covid cases were very low in general. However, unvaccinated infection rates were always the highest of the three, and for several months the reinfection rate was higher than the vaccinated breakthrough rate. On 11/14/2021, the most recent date where we can be considered to have complete breakthrough case data, the reinfection rate was 92.9 per 100k, the vaccinated infection rate was 338 per 100k, and the unvaccinated infection rate was 1289.7 per 100k. From these rates we might say that the vaccinated are 3.6 times more likely to test positive than someone who previously recovered, and the unvaccinated are 3.8 times more likely to be infected than the vaccinated.
- As of 12/13/2021 a total of 1,514,732 Minnesotans had received a booster vaccination shot. It is not known how many of these people with booster shots have tested positive.

Thanks for all your great work and daily updates. I have enjoyed the rigor of your analysis over time. As we try to understand the real world vax impact, the one observation I see in most analysis is the unvaccinated have rates today well in excess of rates we saw in 2020 when everyone was unvaccinated. If you plot unvaccinated through all of history I think you will see that unvaccinated infection rates, hospitalization rates and case fatality rates appear higher now than they were before the availability of vaccines. That is an interesting phenomenon and needs to be explored. That observation suggests some significant confounding variables with the vax and unvaccinated populations. Unfortunately, it appears vaccine uptake is correlated to people who also value health and trust the medical profession. Their baseline health is more than likely superior to those who don’t have a doctor and avoid the healthcare system at all costs. I am looking into some data from Health and Human services on total patients hospitalized and their vax status. They are collecting this info from hospitals but not very many appear to be reporting correctly. I looked at my local hospital here in Columbus, OH (Ohio State Medical Center) and it appears they are reporting correctly and in the most recent weeks they report that patients in the hospital (all patients not just covid) are only 30%-40% vaccinated. This suggests to me that for whatever reason the people who end up in the hospital are not vaccinated regardless of why they are there. This is another clue that baseline health is not the same between the two populations. I would appreciate your thoughts on my observations.
could well be that healthier people to begin with are getting vaxed, but not really sure I have seen evidence on that.