Another update, interesting to test seasonality and see other trends. Others have noticed the uptick in bed use. This is due to longer length of stay per admission. It isn’t due to sicker people. Many patients who aren’t ready to go home but don’t need intensive care would be transferred to a step-down or skilled nursing bed. But there aren’t any of those available, so the patients are kept in the hospital. Why aren’t there skilled nursing beds? The same reason hospital beds have declined. Vaccine mandates. Staff quit or are fired, capacity drops and voila, you have patients staying longer in the hospital. The state won’t admit that, but this is the cause. And in the cases and deaths chart you see not only the seasonality, but you do see the beneficial effect of vaccines and a lot of natural immunity, as the shape and timing is similar, but the peaks lower.
Dave Dixon’s notes:
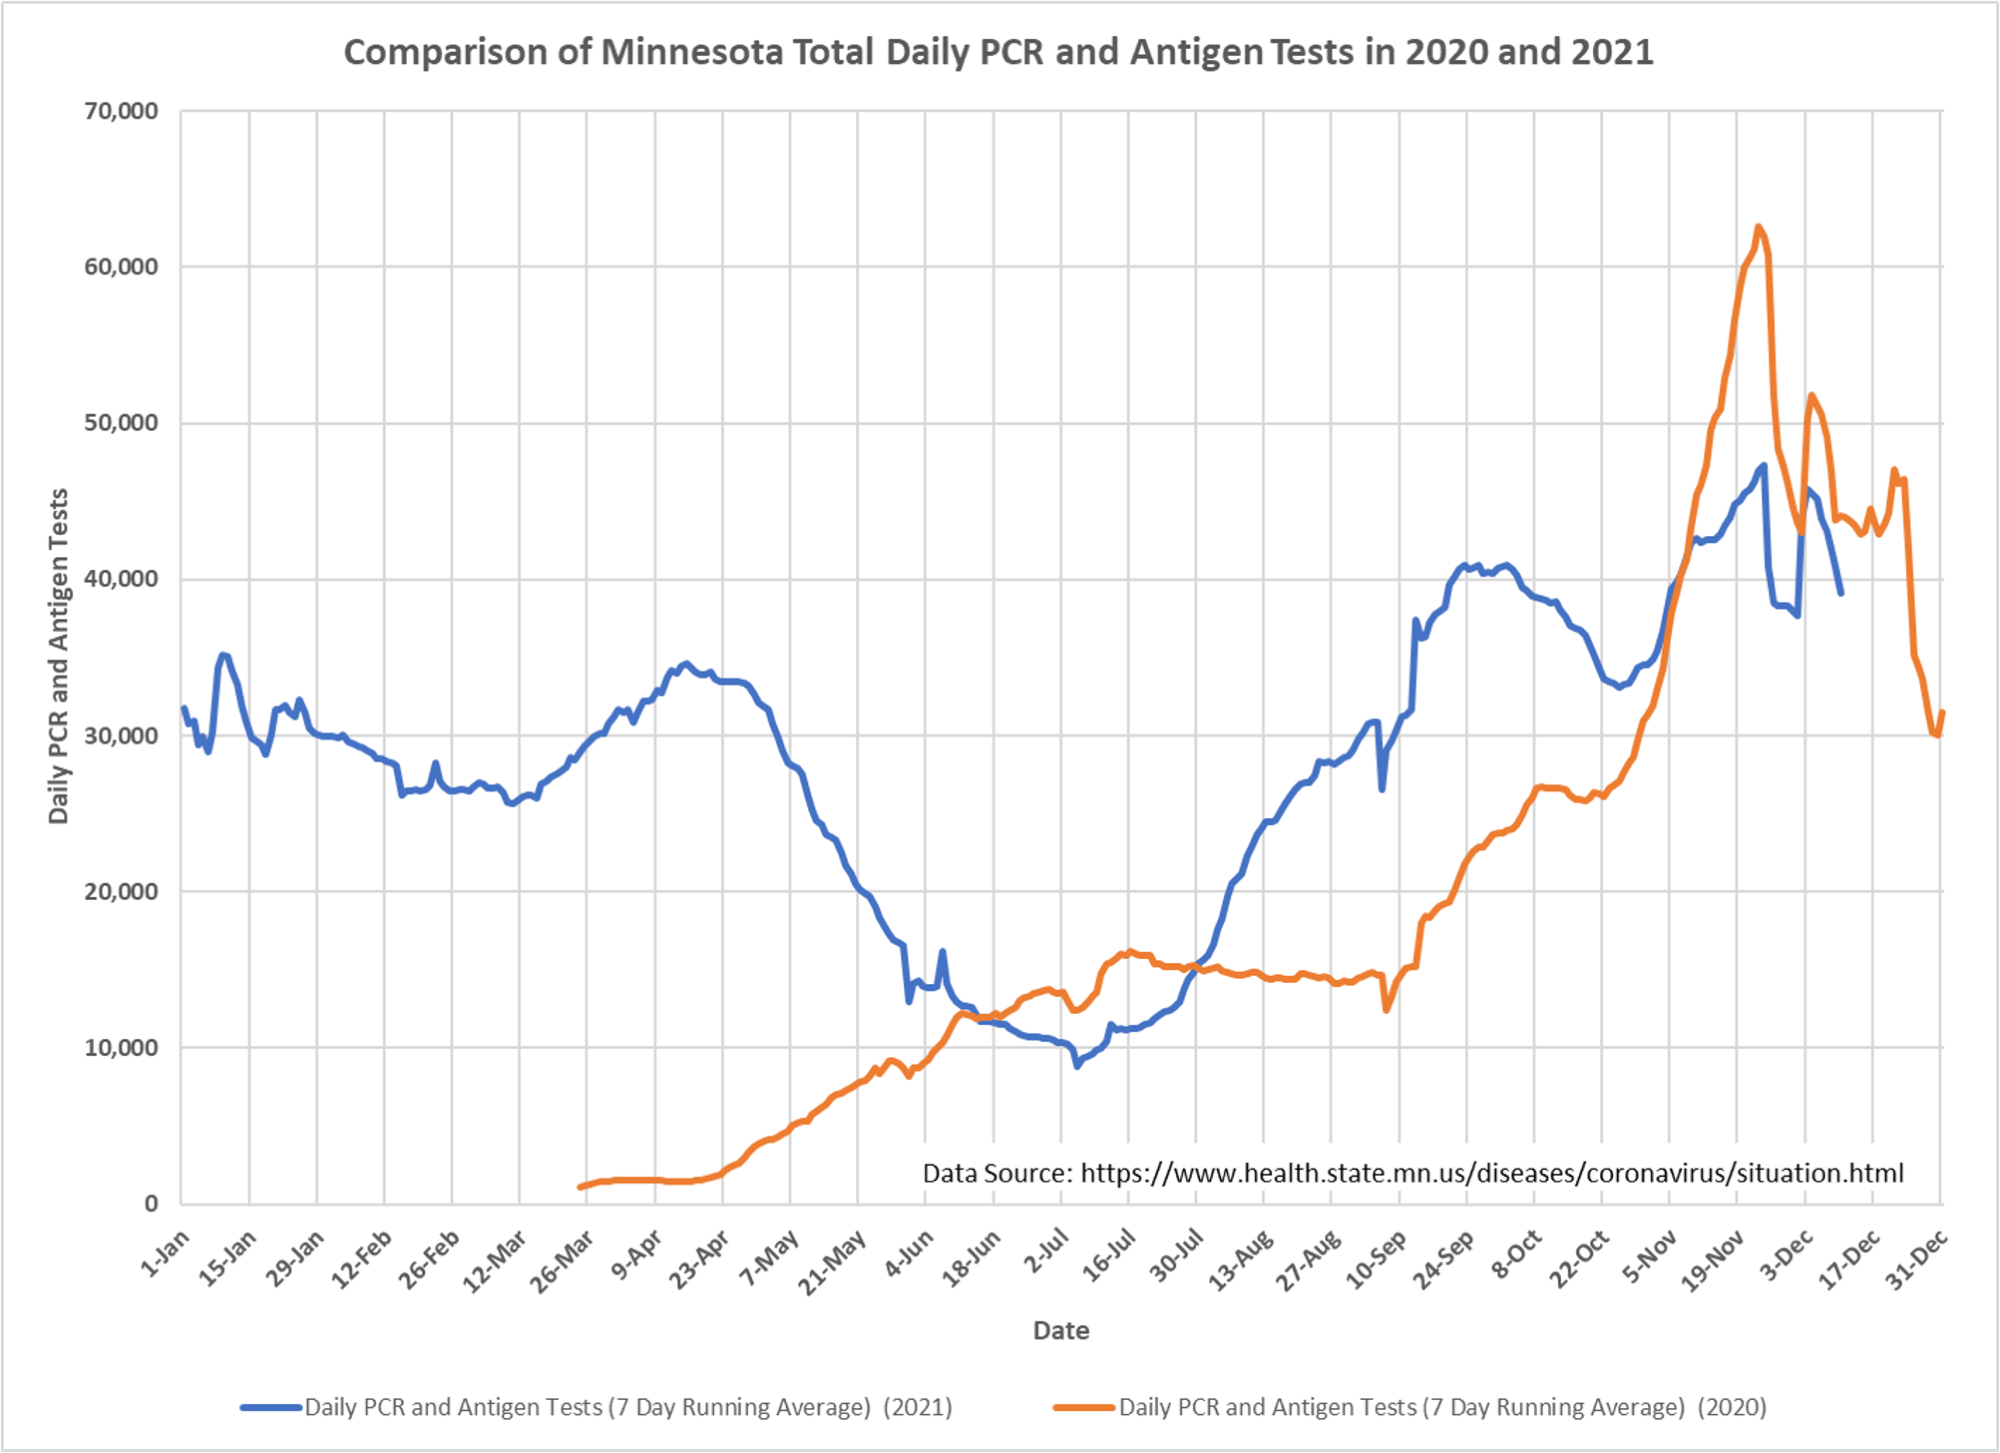
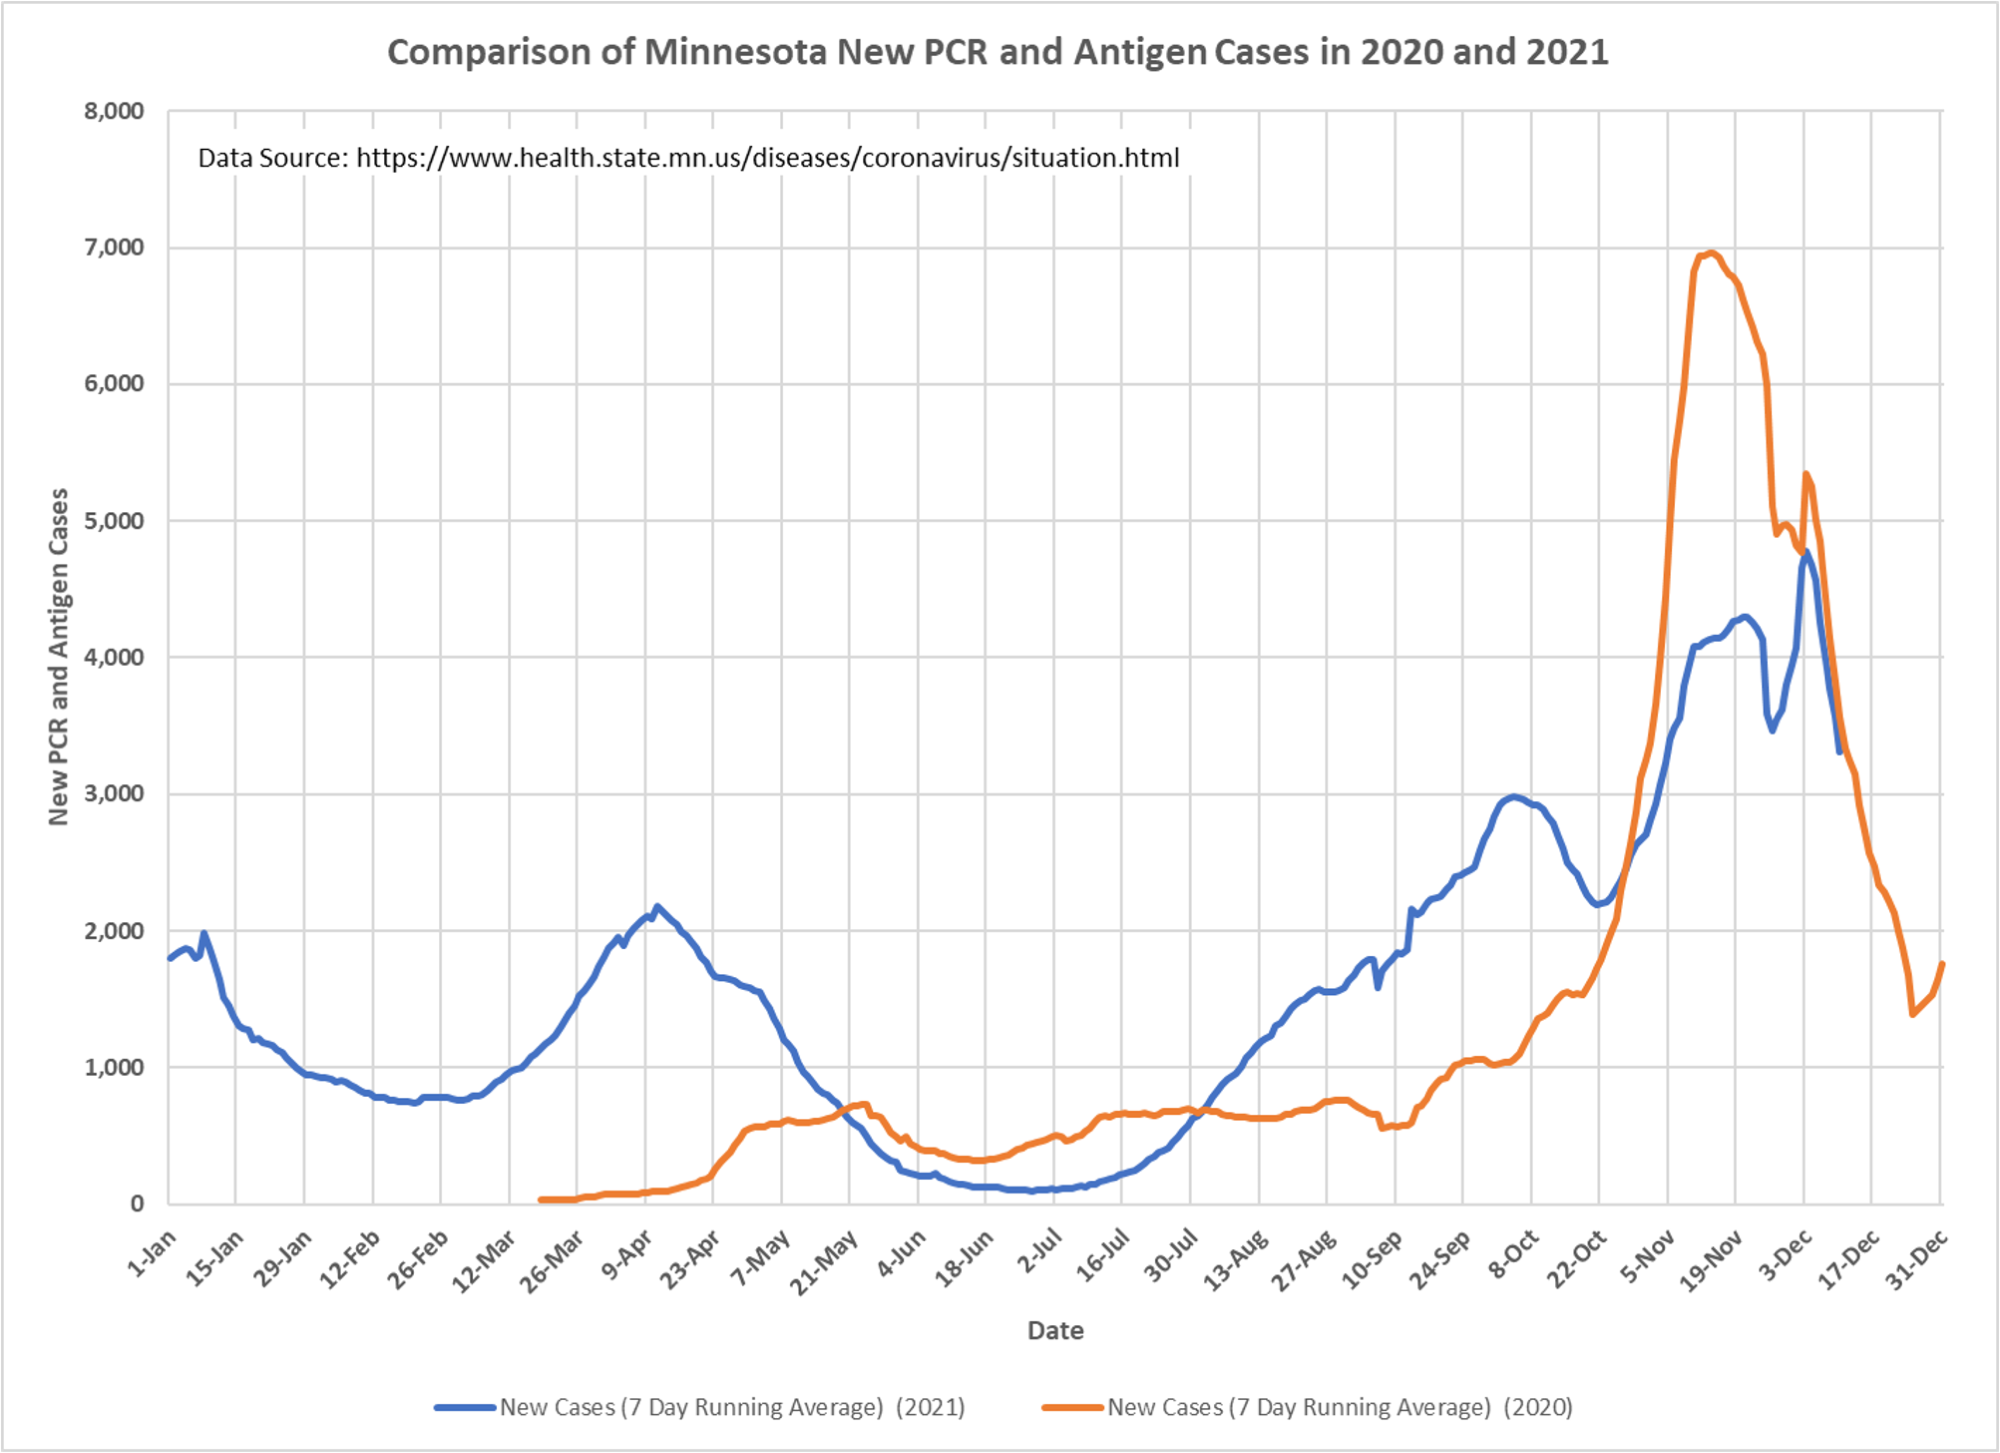
1. The 7 day running average new daily cases peaked again on December 2, mirroring the decline in testing which started at approximately the same date. It appears that the decline in cases is actual, and not an artifact of missing reports.
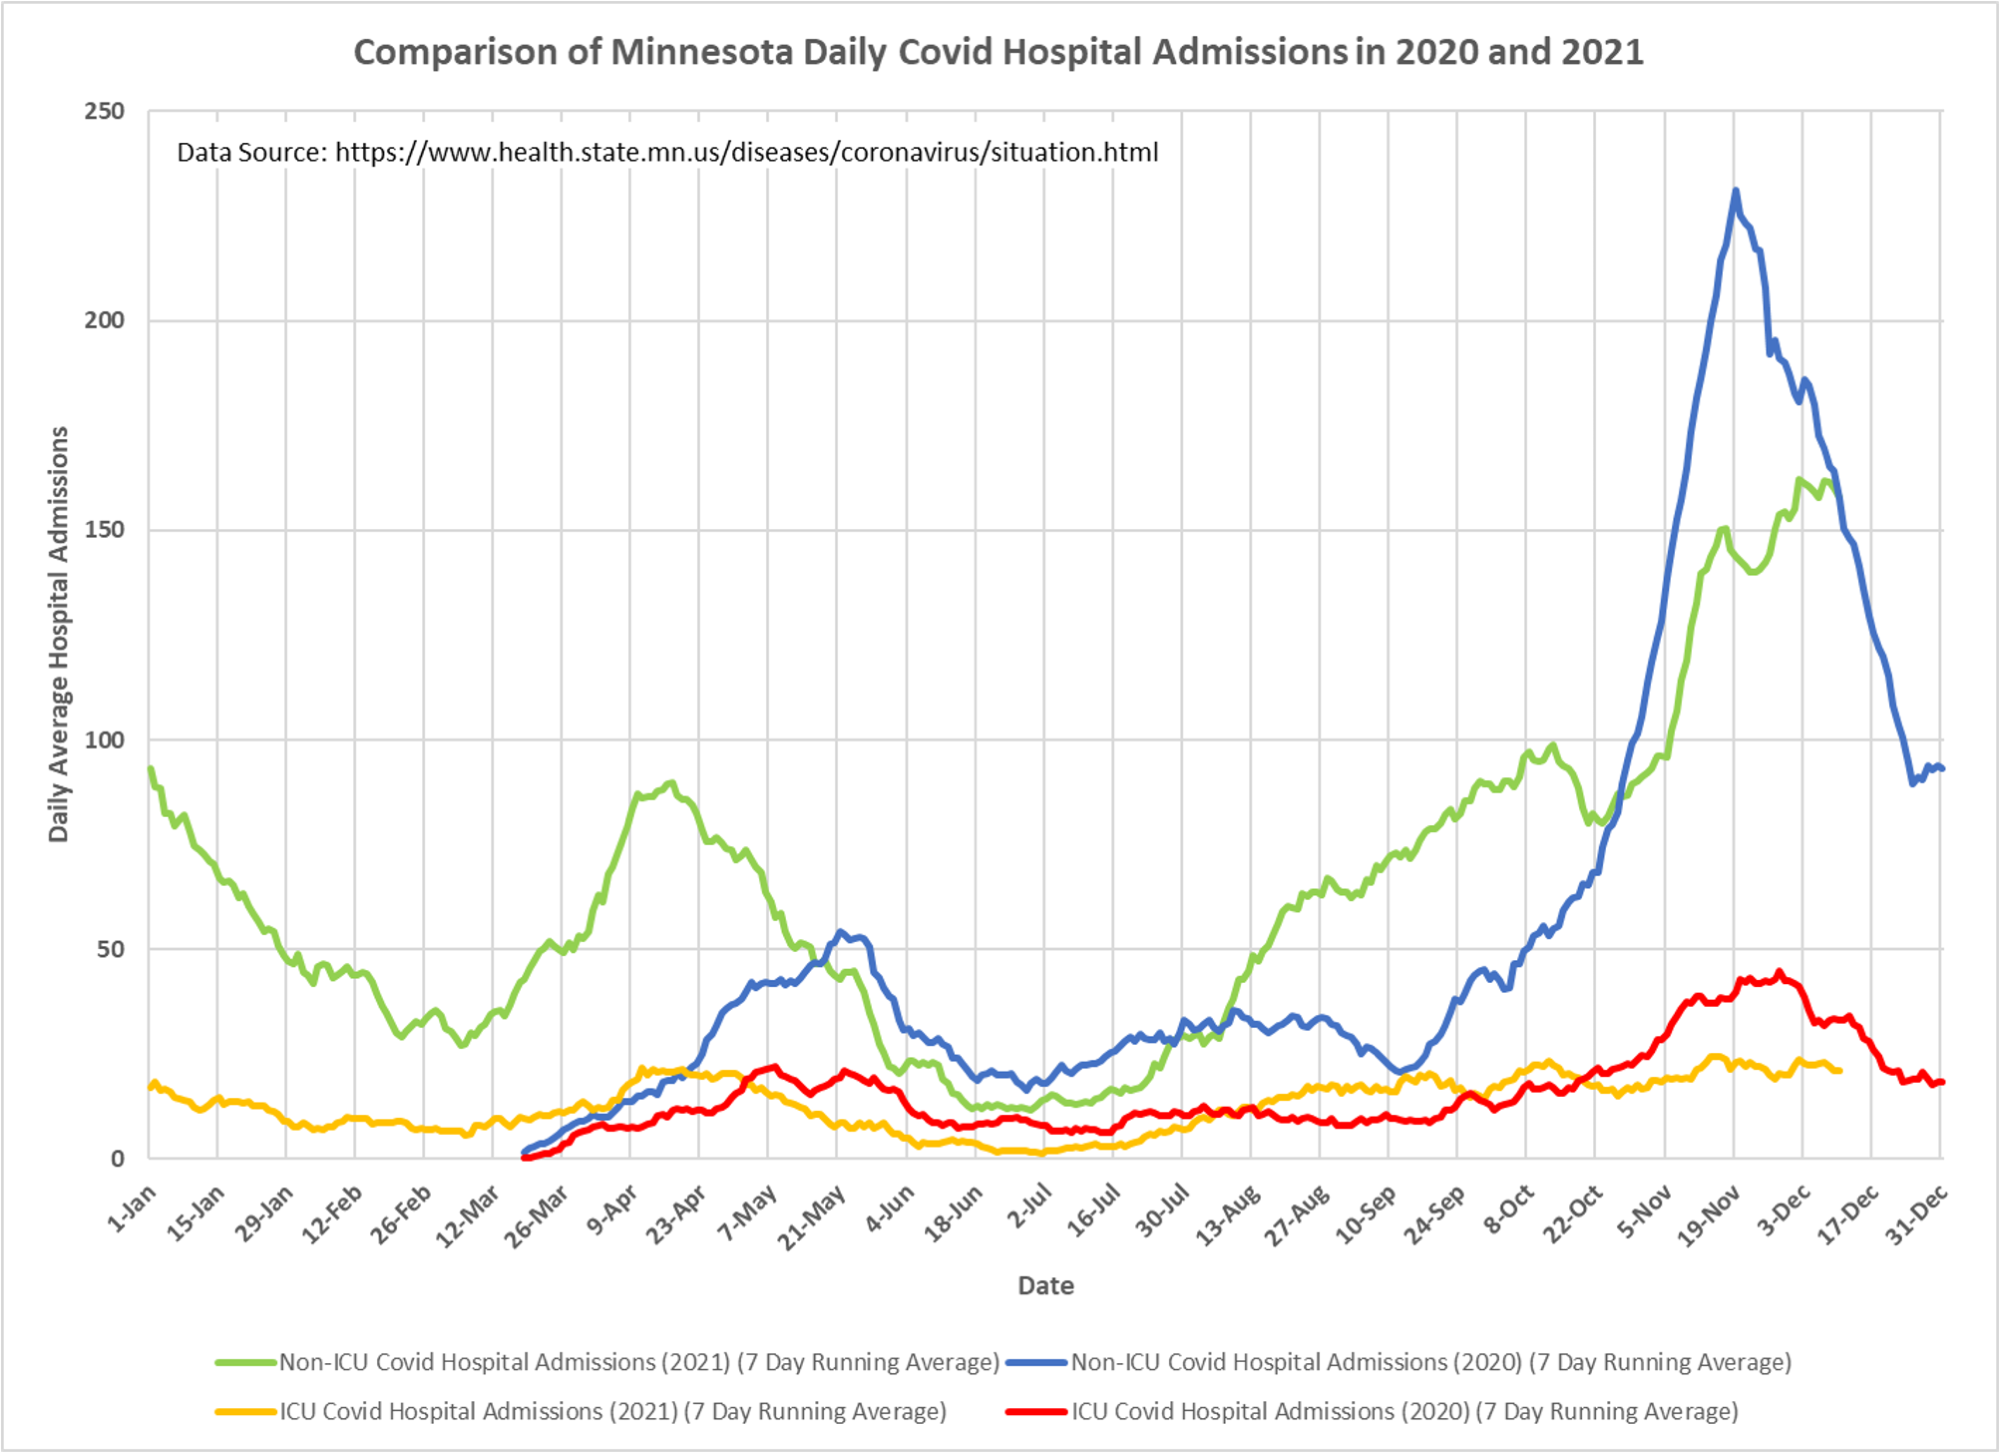
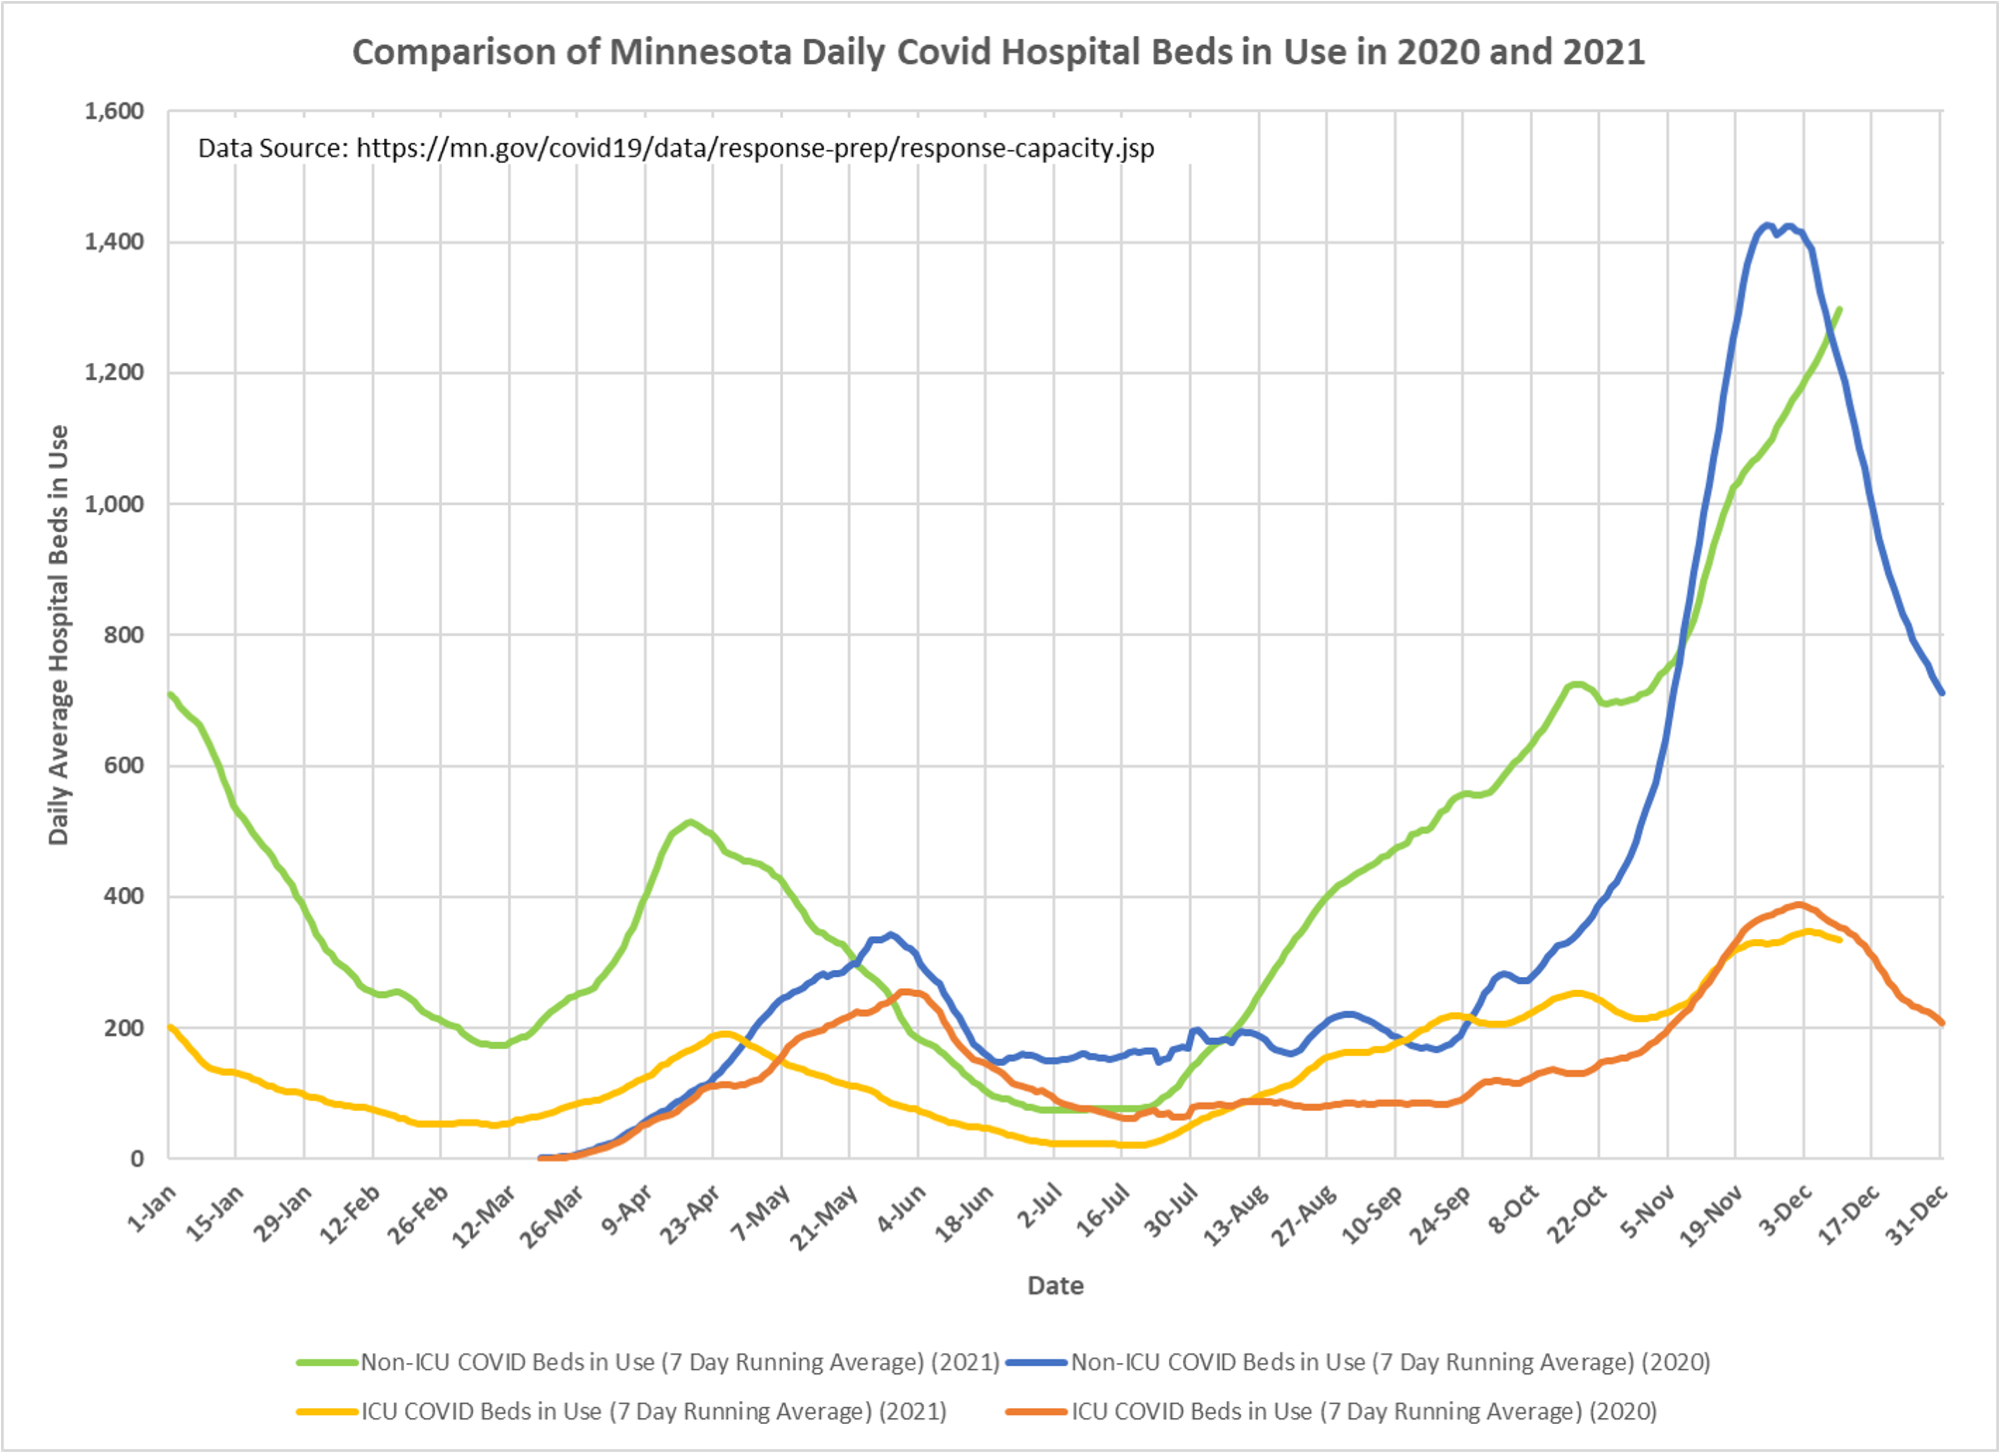
2. Hospital admissions have roughly levelled off, while hospital beds in use continues to climb, now exceeding the beds in use last year on the same date.
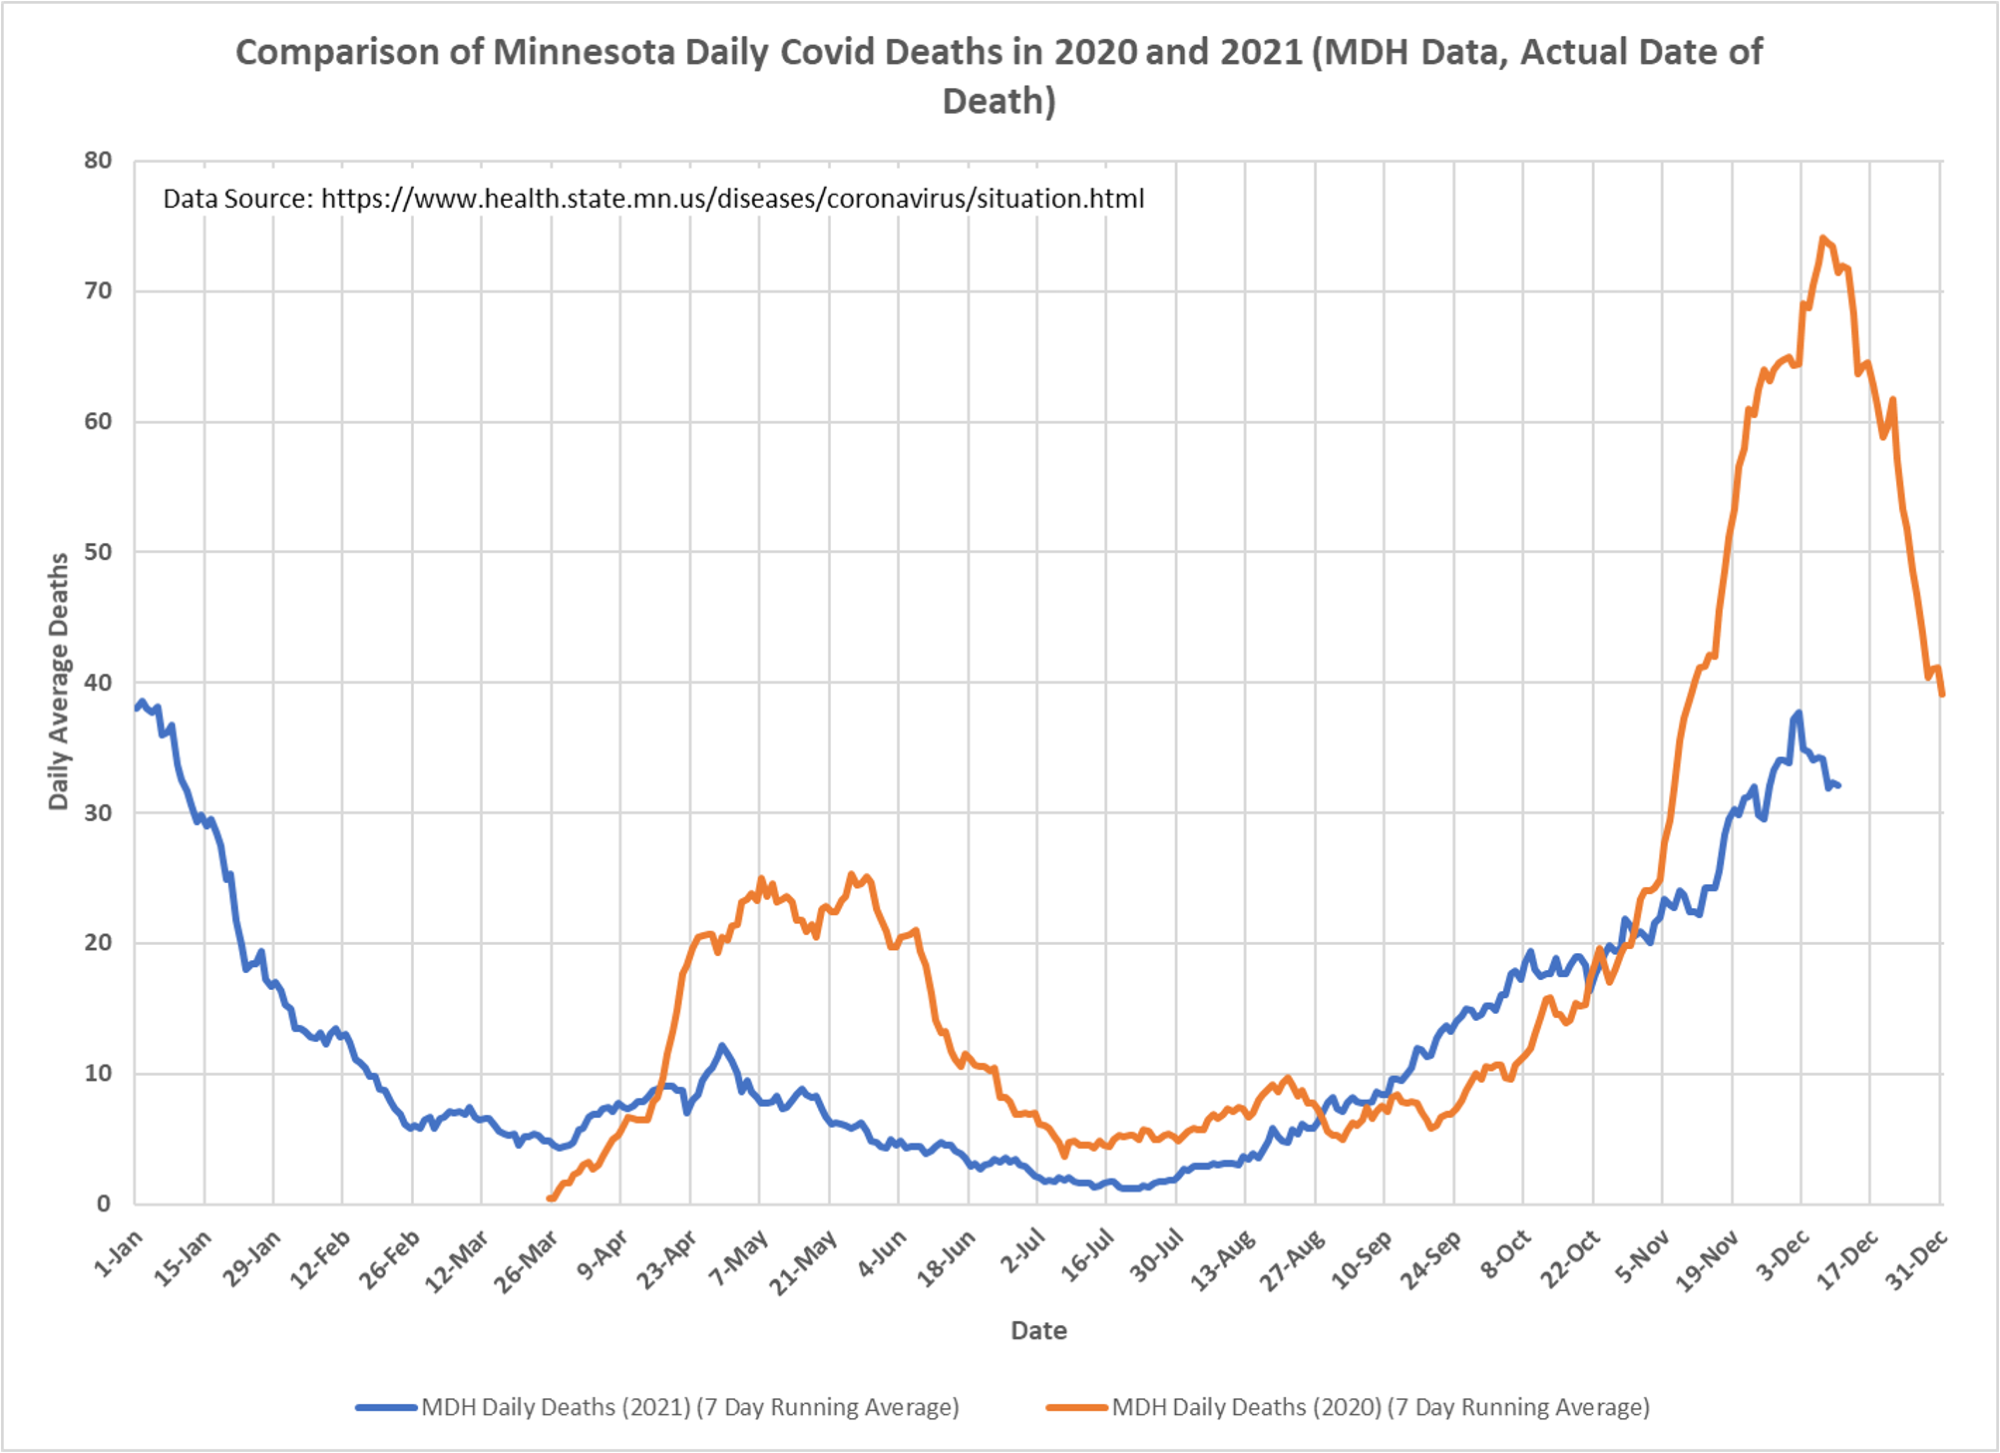
2, All data for testing, cases, hospital admissions, and deaths are taken from the data table on the Minnesota Situation Update page: https://www.health.state.mn.us/diseases/coronavirus/situation.html The only modification to the data is to calculate 7 day running averages in order to make the trends easier to see.
3. The underlying data for hospital beds in use is taken from the Teletracking data file found on the Response and Preparation web page: https://mn.gov/covid19/data/response-prep/response-capacity.jsp The Teletracking data file is also cited as the data source for the graphic on this same page. 7 day running averages are calculated for beds in use as well.
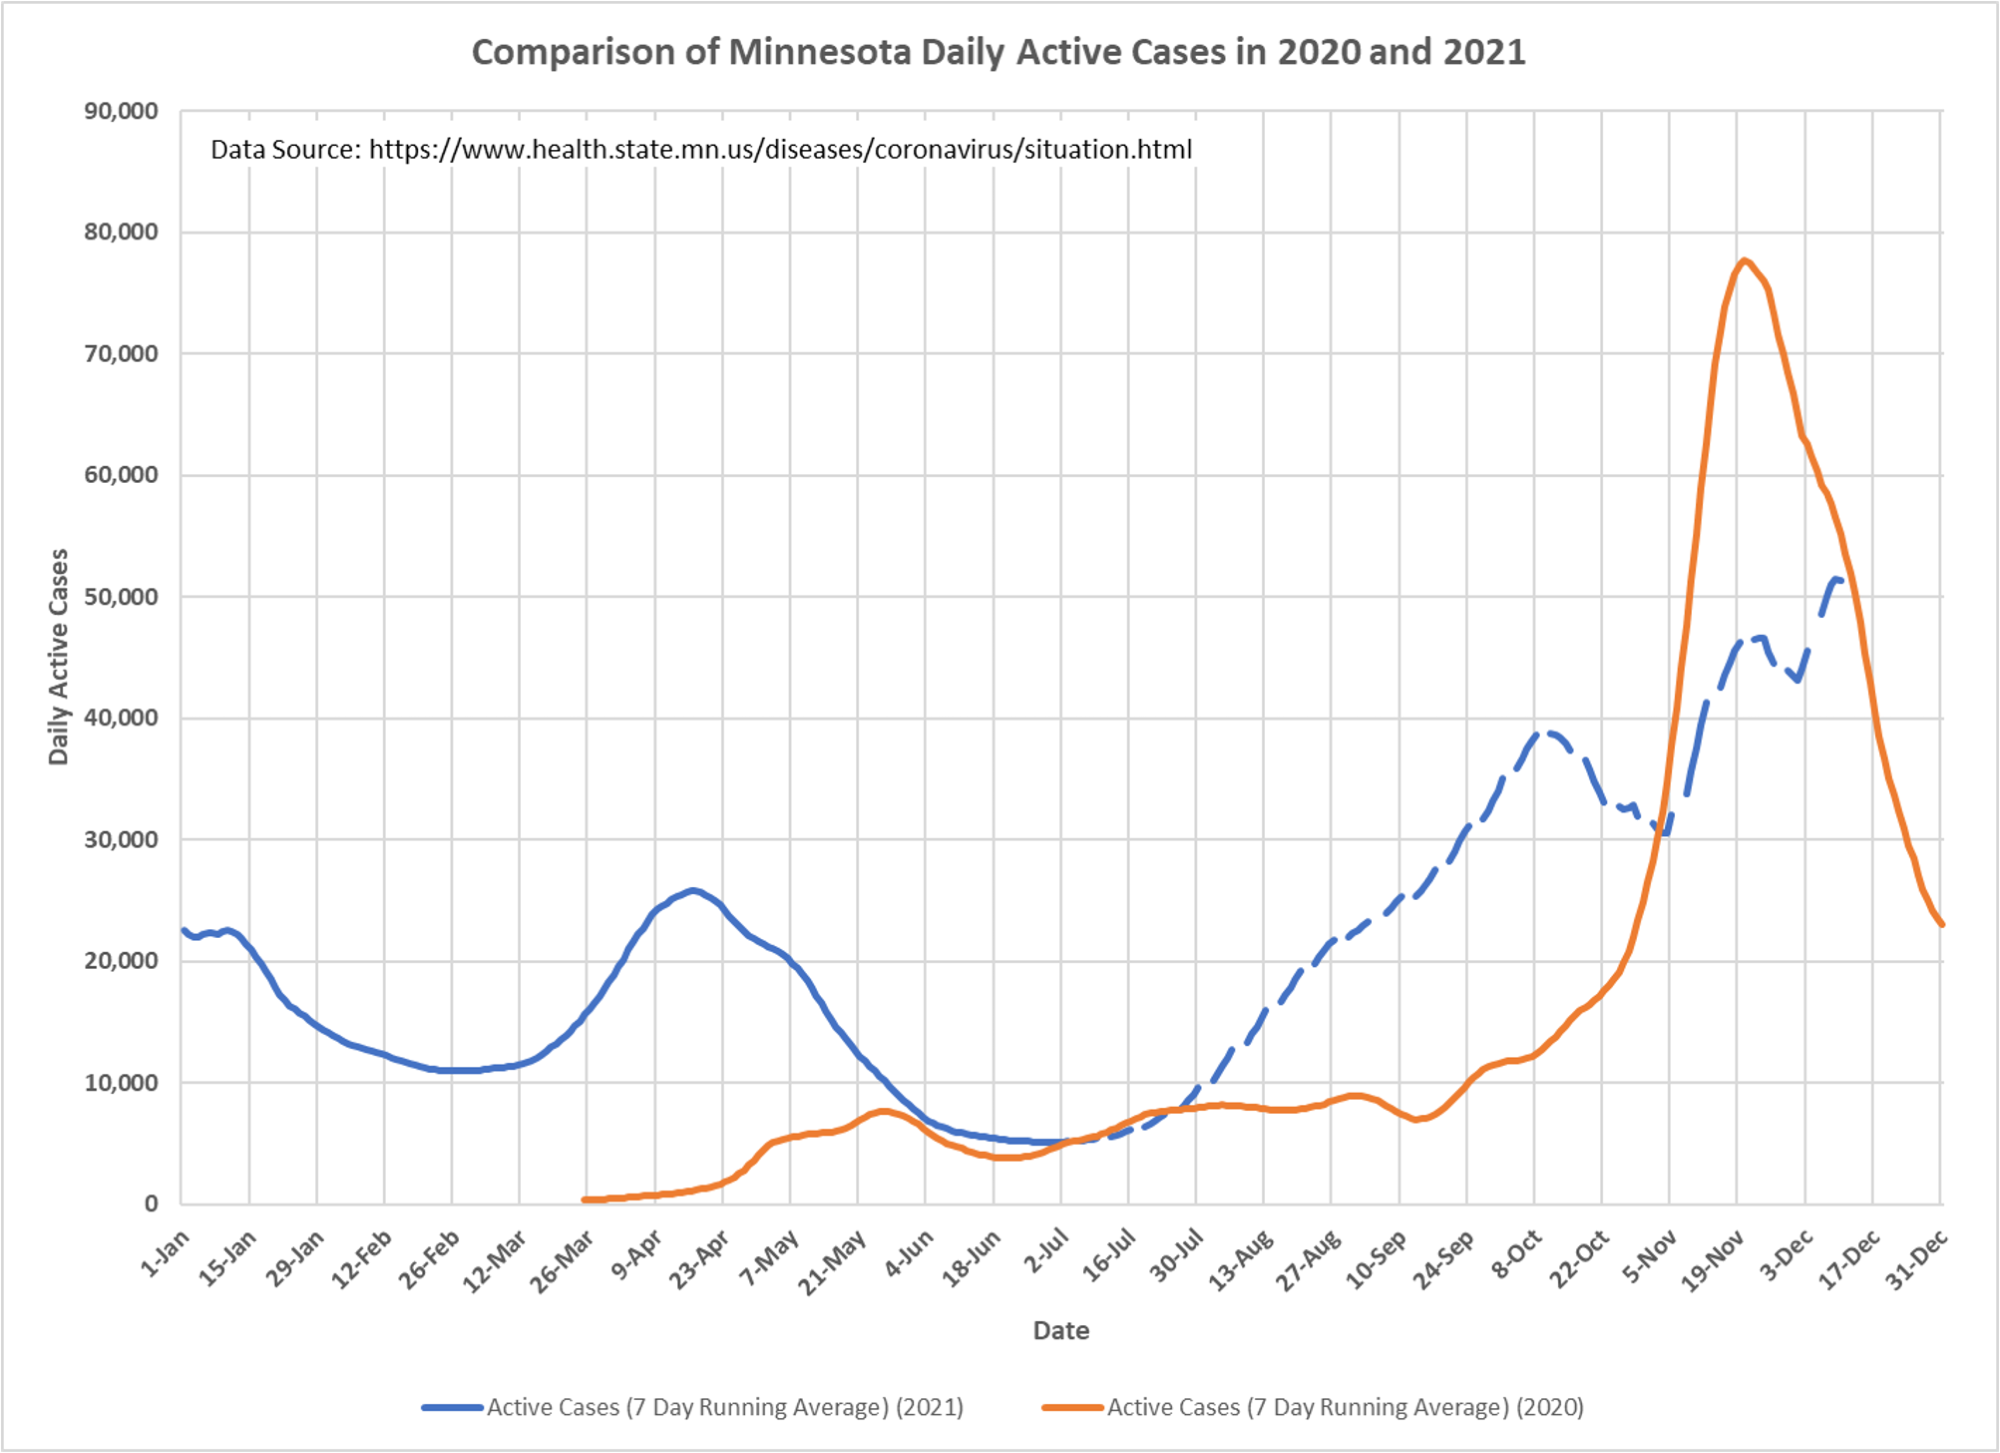
4. Active cases are calculated as the cumulative PCR and antigen positive cases minus cumulative deaths minus the people No Longer Needing Isolation. The No Longer Needing Isolation total is found on the Situation Update page. IN recent days MDH has started publishing the Total Positive People (Cumulative) statistic. It is on our to-do list to figure out the impact of this reporting change on Active Cases.
5. For all charts the most recent 7 days of data is excluded, in order to avoid charting incomplete data.
6. It is concerning that the hospital beds in use continues to climb while the daily admissions has levelled off. In addition, the new daily admissions is roughly 71% of the late 2020 peak, while hospital beds in use currently are roughly 91% of the late 2020 peak. I believe this means that the average length of stay for treatment of Covid is longer now compared to the 2020 peak, or that people are experiencing more severe symptoms from Covid, or that people are being admitted for more mild symptoms than in 2020. Since deaths in 2021 peaked at approximately 50% of the 2020 peak it seems unlikely that Covid disease is more severe this year, although better treatments may account for the lower number of deaths.